Abstract
Background and purpose:
NMDA receptors are important molecular targets of ethanol action in the CNS. Previous studies have identified a site in membrane-associated domain 3 (M3) of the NR1 subunit and two sites in M4 of the NR2A subunit that influence alcohol action; the sites in NR2A M4 also regulate ion channel gating. The purpose of this study was to determine whether mutations at the site in the NR2A subunit corresponding to the NR1 M3 site influence alcohol action and ion channel gating.
Experimental approach:
We investigated the effects of mutations at phenylalanine (F) 637 of the NR2A subunit using whole-cell and single-channel patch-clamp electrophysiological recording in transiently-transfected HEK 293 cells.
Key results:
Mutations at F637 in the NR2A subunit altered peak and steady-state glutamate EC50 values, maximal steady-state to peak current ratios (Iss:Ip), mean open time, and ethanol IC50 values. Differences in glutamate potency among the mutants were not due to changes in desensitization. Ethanol IC50 values were significantly correlated with glutamate EC50 values, but not with maximal Iss:Ip or mean open time. Ethanol IC50 values were linearly and inversely related to molecular volume of the substituent.
Conclusions and implications:
These results demonstrate that NR2A(F637) influences NMDA receptor affinity, ion channel gating, and ethanol sensitivity. The changes in NMDA receptor affinity are likely to be the result of altered ion channel gating. In contrast to the cognate site in the NR1 subunit, the action of ethanol does not appear to involve occupation of a critical volume at NR2A(F637).
Keywords: glutamate receptor, ethanol, electrophysiology, mutant, desensitization, affinity
Introduction
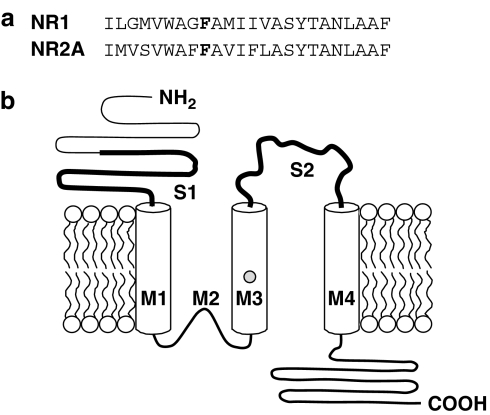
Ethanol (EtOH) is a sedative-hypnotic agent that has been widely used and abused throughout much of human history. Because relevant brain concentrations of EtOH are in the millimolar range, it interacts with low affinity with multiple molecular sites in the brain. However, it is considered to produce its effects on central nervous system function primarily by interacting with ligand-gated ion channels (Peoples et al., 1996). Besides GABAA receptors, one such ion channel that is a key target of alcohol action in the brain is the N-methyl-D-aspartate (NMDA) receptor, a subtype of glutamate receptor that contains two NR1 subunits, which bind the obligatory coagonist glycine (Kuryatov et al., 1994; Lynch et al., 1994), and two NR2 subunits, which bind glutamate (Laube et al., 1997; Anson et al., 1998). The inhibitory effects of EtOH on NMDA receptors in an array of experimental preparations have been well-documented (Peoples, 2003). Attempts to identify the molecular locus of EtOH action on the NMDA receptor have recently focused on a small number of amino acids in the membrane-associated (M) domains of both the NR1 and NR2 subunits. In particular, substitution mutations at phenylalanine (F639 in M3 of the NR1 subunit (Ronald et al., 2001)) and methionine (M) 823 and alanine (A) 825 in the M4 domain of the NR2A subunit (Ren et al., 2003b; Honse et al., 2004), influence NMDA-receptor EtOH sensitivity. Because of the high homology of the M domains between NR1 and NR2 subunits, it is plausible that each of these sites has a corresponding EtOH-sensitive site in the other subunit type. Furthermore, because substitution mutations at the sites in the NR2A subunit M4 domain identified by our laboratory affect ion channel gating (Ren et al., 2003a, 2003b; Honse et al., 2004), we considered it possible that the cognate site of NR1(F639) in the NR2A subunit, F637 (Figure 1), would have a similar regulatory action on ion channel gating. We report here that substitution mutations at NR2A(F637) altered glutamate potency, ion channel gating and EtOH sensitivity.
Figure 1.
A phenylalanine residue in M3 of the NMDA receptor NR1 subunit is conserved in the NR2A subunit. (a) Sequences of the M3 domains of the NR1 and NR2A subunits. The conserved phenylalanine is shown in bold type. (b) Topological model of the NR2A subunit showing the membrane-associated domains (M1–M4), ligand-binding domains (S1–S2, bold lines) and presumed position of F637 (shaded circle).
Materials and methods
Site-directed mutagenesis, cell culture and transfection
Site-directed mutagenesis in plasmids containing NR2A subunit cDNA were performed using the QuikChange kit (Stratagene, La Jolla, CA, USA) and all mutants were verified by double-strand DNA sequencing. Human embryonic kidney 293 cells were transfected with NR1-1a, NR2A and green fluorescent protein at a ratio of 2:2:1 using the calcium phosphate transfection kit (Invitrogen, Carlsbad, CA, USA). To protect transfected cells from the excitotoxic effects of amino acids in the culture medium, 100 μM ketamine and 200 μM D,L-2-amino-5-phosphonovaleric acid were added to the culture medium; cells were extensively washed to remove these agents before use in experiments. Cells were used in experiments 15–48 h after transfection.
Electrophysiological recording
Whole-cell and single-channel patch-clamp recording were performed at room temperature using an Axopatch 1D or Axopatch 200B (Molecular Devices, Sunnyvale, CA, USA) amplifier. In whole-cell recordings, patch-pipettes with open tip resistances of 1–8 MΩ were used. Series resistances of 2–7 MΩ (in glutamate concentration–response experiments) or 5–15 MΩ (in concentration–response experiments) were compensated by 80%. In single-channel recordings, patch-pipettes were coated with R6101 elastomer (Dow-Corning, Midland, MI, USA) and had tip resistances of 7–15 MΩ following fire polishing. Cells were voltage-clamped at −50 mV and superfused in an external recording solution containing (in mM) 150 NaCl, 5 KCl, 0.2 CaCl2, 10 N-2-hydroxyethylpiperazine-N′-2-ethanesulfonic acid (HEPES), 10 glucose and 10 sucrose (pH 7.4). Low calcium was used to minimize calcium-dependent inactivation (Zilberter et al., 1991); calcium concentration did not alter NMDA receptor inhibition by EtOH (results not shown). In lifted cell experiments, the external solution also contained 10 μM EDTA. The intracellular recording solution in whole-cell experiments contained (in mM) 140 CsCl, 2 Mg4ATP, 10 1,2-bis(2-aminophenoxy)ethane-N,N,N′,N′-tetraacetic acid and 10 HEPES (pH 7.2). In single-channel cell-attached patch recordings, the patch-pipette contained glutamate (0.1–100 μM) glycine (50 μM) and EDTA (10 μM) in external solution. Solutions of agonists and EtOH were applied to cells using a stepper motor-driven solution exchange apparatus (Warner Instruments, Hamden, CT, USA) and three-barrel square glass tubing of internal diameter 600 μm. In glutamate concentration–response experiments, cells were lifted off the surface of the dish to increase the speed of the solution exchange; under these conditions 10–90% rise times for solution exchange are ∼1.5 ms (Ren et al., 2003a). Concentration–response data were filtered at 2 kHz (8-pole Bessel) and acquired at 5 kHz on a computer using a DigiData interface and pClamp software (Molecular Devices). Single-channel data were filtered at 10 kHz (4-pole Bessel) and acquired at 50 kHz.
Data analysis
In concentration–response experiments, IC50 or EC50 and n (slope factor) were calculated using the equation: y=Emax/1+(IC50 or EC50/x)n, where y is the measured current amplitude, x is concentration, n is the slope factor and Emax is the maximal current amplitude. Statistical differences among concentration–response curves were determined by comparing log transformed EC50 or IC50 values from fits to data obtained from individual cells using analysis of variance (ANOVA) followed by the Dunnett and Tukey–Kramer tests. Comparisons among mean values of log EC50, log IC50 or maximal steady-state to peak current ratio (Iss:Ip) for the various mutants were made using correlation analysis and tests for linear relations of these values to amino-acid physicochemical scales (Ren et al., 2003a) were made using linear regression analysis.
Data from single-channel recordings were digitally filtered at 5 kHz (8-pole Bessel) and idealized using the segmentation K-means algorithm (Qin, 2004) in the QUB software suite (available at http://www.qub.buffalo.edu). Dwell time histograms were fitted with multiple exponential components using Clampfit (Molecular Devices) and mean open times were obtained from the proportionally weighted averages of the individual components. Data were obtained from three to six patches for each NR2A-receptor mutant tested; the average number of opening events for each patch was 16 700.
Materials
EtOH (95%, prepared from grain) was obtained from Aaper Alcohol & Chemical Co. (Shelbyville, KY, USA) and all other drugs and chemicals were obtained from Sigma Chemical Co. (St. Louis, MO, USA).
Results
Effects of mutations at NR2A(F637) on EtOH sensitivity
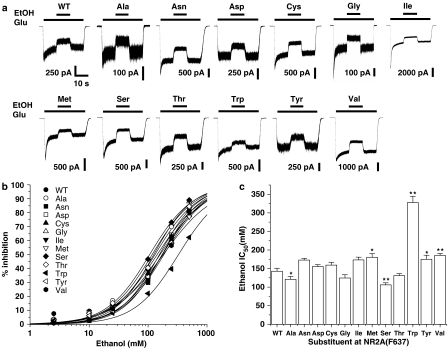
To test whether mutations at NR2A(F637) affect EtOH sensitivity, we constructed a panel of substitution mutants at this position and performed concentration–response experiments for EtOH inhibition in the mutant receptors. We found that all the mutations at this site that were tested yielded functional receptors (Figure 2). Although there is variation in amplitude among the current traces shown in Figure 2a, values of peak density of current activated by maximal concentrations of glutamate (300 μM) and glycine (50 μM) varied over a large range among individual cells expressing a given mutant subunit (the difference between high and low values of peak current density for each mutant was 1150 pA/pF on average), apparently as a result of variable transfection efficiency. None of the mutant receptors had a mean value of peak current density that was significantly different from that of the wild-type receptor (wild-type value: 600±441 pA/pF; mean±s.e.). Figure 2a also shows that all the mutant subunits were inhibited by EtOH. Concentration–response curves for EtOH inhibition were essentially parallel to each other, as the slope factors of the curves did not differ significantly, but statistical analysis revealed that there was a highly significant effect of mutations at this site on EtOH IC50 (ANOVA, P<0.0001) and significant differences in EtOH IC50 values among the various mutants. EtOH IC50 values were significantly increased in four of the mutants. Tryptophan substitution at F637 produced the greatest increase in EtOH IC50, whereas alanine or serine substitutions significantly decreased the EtOH IC50.
Figure 2.
Effect of EtOH on NMDA-activated current in cells expressing NR2A(F637) mutant subunits. (a) Records are currents activated by 10 μM glutamate (Glu) and 50 μM glycine in the absence and presence of 100 mM EtOH in human embryonic kidney (HEK) 293 cells coexpressing NR1 and wild-type (WT) NR2A or various NR2A(F637) substitution mutant subunits. (b) Concentration–response curves for EtOH inhibition of current activated by 10 μM glutamate (Glu) and 50 μM glycine in HEK 293 cells coexpressing NR1 and wild-type NR2A (WT) or various NR2A(F637) substitution mutant subunits. Data points are means of five to 12 cells and curves shown are the least-squares fits to the equation given in Materials and methods. (c) Bar graph shows IC50 values for EtOH in cells expressing the various NR2A(F637) mutant subunits. Asterisks indicate IC50 values that differed significantly (ANOVA and Dunnett's test; *P<0.05, **P<0.01) from the IC50 for WT NR1/NR2A subunits.
Effects of mutations at NR2A(F637) on agonist sensitivity and desensitization
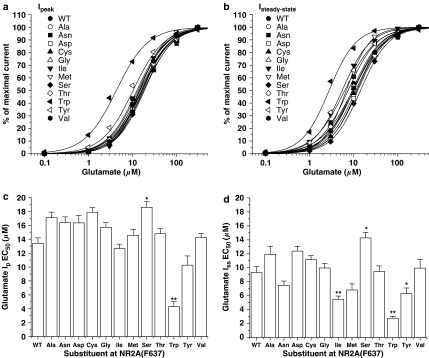
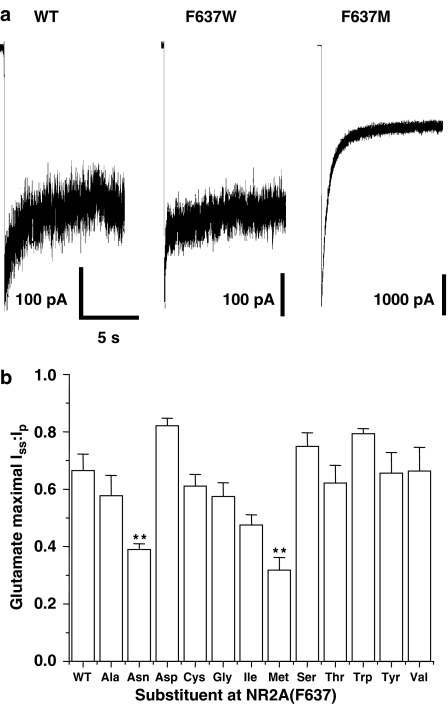
To test whether mutations at NR2A(F637) also affected physiological characteristics of the receptor such as glutamate sensitivity and desensitization, we performed concentration–response experiments for glutamate in the series of mutant receptors using a rapid solution exchange apparatus in lifted cells (Figure 3). For the series of mutants, highly significant differences were obtained in the EC50 values for glutamate-activated peak (P<0.0001; ANOVA) and steady-state (P<0.0001; ANOVA) current and for the steady-state to peak current ratio (Iss:Ip; P<0.0001; ANOVA). The EC50 for glutamate activation of peak current was not altered by the majority of the mutations at NR2A(F637), but was strikingly decreased by substitution of tryptophan, but increased by substitution of serine at this site. Hill coefficients of the glutamate concentration–response curves for activation of peak current did not differ significantly from the wild-type value in any of the mutants tested. EC50 values for glutamate-activated steady-state current, however, showed more variation compared with peak current: EC50 values were significantly increased in one of the mutants and decreased in three of the mutants. In particular, the glutamate EC50 value was markedly decreased in the NR2A(F637W) mutant. Apparent desensitization was also affected by mutations at NR2A(F637). Substitutions at this site decreased the Iss:Ip in two mutants (Figure 4), with the maximal effect on apparent desensitization being produced by methionine substitution, which decreased Iss:Ip by over twofold.
Figure 3.
NR2A(F637) mutations can alter EC50 values for both peak and steady-state glutamate-activated current. Concentration–response curves for glutamate (in the presence of 50 μM glycine) activation of peak (a) and steady-state (b) current in lifted human embryonic kidney 293 cells expressing NR1/NR2A or NR1/NR2A(F637) mutant subunits. Data points are means of five to eight cells and curves shown are the least-squares fits to the equation given in Materials and methods. Bar graphs show peak (c) and steady-state (d) EC50 values for glutamate in lifted cells expressing the various NR2A(F637) mutant subunits. Asterisks indicate EC50 values that differed significantly (ANOVA and Dunnett's test; *P<0.05, **P<0.01) from the EC50 for wild-type NR1/NR2A subunits.
Figure 4.
Effect of NR2A(F637) mutations on desensitization kinetics. (a) Traces illustrating desensitization of current activated by 300 μM glutamate (in the presence of 50 μM glycine) in lifted cells expressing wild-type (WT) NR1/NR2A, NR1/NR2A(F637W) and NR1/NR2A(F637M) subunits. (b) Average values of Iss:Ip of glutamate-activated current; n=5–8 cells. Asterisks indicate values that differed significantly (ANOVA and Dunnett's test; **P<0.01) from the value for WT NR1/NR2A subunits.
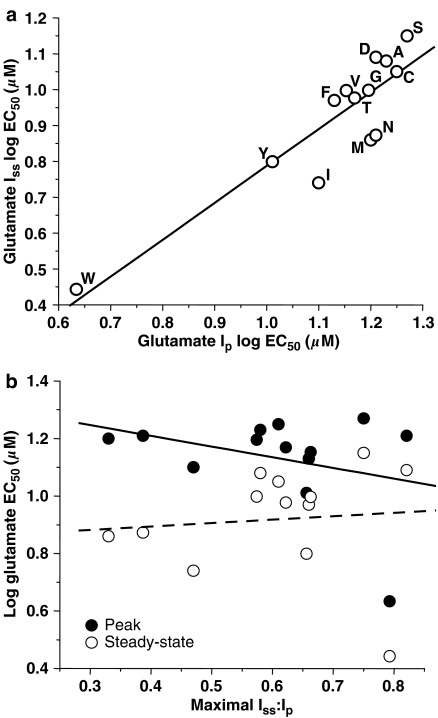
In a previous study, we demonstrated that for a series of mutants at a position in the M4 domain, changes in steady-state glutamate EC50 were attributable to changes in desensitization (Ren et al., 2003a). Analysis of the results obtained in mutants at NR2A(F637), however, revealed that the peak and steady-state glutamate EC50 values were highly correlated (Figure 5), but values of maximal Iss:Ip were not correlated either with glutamate peak or steady-state EC50 values.
Figure 5.
Relation between NMDA-receptor agonist potency and desensitization in NR2A(F637) mutant subunits. (a) Graph plots steady-state vs peak EC50 values for glutamate in the various NR2A(F637) mutant subunits. Data points are labeled with the substituted amino acid for the various mutants at NR2A(F637). The line shown is the least squares fit to the data; glutamate peak and steady-state EC50 were significantly correlated (R2=0.900, P<0.0001). (b) Graph plots steady-state and peak log EC50 values for glutamate vs the Iss:Ip of glutamate-activated current in the various NR2A(F637) mutant subunits. Maximal Iss:Ip for glutamate was not correlated with either peak glutamate log EC50 (R2=0.340, P>0.05) or steady-state glutamate log EC50 (R2=0.075, P>0.05). The lines shown are the least squares fits to the data.
Effects of mutations at NR2A(F637) on mean open time
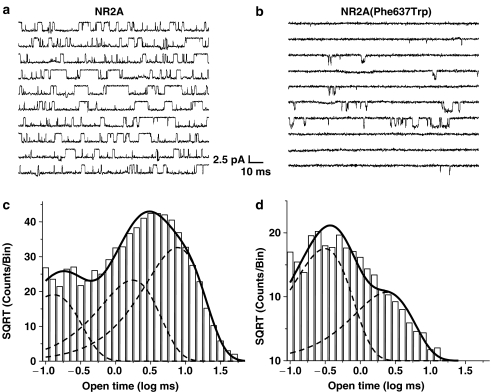
NR2A subunit mutations that alter its alcohol sensitivity may also influence measures of ion channel gating (Ren et al., 2003a; Honse et al., 2004). We thus tested effects of the various mutations at NR2A(F637) on mean open time using single-channel recording in cell-attached patches (Figure 6). Patches from cells expressing wild-type NR1 and NR2A subunits had open time distributions that could be fitted with three exponential components (Table 1). Each of the substitution mutations tested significantly decreased mean open time to values in the range 0.5–2 ms (Table 1). In contrast to the results obtained in patches from cells expressing the wild-type NR2A subunit, the open time distributions in five of the 12 mutant subunits could be adequately fitted with two exponential components. This is illustrated by the open time distribution from a patch containing NR2A(F637W) mutant subunits, as shown in Figure 6b and d.
Figure 6.
Mutations at NR2A(F637) can alter mean open time of the NMDA receptor. Traces are currents activated by glutamate, 10 μM, in the presence of 50 μM glycine and 10 μM EDTA in cell-attached patches in cells expressing wild-type NR1/NR2A (a) or NR1/NR2A(F637W) (b) subunits. The pipette potential was −50 mV; channel openings are downward. Open time histograms from cell-attached patches containing wild-type NR1/NR2A (c) or NR1/NR2A(F637W) (d) subunits. Solid curves indicate maximum likelihood multiple exponential fits to the data and dotted curves indicate the individual exponential components. Traces in (a) and (b) and corresponding distributions in (c) and (d) are from the same individual patches; similar results were obtained in two to four other patches.
Table 1.
Mean open times in NR2A(F637) mutants
| Substituent at NR2A(F637) | τ1 (ms) | τ2 (ms) | τ3 (ms) | Mean open time (ms) |
|---|---|---|---|---|
| Phe | 0.18±0.022 | 2.2±0.38 | 8.5±1.8 | 3.9±0.95 |
| Ala | 0.33±0.047 | 1.9±0.11 | — | 1.1±0.071** |
| Asn | 0.25±0.030 | 1.3±0.25 | 2.6 | 0.80±0.065** |
| Asp | 0.22±0.038 | 1.0±0.21 | — | 0.53±0.074** |
| Cys | 0.16±0.044 | 0.93±0.21 | 4.3±1.4 | 1.2±0.16** |
| Gly | 0.24±0.035 | 1.2±0.20 | 3.0±0.055 | 0.86±0.092** |
| Ile | 0.28±0.048 | 2.0±0.26 | — | 1.1±0.11** |
| Met | 0.18±0.014 | 1.4±0.16 | — | 0.75±0.11** |
| Ser | 0.16±0.033 | 1.2±0.19 | 4.3±0.64 | 1.2±0.15** |
| Thr | 0.22±0.014 | 1.3±0.17 | 3.4 | 0.79±0.039** |
| Trp | 0.41±0.074 | 3.4±0.44 | — | 1.9±0.36** |
| Tyr | 0.20±0.031 | 1.7±0.38 | 3.7±0.23 | 1.6±0.13** |
| Val | 0.17±0.023 | 1.1±0.14 | 3.4±0.035 | 0.98±0.089** |
Abbreviation: WT, wild-type.
Values are the means±s.e.m. of data obtained from three to six patches. Time constants (τ) for individual components were obtained as described in Materials and methods.
Mean open times for all of the mutant receptors were significantly different from the value obtained for WT receptors (ANOVA and Dunnett's test; **P<0.01).
Relation of agonist sensitivity, desensitization and mean open time to EtOH sensitivity in mutants at NR2A(F637)
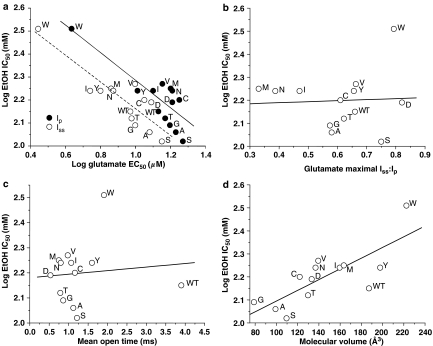
Because mutations at NR2A(F637) caused significant variation in glutamate EC50 and maximal Iss:Ip values in addition to EtOH IC50 values, it is possible that the observed changes in EtOH sensitivity among the mutants could result from changes in agonist potency or ion channel gating kinetics. Plotting EtOH IC50 values against glutamate EC50 or maximal Iss:Ip values revealed that EtOH sensitivity of the mutants was significantly correlated with both glutamate peak and steady-state EC50 values (Figure 7a). As would be expected from the observation that glutamate EC50 values were not correlated with maximal Iss:Ip values, EtOH IC50 was not correlated with maximal Iss:Ip (Figure 7b). In addition, there was no difference between EtOH inhibition of peak and steady-state current in the most highly desensitizing mutants, NR2A(F637M) and NR2A(F637N) (results not shown). Similarly, there was no correlation between EtOH IC50 values and mean open time (Figure 7c).
Figure 7.
Relation of agonist potency, ion channel gating and substituent molecular volume to EtOH sensitivity in NMDA receptors containing NR2A(F637) mutant subunits. Graphs plot log IC50 for EtOH vs log EC50 values for glutamate peak and steady-state current (a) maximal Iss:Ip for glutamate (b), mean open time (c) and substituent molecular volume in Å3 (d) for the various substituents at NR2A(F637). Data points are labeled with the substituted amino acid for the various mutants at NR2A(F637). The lines shown are the least squares fits to the data. Highly significant correlations were obtained between log EtOH IC50 and log EC50 for glutamate activation of peak (R2=0.626, P<0.001) and steady-state (R2=0.743, P<0.0001) current, but not glutamate maximal Iss:Ip (R2=0.001, P>0.05) or mean open time (R2=0.006, P>0.05). A significant linear relation was obtained between log EtOH IC50 and molecular volume (R2=0.587; P<0.005), but not hydropathy (R2=0.001, P>0.05), polarity (R2=0.003, P>0.05) or hydrophilicity (R2=0.276, P>0.05).
The observation that changing the substituent at NR2A(F637) alters EtOH sensitivity could be an indication that the EtOH molecule is physically interacting with this site in some manner. If there is such an interaction, then this should be evident by the presence of a significant linear relation for the series of mutants between the EtOH IC50 value and at least one physicochemical measure of the amino-acid substituent at this position. To evaluate this possibility, we performed linear regression analysis of the EtOH log IC50 vs hydropathy, hydrophilicity, polarity (results not shown) and molecular volume of the substituent (Figure 7d). EtOH sensitivity was not linearly related to hydropathy, polarity or hydrophilicity, but was significantly linearly related to molecular volume of the amino acid at NR2A(F637).
Discussion
The results of this study have shown that NR2A(F637), the cognate position of the alcohol-sensitive site NR1(F639), regulates EtOH sensitivity, glutamate potency, desensitization and mean open time. We have shown previously that in a region of the NR2A M4 domain, there is considerable overlap between residues influencing alcohol sensitivity and those regulating ion channel gating (Ren et al., 2003a, 2003b; Honse et al., 2004). In mutants at M823 in this region, changes in steady-state glutamate potency were attributable to altered desensitization resulting in a greater or lesser degree of trapping of the agonist bound to the receptor in the desensitized state (Ren et al., 2003a). In the present study, however, there was a significant effect of mutations at F637 on peak and steady-state glutamate EC50, but steady-state glutamate EC50 was not correlated with maximal Iss:Ip, indicating that this site is able to influence agonist potency in a manner that is independent of changes in desensitization. The mechanism for this is unclear at present, but could possibly involve a subtle conformational change at the level of F637 that results in long-range modulation of the S2 agonist-binding domain. Smothers and Woodward (2006) similarly demonstrated that mutations at NR1(F639) could change glycine peak EC50 values, but it is not known whether these values are related to desensitization, as these investigators did not report values of glycine steady-state EC50 or maximal Iss:Ip.
In a previous study, we found that mutations at NR2A(M823) in M4 could dramatically increase or decrease mean open time (Ren et al., 2003a) in a manner that was related to the hydrophobicity of the substituent. In the present study, we found that mean open time was also altered by mutations at NR2A(F637), but in all cases it was significantly decreased compared with the wild-type value. This decrease was primarily attributable to the relative absence or lower proportion of the longest component of openings. It should be noted that the intermediate component of open time in the wild-type NR1/NR2A receptor has been shown to be attributable to block by low levels of contaminating Mg2+ (Popescu and Auerbach, 2003; Schorge et al., 2005). Although solutions in the present study contained 10 μM EDTA and were prepared using ultrapure salts, much higher chelator concentrations are required to reduce Mg2+ concentration sufficiently to completely remove the block (Popescu and Auerbach, 2003). Thus, the intermediate open time in the present study most probably represents a fraction of the longer openings that were shortened by Mg2+ block. Nevertheless, the mean open time of 3.9 ms that we observed in wild-type NR1/NR2A subunits is within the range of mean open time values from recent studies of native and recombinant receptors in which this component was absent or present (2.8–4.1 ms) (Rycroft and Gibb, 2004; Schorge et al., 2005; Yuan et al., 2005), and the presence of this intermediate component does not alter the conclusion that the mutations at F637 shortened the longest open time component. We observed similar values for open time in wild-type and mutant receptors in outside-out patches in the presence of a high concentration of EDTA (results not shown). Thus mutations at F637 decreased the lifetime of the longest open state and the wild-type phenylalanine residue at this site appears to interact optimally with one or more adjacent residues to slow the ion channel-closing rate from this state. There was little variation in mean open time among the mutants excluding tryptophan; the average of these open times was 0.99±0.088 ms. Although mean open time was not dependent on the molecular volume of the substituent at F637, the observation that the mean open times for the tryptophan and tyrosine mutants were somewhat higher (1.9 and 1.6 ms, respectively) may indicate that the bulky side chains of these amino acids are able to interact at least partially with the residues adjacent to this position that regulate the ion channel-closing rate.
An alanine mutation at NR1(F639) was shown to decrease EtOH sensitivity (Ronald et al., 2001) and a positive linear relation has subsequently been demonstrated between the molecular volume of the substituent at NR1(639) and the inhibition by EtOH (Smothers and Woodward, 2006). In the present study, however, we observed a significant negative linear relation between EtOH IC50 values and molecular volume at NR2A(637) for a series of substitution mutants. Thus, despite the high degree of conservation in this region between the NR1 and NR2A subunits, identical substitution mutations produced opposite effects. A possible explanation for this difference may be that this region in the NR2C subunit has been reported to be shifted about four amino acids more externally relative to the NR1 subunit (Sobolevsky et al., 2002), so that this residue in each subunit type may interact with different regions of adjacent domains. However, whether this displacement occurs in the NR2A subunit has not been reported.
We previously observed that EtOH inhibition of a series of NMDA-receptor mutants at NR2A(M823) was inversely related to desensitization (Ren et al., 2003b) and other investigators have demonstrated that EtOH inhibits α-amino-3-hydroxy-5-methylisoxazole-4-propionic acid receptors by stabilizing desensitization (Moykkynen et al., 2003). In the present study, there was no correlation between EtOH IC50 values and desensitization and there was no difference in EtOH inhibition of peak vs steady-state current in the most highly desensitizing mutants, but there were negative correlations between EtOH IC50 and glutamate potency, such that mutants that were activated by lower concentrations of glutamate were less sensitive to EtOH. We consider it improbable that glutamate potency per se influences EtOH sensitivity in this series of mutants, as it is now well established that the action of EtOH is independent of glutamate concentration (Peoples, 2003). It is more probable that the same factors that influence EtOH sensitivity in this series of mutants also affect glutamate potency perhaps by the same, or a very similar, mechanism. It is also possible that mutations that influence mean open time could alter EtOH sensitivity, as EtOH is known to inhibit NMDA receptors by a mechanism that involves a decrease in mean open time (Lima-Landman and Albuquerque, 1989; Wright et al., 1996). In the present study, however, there was no such correlation between mean open time and EtOH sensitivity. As discussed above, mean open time was significantly decreased by all of the mutations at F637, whereas EtOH IC50 values could be either increased or decreased depending on the substituent. Thus, the changes in EtOH IC50 values observed in this study do not appear to be secondary to changes in glutamate potency or measures of ion channel gating.
A number of studies on GABAA and glycine-receptor ion channels have reported that the molecular volume of alcohol or anesthetic target sites influences the modulation of the ion channel by alcohols or anesthetics (Wick et al., 1998; Ye et al., 1998; Koltchine et al., 1999; Yamakura et al., 1999; Kash et al., 2003). Similarly, the ability of alcohols or anesthetics to modulate the activity of these receptors may also depend on the molecular volume of the anesthetics (Wick et al., 1998; Jenkins et al., 2001; Krasowski et al., 2001; Kash et al., 2003). Such observations are consistent with the view that EtOH and similar molecules modify receptor function by occupying a critical volume within the site (Wick et al., 1998). In the present study, we observed that increases in molecular volume of the substituent at NR2A(F637) decreased the potency of EtOH for inhibition of the ion channel. This observation is difficult to reconcile with a model in which EtOH binds to the amino-acid side chain at this position and inhibits receptor function by occupation of a critical volume, especially in light of our observation that although EtOH acts by decreasing mean open time (Lima-Landman and Albuquerque, 1989; Wright et al., 1996), mean open time and side-chain molecular volume were not related in the series of mutants (R2=0.284, P>0.05; results not shown). The inverse relation between EtOH potency and molecular volume at this site may instead indicate that this site either presents a barrier to the access of EtOH to a nearby site of action or that the amino-acid side chain at this site interacts with an adjacent site of EtOH action in a manner that hinders the effect of EtOH. Thus, decreases in molecular volume at NR2A(F637) could either increase the access of EtOH to a site of action or ease a steric hindrance tending to act against the inhibitory effect of EtOH. Further studies will be required to distinguish between these possibilities.
Acknowledgments
We thank Xiang-Qun Hu, David Wagner and Michelle Mynlieff for helpful discussions. This study was supported by grants from the Alcoholic Beverage Medical Research Foundation (RWP) and the National Institutes of Health (AA015203-01A1, RWP).
Abbreviations
- ANOVA
analysis of variance
- EtOH
ethanol
- Iss:Ip
steady-state to peak current ratio
- M
membrane-associated domain
- NMDA
N-methyl-D-aspartate
Conflict of interest
The authors state no conflict of interest.
References
- Anson LC, Chen PE, Wyllie DA, Colquhoun D, Schoepfer R. Identification of amino acid residues of the NR2A subunit that control glutamate potency in recombinant NR1/NR2A NMDA receptors. J Neurosci. 1998;18:581–589. doi: 10.1523/JNEUROSCI.18-02-00581.1998. [DOI] [PMC free article] [PubMed] [Google Scholar]
- Honse Y, Ren H, Lipsky RH, Peoples RW. Sites in the fourth membrane-associated domain regulate alcohol sensitivity of the NMDA receptor. Neuropharmacology. 2004;46:647–654. doi: 10.1016/j.neuropharm.2003.11.006. [DOI] [PubMed] [Google Scholar]
- Jenkins A, Greenblatt EP, Faulkner HJ, Bertaccini E, Light A, Lin A, et al. Evidence for a common binding cavity for three general anesthetics within the GABAA receptor J Neurosci 2001211–4.RC136 [DOI] [PMC free article] [PubMed] [Google Scholar]
- Kash TL, Jenkins A, Harrison NL. Molecular volume determines the activity of the halogenated alkane bromoform at wild-type and mutant GABA(A) receptors. Brain Res. 2003;960:36–41. doi: 10.1016/s0006-8993(02)03748-4. [DOI] [PubMed] [Google Scholar]
- Koltchine VV, Finn SE, Jenkins A, Nikolaeva N, Lin A, Harrison NL. Agonist gating and isoflurane potentiation in the human γ-aminobutyric acid type A receptor determined by the volume of a second transmembrane domain residue. Mol Pharmacol. 1999;56:1087–1093. doi: 10.1124/mol.56.5.1087. [DOI] [PubMed] [Google Scholar]
- Krasowski MD, Nishikawa K, Nikolaeva N, Lin A, Harrison NL. Methionine 286 in transmembrane domain 3 of the GABAA receptor β subunit controls a binding cavity for propofol and other alkylphenol general anesthetics. Neuropharmacol. 2001;41:952–964. doi: 10.1016/s0028-3908(01)00141-1. [DOI] [PMC free article] [PubMed] [Google Scholar]
- Kuryatov A, Laube B, Betz H, Kuhse J. Mutational analysis of the glycine-binding site of the NMDA receptor: Structural similarity with bacterial amino acid- binding proteins. Neuron. 1994;12:1291–1300. doi: 10.1016/0896-6273(94)90445-6. [DOI] [PubMed] [Google Scholar]
- Laube B, Hirai H, Sturgess M, Betz H, Kuhse J. Molecular determinants of agonist discrimination by NMDA receptor subunits: Analysis of the glutamate-binding site on the NR2B subunit. Neuron. 1997;18:493–503. doi: 10.1016/s0896-6273(00)81249-0. [DOI] [PubMed] [Google Scholar]
- Lima-Landman MTR, Albuquerque EX. Ethanol potentiates and blocks NMDA-activated single-channel currents in rat hippocampal pyramidal cells. FEBS Lett. 1989;247:61–67. doi: 10.1016/0014-5793(89)81241-4. [DOI] [PubMed] [Google Scholar]
- Lynch DR, Anegawa NJ, Verdoorn T, Pritchett DB. N-methyl-D-aspartate receptors: different subunit requirements for binding of glutamate antagonists, glycine antagonists, and channel-blocking agents. Mol Pharmacol. 1994;45:540–545. [PubMed] [Google Scholar]
- Moykkynen T, Korpi ER, Lovinger DM. Ethanol inhibits alpha-amino-3-hydyroxy-5-methyl-4-isoxazolepropionic acid (AMPA) receptor function in central nervous system neurons by stabilizing desensitization. J Pharmacol Exp Ther. 2003;306:546–555. doi: 10.1124/jpet.103.050666. [DOI] [PubMed] [Google Scholar]
- Peoples RW.Alcohol actions on glutamate receptors Glutamate and Addictioned 2003Humana Press: Totowam, NJ; 343–356.Herman BH, Frankenheim J, Litten RZ, Sheridan PH, Weight FF, Zukin, SR (eds) [Google Scholar]
- Peoples RW, Li C, Weight FF. Lipid vs protein theories of alcohol action in the nervous system. Annu Rev Pharmacol Toxicol. 1996;36:185–201. doi: 10.1146/annurev.pa.36.040196.001153. [DOI] [PubMed] [Google Scholar]
- Popescu G, Auerbach A. Modal gating of NMDA receptors and the shape of their synaptic response. Nat Neurosci. 2003;6:476–483. doi: 10.1038/nn1044. [DOI] [PubMed] [Google Scholar]
- Qin F. Restoration of single-channel currents using the segmental k-means method based on hidden Markov modeling. Biophys J. 2004;86:1488–1501. doi: 10.1016/S0006-3495(04)74217-4. [DOI] [PMC free article] [PubMed] [Google Scholar]
- Ren H, Honse Y, Karp BJ, Lipsky RH, Peoples RW. A site in the fourth membrane-associated domain of the N-methyl-D-aspartate receptor regulates desensitization and ion channel gating. J Biol Chem. 2003a;278:276–283. doi: 10.1074/jbc.M209486200. [DOI] [PubMed] [Google Scholar]
- Ren H, Honse Y, Peoples RW. A site of alcohol action in the fourth membrane-associated domain of the NMDA receptor. J Biol Chem. 2003b;278:48815–48820. doi: 10.1074/jbc.M302097200. [DOI] [PubMed] [Google Scholar]
- Ronald KM, Mirshahi T, Woodward JJ. Ethanol inhibition of N-methyl-D-aspartate receptors is reduced by site-directed mutagenesis of a transmembrane domain phenylalanine residue. J Biol Chem. 2001;276:44729–44735. doi: 10.1074/jbc.M102800200. [DOI] [PubMed] [Google Scholar]
- Rycroft BK, Gibb AJ. Regulation of single NMDA receptor channel activity by alpha-actinin and calmodulin in rat hippocampal granule cells. J Physiol. 2004;557:795–808. doi: 10.1113/jphysiol.2003.059212. [DOI] [PMC free article] [PubMed] [Google Scholar]
- Schorge S, Elenes S, Colquhoun D. Maximum likelihood fitting of single channel NMDA activity with a mechanism composed of independent dimers of subunits. J Physiol. 2005;569:395–418. doi: 10.1113/jphysiol.2005.095349. [DOI] [PMC free article] [PubMed] [Google Scholar]
- Smothers CT, Woodward JJ. Effects of amino acid substitutions in transmembrane domains of the NR1 subunit on the ethanol inhibition of recombinant N-methyl-D-aspartate receptors. Alcohol Clin Exp Res. 2006;30:523–530. doi: 10.1111/j.1530-0277.2006.00058.x. [DOI] [PubMed] [Google Scholar]
- Sobolevsky AI, Rooney L, Wollmuth LP. Staggering of subunits in NMDAR channels. Biophys J. 2002;83:3304–3314. doi: 10.1016/S0006-3495(02)75331-9. [DOI] [PMC free article] [PubMed] [Google Scholar]
- Wick MJ, Mihic SJ, Ueno S, Mascia MP, Trudell JR, Brozowski SJ, et al. Mutations of γ-aminobutyric acid and glycine receptors change alcohol cutoff: Evidence for an alcohol receptor. Proc Natl Acad Sci USA. 1998;95:6504–6509. doi: 10.1073/pnas.95.11.6504. [DOI] [PMC free article] [PubMed] [Google Scholar]
- Wright JM, Peoples RW, Weight FF. Single-channel and whole-cell analysis of ethanol inhibition of NMDA-activated currents in cultured mouse cortical and hippocampal neurons. Brain Res. 1996;738:249–256. doi: 10.1016/s0006-8993(96)00780-9. [DOI] [PubMed] [Google Scholar]
- Yamakura T, Mihic SJ, Harris RA. Amino acid volume and hydropathy of a transmembrane site determine glycine and anesthetic sensitivity of glycine receptors. J Biol Chem. 1999;274:23006–23012. doi: 10.1074/jbc.274.33.23006. [DOI] [PubMed] [Google Scholar]
- Ye Q, Koltchine VV, Mihic SJ, Mascia MP, Wick MJ, Finn SE, et al. Enhancement of glycine receptor function by ethanol is inversely correlated with molecular volume at position α267. J Biol Chem. 1998;273:3314–3319. doi: 10.1074/jbc.273.6.3314. [DOI] [PubMed] [Google Scholar]
- Yuan H, Erreger K, Dravid SM, Traynelis SF. Conserved structural and functional control of N-methyl-D-aspartate receptor gating by transmembrane domain M3. J Biol Chem. 2005;280:29708–29716. doi: 10.1074/jbc.M414215200. [DOI] [PubMed] [Google Scholar]
- Zilberter Y, Uteshev V, Sokolova S, Khodorov B. Desensitization of N-methyl-D-aspartate receptors in neurons dissociated from adult rat hippocampus. Mol Pharmacol. 1991;40:337–341. [PubMed] [Google Scholar]


