Abstract
Aims
To estimate the frequency of adverse drug reactions (ADRs) identified through the use of automatic signals generated from laboratory data (ALS) in hospitalised patients. To determine the frequency of spontaneous recognition of these ADRs by the attending physicians and to assess the potential value of ALS for detection of ADRs.
Methods
Laboratory results of patients hospitalised in a nine bed medical ward were automatically recorded over a period of 17 months. Values exceeding defined boundaries were used as ALS. Charts of every third patient were analysed retrospectively with regard to adverse drug related reactions and causality was evaluated as well as whether the ADR had been recognised during the period of hospitalisation.
Results
The charts and ALS of 98 patients were analysed. In 18 cases a drug-related adverse reaction was probable. Awareness to the reaction by the treating physicians was evident in 6 out of these 18 ADRs. Approximately 80% of the ADRs were considered predictable. Three ADRs were regarded as serious.
Conclusions
Adverse drug reactions are common and often preventable. Only one third of ADRs which could have been detected through ALS were recognised by the attending physicians. An increased doctor’s awareness of the frequency of drug related abnormal laboratory results by means of ALS is likely to increase the recognition rate of ADRs and might help to prevent them.
Keywords: adverse drug reactions, automated laboratory signals
Introduction
Morbidity due to drugs is common in hospitalised patients although the rate is controversial and varies between 0.7% and 35%, depending on the methods used [1–8]. In a recent meta-analysis of prospective studies the overall frequency of serious ADRs was 6.7% and that of fatal ADRs 0.32% of hospitalised patients [9]. Approximately 2–6% of all hospital admissions per year are caused by ADRs [10–12]. ADRs can prolong hospital stays and substantially add to health care expenditure [13–15]. Thus, health care organisations must maintain ADR surveillance and prevention. At present, most hospitals rely on spontaneous, voluntary reporting of ADRs by nurses and physicians, however, such systems provide limited information [16]. Moreover, physicians may not recognise ADRs even if the appropriate information is in the patient’s medical record [17, 18]. The diagnosis of ADRs, especially those that are not dose-related, is often difficult and agreement in clinical judgements is low (about 50%) both within and between physicians making diagnoses [19, 20]. As a result of this difficulty various diagnostic aids in the form of standardised definitions and algorithms have been proposed. An algorithm is a standardised set of questions with predetermined weightings for each answer which are combined to give a final assessment of the strength of the drug-event association. Two of the more popular algorithms are the adverse reactions probability scale (APS) with 10 questions [19] and the Yale algorithm with more than 50 questions [21]. These decision aids, however, do not alert physicians of potential ADRs and are useful only when an ADR has already been suspected. A recently advocated way of enhancing the awareness and early recognition of ADRs by physicians is the use of abnormal signals available through computerised hospital information systems [15, 17, 22]. This approach has been used to develop and test the system of abnormal automatic laboratory signals (ALS) for detection of ADRs in a hospital setting in Israel with a low level of computerisation [12]. This level included only demographic data and laboratory tests. In that study it was shown that 73% of ADRs detected through ALS were not recognised by physicians. In the present study we have used ALS for retrospective detection of ADRs and to determine the nature and rate of ADR recognition by physicians in a University hospital ward in Germany.
Methods
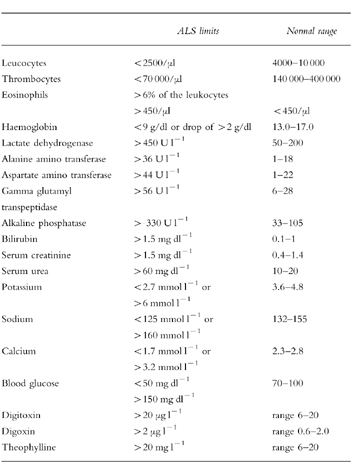
The study included patients admitted to a nine bed medical ward at the University of Erlangen between January, 1996 to May, 1997. The ward primarily admits patients with infectious, gastrointestinal and liver diseases and patients with suspected sleep apnoea syndrome. The laboratory signals of each patient were retrieved using a computer programme and were arranged in groups defining adverse events concerning the liver (alanine amino transferase, ALT; aspartate amino transferase, AST; gamma glutamyl transpeptidase, γGT; lactate dehydrogenase, LDH; alkaline phosphatase, AP; bilirubin), blood (haemoglobin, thrombocytes, leukocytes), kidney (urea, serum creatinine), electrolytes (K+, Na+, Ca2+), blood glucose or drug levels beyond the therapeutic window (digoxin, digitoxin, theophylline). For each, test levels exceeding defined upper and/or lower limits (see appendix 1) were used as automatic laboratory signals (ALS). The medical charts of every third patient were retrospectively analysed with regard to the following questions:
(1) whether the laboratory signals could have been related to an adverse drug event, and
(2) whether these ADRs were noted by the attending physicians.
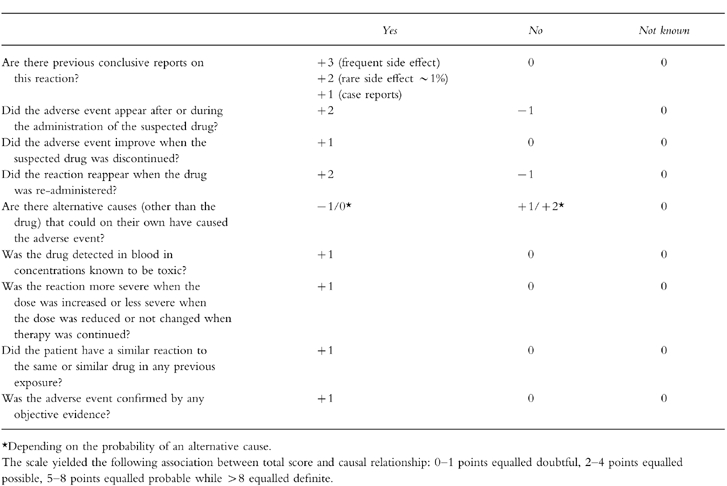
Information about the medical and medication history of the patients was obtained from the medical charts. The probability of a drug related adverse reaction (ADR) was assessed by means of the adverse reactions probability scale (APS) of Naranjo et al. [19] with some minor modifications (see appendix 2) that were necessary because certain information was not available retrospectively. The algorithm used consisted of ten weighted questions that yielded the following association between total score and causal relationship: 0–1 points equalled doubtful, 2–4 points equalled possible, 5–8 points equalled probable while >8 equalled definite.
The responses of physicians to confirmed ADRs were categorised as: no action, a note in the chart, dose reduction, discontinuation of the drug, new drug, laboratory investigation ordered, other diagnostic measure and any other action. An ADR was considered to have been recognised by the physician if the relevant actions were noted within the 3 days following the laboratory signal. As it could not be decided whether a laboratory investigation had been ordered routinely or because of a suspected ADR it was regarded as indicative of a positive response.
Once causality was assigned, the ADRs were characterised by severity as mild (self-limited) moderate (requiring treatment) or serious (potentially life-threatening or disabling). ADRs were further classified by mechanism as type A or type B reactions. Type A reactions are related to a drug’s pharmacological characteristics and are usually dose-dependent and often predictable and preventable. ADRs classified as type B are idiosyncratic or allergic in nature and are rarely predictable or avoidable [23, 24].
All signals were evaluated by three physicians experienced in clinical pharmacology for their severity and likelihood of being an ADR and whether or not they were recognised as such by the staff physicians during hospitalisation. The cases were discussed with a senior physician if the decision was difficult. For evaluation of the reliability of the rating scale the difference between the highest and lowest score obtained by the three analysing physicians was calculated for each event. The mean of these differences was used as a measure for the inter-observer variability.
The study was approved by the institutional Ethics Review Board.
Results
In a total of 294 patients hospitalised between January 1996 to May 1997, 766 laboratory signals were generated. Two hundred and twenty-nine signals generated in 98 patients (19 females, 79 males, age 25–91 years, mean 52 years) were further examined. Seven signals from three patients had to be excluded due to incomplete medication histories. Some laboratory signals such as simultaneously elevated AST and ALT were summarised to one event. Therefore, the signals amounted to 121 events concerning the liver, blood, kidney, electrolytes, blood glucose or drug levels. Out of these 121 events 66 were obviously explained by the primary diagnosis or an underlying disease. These 66 events which had caused 140 ALS are shown in Table 1. The three analysing physicians were in agreement that these events were highly unlikely to have been caused by a drug, so that these events were not further evaluated. The remaining 55 events (82 ALS) which had occurred in a total of 45 patients were further analysed with regard to a possible causative drug aetiology. Results are shown in Table 2.
Table 1.
Number of ALS among those patients in whom the laboratory signal was clearly attributable to the primary diagnosis or an underlying disease. ALS of these patients were not further analysed, because an ADR was unlikely.
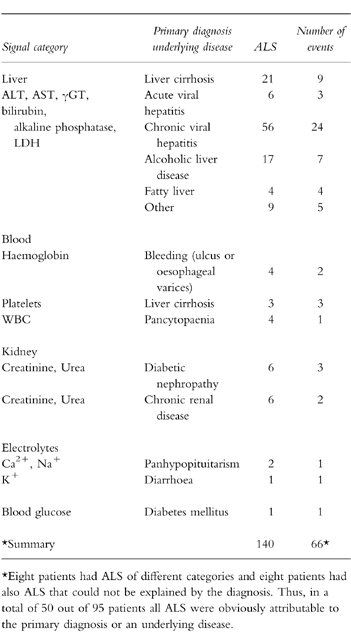
Table 2.
Number of ALS and number of ADRs (in brackets) among those patients in whom the laboratory signal could not be explained by the primary diagnosis or an underlying disease. The probability of an ADR was evaluated with the adverse reactions probability scale (APS).
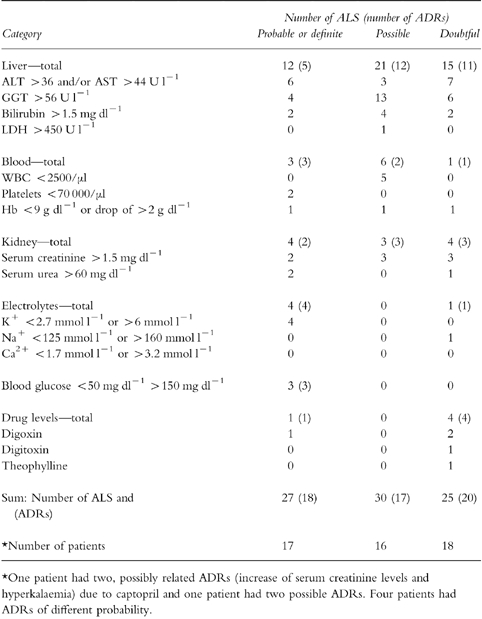
In 20 cases a causative role of drugs was unlikely. Drugs were considered to be a possible cause for 17 adverse events and 18 adverse events were definitely or probably caused by drugs. These 18 adverse drug reactions (ADRs) occurred in 17 out of 95 analysed patients (17.9%, 95% confidence interval 10.2 to 18.8%). They were identified as such by all three analysing physicians. Using the modified APS the mean difference between highest and lowest probability scores between observers was 0.9 points where a maximum of 14 points can be reached.
The clinical pharmacologists analysing the charts concurrently evaluated one of the ADRs as mild, 14 moderate and three serious. The latter three ADRs were 1) thrombocytopaenia, probably due to low molecular weight heparin, 2) a combination of thrombocytopaenia, elevated liver function tests, vasculitis and reduced renal function probably due to an allergic reaction to glibenclamide and 3) a dramatic reduction of renal function probably caused by meso-tetrahydroxyphenylchlorine (photodynamic therapy) in a patient with pre-existing diabetic nephropathy.
Fifteen out of the 18 ADRs were regarded as dose-related or predictable (type A) and 3 were non-predictable (type B). Two out of the three type B reactions were regarded as serious (thrombocytopaenia due to low molecular weight heparin and the combination of thrombocytopaenia, elevated liver function tests, vasculitis and reduced renal function probably due to glibenclamide). One type B reaction was a case of elevated liver function tests and bilirubin probably due to a drug hepatitis caused by glibenclamide.
Patients who experienced an ADR were older (mean age 62 years) and had more drug exposures (mean 5.8 different drugs per day) than patients without ADRs (mean age 50 years, 3.2 drugs per day).
The drugs associated with possible or probable ADRs were mainly cardiovascular agents (6 cases) and agents used for metabolic (diabetes, elevated serum cholesterol or uric acid) and electrolyte disorders (7 cases). Other responsible drugs were an antibiotic, diuretic, anticonvulsant, anticoagulant and a drug used for photodynamic therapy (1 case each).
Reaction of physicians
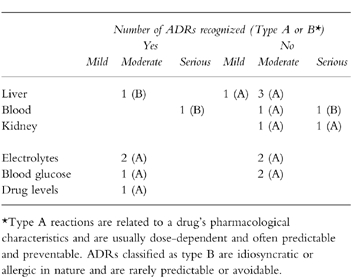
In 12 out of the 18 ADRs (66%) no reaction by physicians was noticed (Table 3). The suspected responsible drug was discontinued in three patients, an additional drug was ordered once and a laboratory investigation was performed twice. The ADRs recognised were thrombocytopaenia due to low molecular weight heparin (drug discontinued), hyperkalaemia due to potassium-chloride (drug discontinued), hypokalaemia due to frusemide (additional drug), hypoglycaemia due to insulin (laboratory control), elevated digoxin levels due to an interaction with nifedipine (digoxin discontinued) and hepatitis probably caused by glibenclamide (laboratory control). Only one of the ADRs regarded as serious (thrombocytopaenia due to low molecular heparin) was recognized and the drug discontinued. The physicians were aware of the clinical manifestations of one of the other serious ADRs (combination of thrombocytopaenia, elevated liver function tests, vasculitis and reduced renal function) but they did not suspect drug-induced aetiology.
Table 3.
Number of recognised ADRs per category and severity.
Discussion
The main finding of this retrospective study was that 17 out of 95 (18%) hospitalised patients experienced probable or definite ADRs that could have been detected by an abnormal laboratory test. However, only about one-third were detected and treated by physicians.
We have chosen a retrospective analysis in order to register the spontaneous ADR recognition rate which will be used as a basis for future evaluation of the efficacy of surveillance systems. By using a retrospective analysis it was ensured that the attending physicians were not influenced. On the other hand, the retrospective analysis has the disadvantage that some information that might have been important for the probability evaluation was not available retrospectively enhancing the potential for misclassification of an event. Especially the number of possible ADRs might have been overestimated.
We have used medical charts of the patients as information source. Three patients had to be excluded because information concerning the medication history was missing. Sufficient data were obtained for the other patients. However, it cannot be ruled out that some information provided by doctors’ or nurses’ notes might have been incomplete or even incorrect. In addition, patients might not have taken their prescribed drugs. This might have led to certain biases in the evaluation of a potential drug related adverse event.
The probability of an ADR was evaluated by application of the adverse reactions probability scale (APS) according to Naranjo et al. [19]. In the past decade Naranjo et al. [25, 26] have developed a more sophisticated algorithm (BARDI) based on a Bayesian approach, that concentrates on unexpected and rare ADRs where a diagnosis is often difficult. Since most ADRs in our patients were dose related and obvious such as hypokalaemia due to frusemide the easier and less time consuming APS was considered to be appropriate. Using the modified APS (appendix 2) the agreement between three analysing physicians was acceptable with a mean difference between highest and lowest scores between observers of 0.9 points.
Despite the disadvantages of the retrospective study discussed above our results are comparable with those of other authors. In the Medical Practice Study (MPS) 0.7 ADRs per 100 admissions were identified [1] and Classen et al. found a rate of 2 ADRs per 100 admissions [17]. These studies used more restrictive definitions of ADRs. The MPS required that the event either prolonged hospital stay or resulted in disability at discharge. Restricting our analysis to serious reactions would result in a rate of 3%, similar to that found by Classen et al. In the study of Classen et al. [17] analgesics and narcotics represented 31% of all ADRs, while antibiotics were found to be the cause of approximately 24% followed by cardiovascular agents and anticoagulants with 19% and 9%, respectively. Lesar et al. [27] have reported that antimicrobials, cardiovascular agents, gastrointestinal agents and narcotics are the most common medication classes involved in treatment errors. The small size of the present sample, the specific disease profile as well as drug usage patterns and the restriction of ADRs to those potentially detected through ALS could explain the difference between our results concerning drug distribution and those of other groups.
Patients experiencing ADRs in this study tended to be older, have longer periods of hospitalisation and have more drug exposures than those not experiencing ADRs. Several studies have observed that the elderly are at a greater risk of developing ADRs because of age-related alterations in drug pharmacokinetics, comorbidities and particularly because of multiple drug use [28–32].
83% of ADRs in our patients were classified as type A and most of them were considered to be predictable and preventable. Rawlins et al. [23] have reported that type A reactions produce 70–80% of all ADRs and Classen et al. found that as many as 90% of all ADRs could be classified as such [17].
In comparison with a recent study of our group in Israel, the patients in the present study were somewhat younger and tended to have more gastrointestinal diseases and sleep apnoea syndrome while in the Jerusalem sample the main primary diagnoses were exacerbation of cardiovascular or chronic pulmonary diseases. There were also some differences in the definition of ALS, i.e. lower boundaries for liver impairment were used in Germany. Nevertheless, the rate of ADRs identified through ALS was similar in both centres (16–18%) [12]. In Jerusalem the non-predictable ADRs were more common (38%vs 17%) and the rate of severe ADRs was higher (23%vs 17% in Jerusalem and Erlangen, respectively). The rate of unrecognised (by physicians) ADRs identified by ALS was high in both centres (73% in Jerusalem vs 66% in Erlangen). The similarity between the results of the present study and those of the group in Israel suggests that the application of the ALS system is not limited to a situation in a specific centre and does not depend on the main diagnoses of the patients. Thus, it could serve as detection support tool in different hospital settings. However, it is not yet known if it is also applicable to patients of specialised clinics such as psychiatry or dermatology. This has to be confirmed in further studies.
The ALS system used prospectively as part of a specially developed computer programme presents abnormal laboratory results to the physician together with some questions concerning the probability of a drug related reaction. ALS confirmed as possibly drug related are then evaluated by the clinical pharmacologist and the result is sent back to the physician along with some additional information or recommendations. In Jerusalem we have shown that the prospective application of the ALS system in the wards routine has drastically improved the ADR recognition rate by physicians [33]. A prospective study in Erlangen is now in progress. In the present study 5 out of the 6 recognised ADRs were obviously drug related and easy to recognise. In less obvious situations a potential drug cause was considered only once. That means that the possibility of a drug-related alteration of blood tests was seldom taken into consideration. The ALS system appears to be advantageous over the routine provision of abnormal laboratory results and reference ranges because it draws the physician’s attention to the possibility that abnormal laboratory results may be drug-related. In addition, the physician obtains a rapid feedback from the clinical pharmacologist about the probability of an ADR plus some additional information.
In conclusion we have shown that about two thirds of ADRs that could have been detected by means of ALS were unrecognised by the attending physicians. Increased awareness among doctors of the frequency of drug-related abnormal blood tests may enhance the recognition rate of ADRs and help to prevent them.
Professor Levy has been an Alexander von Humboldt awardee at the University of Erlangen.
Appendix 1
Laboratory signals (ALS) were recorded automatically if they exceeded a defined upper or lower limit.
Appendix 2
Modified adverse reactions probability scale (APS) according to Naranjo et al. [19].
References
- 1.Brennan TA, Leape LL, Laird NM, et al. Incidence of adverse events and negligence in hospitalized patients. Results of the Harvard Medical Practice Study. N Engl J Med. 1991;324:370–376. doi: 10.1056/NEJM199102073240604. [DOI] [PubMed] [Google Scholar]
- 2.Lindquist R, Gersema LM. Understanding and preventing adverse drug events [In Process Citation] AACN Clin Issues. 1998;9:119–128. doi: 10.1097/00044067-199802000-00012. [DOI] [PubMed] [Google Scholar]
- 3.Jick H. Adverse drug reactions: the magnitude of the problem. J Allergy Clin Immunol. 1984;74:555–557. doi: 10.1016/0091-6749(84)90106-4. [DOI] [PubMed] [Google Scholar]
- 4.Mitchell AA, Goldman P, Shapiro S, Slone D. Drug utilization and reported adverse reactions in hospitalized children. Am J Epidemiol. 1979;110:196–204. doi: 10.1093/oxfordjournals.aje.a112804. [DOI] [PubMed] [Google Scholar]
- 5.Leape LL, Brennan TA, Laird N, et al. The nature of adverse events in hospitalized patients. Results of the Harvard Medical Practice Study II. N Engl J Med. 1991;324:377–384. doi: 10.1056/NEJM199102073240605. [DOI] [PubMed] [Google Scholar]
- 6.Bates DW, Cullen DJ, Laird N, et al. Incidence of adverse drug events and potential adverse drug events. Implications for prevention. ADE Prevention Study Group. JAMA. 1995;274:29–34. [PubMed] [Google Scholar]
- 7.Evans RS, Classen DC, Stevens LE, et al. Using a hospital information system to assess the effects of adverse drug events. Proc Annu Symp Comput Appl Med Care. 1993;00:161–165. [PMC free article] [PubMed] [Google Scholar]
- 8.Karch FE, Lasagna L. Adverse drug reactions. A critical review. JAMA. 1975;234:1236–1241. [PubMed] [Google Scholar]
- 9.Lazarou J, Pomeranz BH, Corey PN. Incidence of adverse drug reactions in hospitalized patients: a meta-analysis of prospective studies. JAMA. 1998;279:1200–1205. doi: 10.1001/jama.279.15.1200. [DOI] [PubMed] [Google Scholar]
- 10.Dartnell JG, Anderson RP, Chohan V, et al. Hospitalisation for adverse events related to drug therapy: incidence, avoidability and costs. Med J Aust. 1996;164:659–662. doi: 10.5694/j.1326-5377.1996.tb122235.x. [DOI] [PubMed] [Google Scholar]
- 11.Miller RR. Hospital admissions due to adverse drug reactions. A report from the Boston Collaborative Drug Surveillance Program. Arch Intern Med. 1974;134:219–223. [PubMed] [Google Scholar]
- 12.Azaz-Livshits T, Levy M, Sadan B, Shalit M, Geisslinger G, Brune K. Computerized surveillance of adverse drug reactions in hospital: pilot study. Br J Clin Pharmacol. 1998;45:309–314. doi: 10.1046/j.1365-2125.1998.00685.x. [DOI] [PMC free article] [PubMed] [Google Scholar]
- 13.Johnson JA, Bootman JL. Drug-related morbidity and mortality. A cost-of-illness model. Arch Intern Med. 1995;155:1949–1956. [PubMed] [Google Scholar]
- 14.Bates DW, Spell N, Cullen DJ, et al. The costs of adverse drug events in hospitalized patients. Adverse Drug Events Prevention Study Group. JAMA. 1997;277:307–311. [PubMed] [Google Scholar]
- 15.Anderson JG, Jay SJ, Anderson M, Hunt TJ. Evaluating the potential effectiveness of using computerized information systems to prevent adverse drug events. Proc AMIA Annu Fall Symp. 1997:228–232. [PMC free article] [PubMed] [Google Scholar]
- 16.Strom B. Drug epidemiology and post marketing surveillance. 1. New York: Plenum Publishing Corporation; 1992. [Google Scholar]
- 17.Classen DC, Pestotnik SL, Evans RS, Burke JP. Computerized surveillance of adverse drug events in hospital patients [published erratum appears in JAMA 1992 Apr 8;267:1922] JAMA. 1991;266:2847–2851. [PubMed] [Google Scholar]
- 18.Evans RS, Pestotnik SL, Classen DC, et al. Development of a computerized adverse drug event monitor. Proc Annu Symp Comput Appl Med Care. 1991:23–27. [PMC free article] [PubMed] [Google Scholar]
- 19.Naranjo CA, Busto U, Sellers EM, et al. A method for estimating the probability of adverse drug reactions. Clin Pharmacol Ther. 1981;30:239–245. doi: 10.1038/clpt.1981.154. [DOI] [PubMed] [Google Scholar]
- 20.Koch-Weser J, Sellers EM, Zacest R. The ambiguity of adverse drug reactions. Eur J Clin Pharmacol. 1977;11:75–78. doi: 10.1007/BF00562895. [DOI] [PubMed] [Google Scholar]
- 21.Kramer MS, Leventhal JM, Hutchinson TA, Feinstein AR. An algorithm for the operational assessment of adverse drug reactions. I. Background, description, and instructions for use. JAMA. 1979;242:623–632. [PubMed] [Google Scholar]
- 22.Bates DW, AC ON, Boyle D, et al. Potential identifiability and preventability of adverse events using information systems. J Am Med Inform Assoc. 1994;1:404–411. doi: 10.1136/jamia.1994.95153428. [DOI] [PMC free article] [PubMed] [Google Scholar]
- 23.Rawlins MD. Clinical pharmacology. Adverse reactions to drugs. Br Med J. 1981;282:974–976. doi: 10.1136/bmj.282.6268.974. [DOI] [PMC free article] [PubMed] [Google Scholar]
- 24.Rieder MJ. Mechanisms of unpredictable adverse drug reactions. Drug Saf. 1994;11:196–212. doi: 10.2165/00002018-199411030-00005. [DOI] [PubMed] [Google Scholar]
- 25.Naranjo CA, Lanctot KL, Lane DA. The Bayesian differential diagnosis of neutropenia associated with antiarrhythmic agents. J Clin Pharmacol. 1990;30:1120–1127. doi: 10.1002/j.1552-4604.1990.tb01855.x. [DOI] [PubMed] [Google Scholar]
- 26.Naranjo CA, Lane D, Ho-Asjoe M, Lanctot KL. A Bayesian assessment of idiosyncratic adverse reactions to new drugs: Guillain-Barre syndrome and zimeldine. J Clin Pharmacol. 1990;30:174–180. doi: 10.1002/j.1552-4604.1990.tb03459.x. [DOI] [PubMed] [Google Scholar]
- 27.Lesar TS, Lomaestro BM, Pohl H. Medication-prescribing errors in a teaching hospital. A 9-year experience. Arch Intern Med. 1997;157:1569–1576. [PubMed] [Google Scholar]
- 28.Ouslander JG. Drug therapy in the elderly. Ann Intern Med. 1981;95:711–722. doi: 10.7326/0003-4819-95-6-711. [DOI] [PubMed] [Google Scholar]
- 29.Mannesse CK, Derkx FH, de Ridder MA, Man in ’t Veld AJ, van der Cammen TJ. Adverse drug reactions in elderly patients as contributing factor for hospital admission: cross sectional study. Br Med J. 1997;315:1057–1058. doi: 10.1136/bmj.315.7115.1057. [DOI] [PMC free article] [PubMed] [Google Scholar]
- 30.Gray SL, Sager M, Lestico MR, Jalaluddin M. Adverse drug events in hospitalized elderly. J Gerontol A Biol Sci Med Sci. 1998;53:59–63. doi: 10.1093/gerona/53a.1.m59. [DOI] [PubMed] [Google Scholar]
- 31.Walker J, Wynne H. Review: the frequency and severity of adverse drug reactions in elderly people. Age Ageing. 1994;23:255–259. doi: 10.1093/ageing/23.3.255. [DOI] [PubMed] [Google Scholar]
- 32.Stewart RB, Cooper JW. Polypharmacy in the aged. Practical solutions. Drugs Aging. 1994;4:449–461. doi: 10.2165/00002512-199404060-00002. [DOI] [PubMed] [Google Scholar]
- 33.Levy M, Azaz-Livshits T, Sadan B, Shalit M, Geisslinger G, Brune K. Computerized surveillance of adverse drug reactions in hospital: implementation. Eur J Clin Pharmacol. 1999. (in press) [DOI] [PubMed]


