

Abstract
Aims
The present study was conducted to evaluate metabolism of the enantiomers of verapamil and norverapamil using a broad range of cytochrome P450 isoforms and measure the kinetic parameters of these processes.
Methods
Cytochrome P450 cDNA-expressed cells and microsomes from a P450-expressed lymphoblastoid cell line were incubated with 40 μm concentrations of R- or S-verapamil and R- or S-norverapamil and metabolite formation measured by h.p.l.c. as an initial screening. Those isoforms exhibiting substantial activity were then studied over a range of substrate concentrations (2.5–450 μm) to estimate the kinetic parameters for metabolite formation.
Results
P450s 3A4, 3A5, 2C8 and to a minor extent 2E1 were involved in the metabolism of the enantiomers of verapamil. Estimated Km values for the production of D-617 and norverapamil by P450 s 3A4 and 3A5 were similar (range=60–127 μm) regardless of the enantiomer of verapamil studied while the Vmaxestimates were also similar (range=4–8 pmol min−1 pmol−1 P450). Only nominal production of D-620 by these isoforms was noted. Interestingly, P450 2C8 readily metabolized both S- and R-verapamil to D-617, norverapamil and PR-22 with only slightly higher Km values than noted for P450s 3A4 and 3A5. However, the Vmax estimates for P450 2C8 metabolism of S- and R-verapamil were in general greater (range=8–15 pmol min−1 pmol−1 P450) than those noted for P450 s 3A4 and 3A5 with preference noted for metabolism of the S-enantiomer. Similarly, P450 s 3A4, 3A5 and 2C8 also mediated the metabolism of the enantiomers of norverapamil with minor contributions by P450 s 2D6 and 2E1. P450s 3A4 and 3A5 readily formed the D-620 metabolite with generally a lower Km and higher Vmax for S-norverapamil than for the R-enantiomer. In contrast, P450 2C8 produced both the D-620 and PR-22 metabolites from the enantiomers of norverapamil, again with stereoselective preference seen for the S-enantiomer.
Conclusions
These results confirm that P450s 3A4, 3A5 and 2C8 play a major role in verapamil metabolism and demonstrate that norverapamil can also be further metabolized by the P450s.
Keywords: cytochrome P450, enantiomer, metabolism, norverapamil, verapamil
Introduction
Verapamil [2, 8-bis-(3, 4-dimethoxyphenyl)-6-methyl-2-isopropyl-6-azaoctanitrile] is a calcium channel blocking agent used in the treatment of various cardiovascular disorders. Verapamil undergoes extensive hepatic first pass metabolism [1]. Furthermore, it has been well established that the S-enantiomer of verapamil is stereoselectively cleared during first pass metabolism at a much faster rate than its antipode [2]. Verapamil is metabolized to two initial metabolites, norverapamil and D-617, and these two metabolites are subject to further breakdown via the cytochrome P450 system to form at least three additional metabolites (Figure 1). Previous studies have suggested the involvement of P450s 3A4 and 1A2 in the N-dealkylation (formation of D-617) and N-demethylation (formation of norverapamil) of verapamil [3]. Furthermore, it has recently been reported that enzymes of the P450 2C subfamily were involved in verapamil O-demethylation [4]. Specifically, it was reported that P450 2C9 and P450 2C18 are involved in formation of the O-demethylation products D-703 and D-702 whereas P450 2C8 selectively formed D-703 [4]. However, the enzymes involved in the subsequent metabolism of norverapamil (formation of D-620 and PR-22, also known as D-715) have not been identified. The purpose of this study was to extend the previous by identifying the enzymes involved in norverapamil metabolism.
Figure 1.
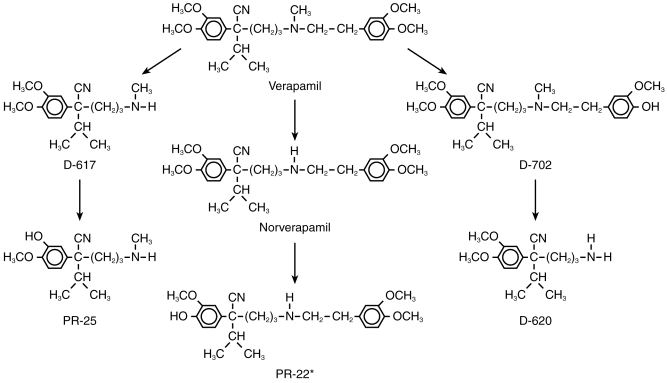
Structures of verapamil and its primary metabolites indicating the major routes of oxidative metabolism. *Also known as D-715
Methods
Expressed P450 s
Microsomal preparations from transfected human B-lymphoblastoid cell lines coding for human P450 2 A6, 2C19, and 2D6 or expressing only reductase were obtained from Gentest Co. (Woburn, MA). Vaccinia virus-expressed P450 s were obtained by infecting human HepG2 cells with a recombinant vaccinia virus containing cDNAs for P450s 1A2, 2B6, 2C8, 2C9, 2E1, 3A4 and 3A5. The details of construction of the viruses were published previously [5]. Control cells were infected only with wild type vaccinia virus. The cells were harvested 1 day after infection and stored frozen at −80° C. Prior to use, the cells were thawed at 4° C, spun to remove the supernatant, and resuspended in 50 mm K2HPO4, pH 7.4. The cells were then sonicated with two 5 s bursts and then added to the incubation mixture. P450 content was measured by the method of Omura & Sato [6].
Incubations
cDNA-expressed P450 s were incubated in the presence of 1 mm β-nicotinamide adenine dinucleotide diphosphate (β-NADP), 10 mm glucose-6-phosphate, 0.5 U glucose-6-phosphate dehydrogenase and 50 mm K2HPO4, pH 7.4 in a total volume of 500 μl. Reactions were carried out for 20 min at 37° C at a concentration of 40 μm for each of the substrates (R- or S-verapamil and R- or S-norverapamil) which were incubated separately for the isoform screening experiments. In experiments using CYP2A6, a Tris buffer 50 mm pH 7.4 replaced the phosphate buffer, because the phosphate buffer inhibits the activity of P450 2A6 in this microsomal preparation (Gentest Co., product information). Kinetic experiments for the estimation of Km and Vmax of metabolite production were conducted using concentrations of R- or S-verapamil and R- or S-norverapamil between 2.5 and 450 μm. Preliminary experiments were conducted to assure that linear reaction conditions were present.
Assay of verapamil and norverapamil metabolites
The metabolites R- and S-norverapamil, R- and S-D-617, R- and S-D-620 and R- and S-PR-22 were measured using an achiral h.p.l.c. assay. Briefly, following quenching with 200 μl acetonitrile, the samples were mixed with an equal volume of the internal standard gallopamil (0.5 μg ml−1). The sample was then centrifuged at 10 000 g for 30 min and extracted using a C18 solid phase extraction column (Wennick Scientific) conditioned with 2 ml methanol followed by 2 ml distilled water. After removal of the eluent under vacuum, the sample was eluted from the column with 2 ml methanol (containing 0.3% diethylamine) and evaporated to dryness. The samples were then reconstituted in 250 μl of 0.01n HCl prior to injection. The h.p.l.c. system consisted of a Spectra-Physics P-2000 pump, a Spectra-Physics AS-3000 autosampler, a Spectra-Physics FL-2000 fluorescence detector and a Spectra-Physics integrator. The mobile phase consisting of 0.3% diethylamine pH 4 in distilled water: acetonitrile (69:31, v/v) was pumped through the column at 1 ml min−1. A Regis 15 cm reversible ODS-II 5 μm column equipped with a C18 guard column was used for analyte separation. Correlation coefficients for this assay were r=0.99 or greater for all analytes measured. The percentage recovery varied from 65 to 95% depending on the analyte with a coefficient of variation of less than 14% in all cases. The intra- and interday assay coefficients of variation were tested at three concentrations of each analyte (15, 66.7 and 108 ng ml−1 for each metabolite and 75, 333.3 and 540 ng ml−1 for verapamil). Intra- and interday coefficients of variation were less than 10 percentage in all cases except for the 15 ng ml−1 samples of PR-22, D-617 and D-620, which were less than 18 percentage. The limit of detection for all analytes was 3 ng ml−1.
Data analysis
Estimates of Km and Vmax for the formation of the respective metabolites of the enantiomers of verapamil and norverapamil were determined. Data on the formation of each metabolite were analysed by nonlinear regression (Axum 5.0®, MathSoft, Inc.) of the substrate concentration vs velocity plots according to the Michaelis-Menten equation to generate estimates of Km and Vmax.
Results
Of the P450 s-tested, only P450 s 2C8, 3 A4 and 3 A5 participated to any appreciable extent in the metabolism of R-and S-verapamil and R-and S-norverapamil. P450 2E1 metabolized each of the substrates to a lesser degree with velocities at least 20-fold lower than those observed with the other isoforms. P450 2D6 metabolized norverapamil to PR-22 but again these rates were 20-fold lower than seen with P450 2C8.
To estimate the reaction kinetics (Km and Vmax) for each of the relevant P450s, experiments were conducted using each of the substrates (R-or S-verapamil and R-or S-norverapamil) at concentrations ranging from 2.5 to 450 μm. The kinetic profiles for the metabolism of each of the substrates by P450 3A4 are presented in Figure 2 and the kinetic parameter estimates for these reactions are presented in Table 1. It is of note that at higher concentrations of verapamil, the norverapamil formation predominated when S-verapamil was the substrate but D-617 was the predominant metabolite when R-verapamil was the substrate. The Km for these processes was similar for the two enantiomers. Only negligible amounts of D-620 were formed when verapamil was the substrate and insufficient amounts were formed from R-verapamil to permit kinetic analysis. Furthermore, only D-620 was formed from norverapamil by P450 3A4 and no appreciable enantioselectivity was observed. Interestingly the Km for P450 3A4 metabolism of R-verapamil to D-620 was four-fold higher than observed for S- verapamil and this isoform.
Figure 2.
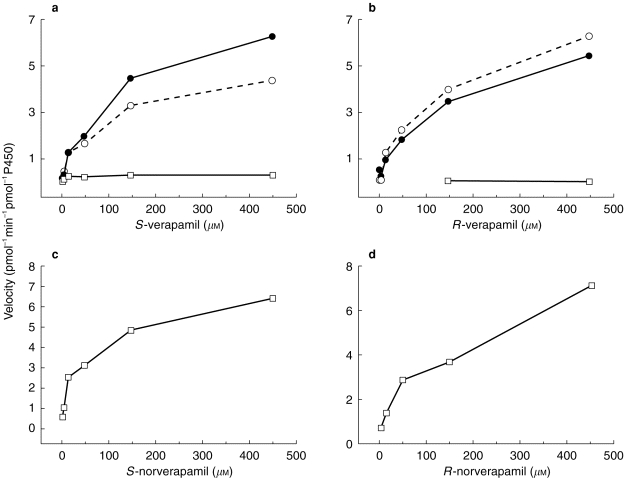
Metabolism of S-verapamil (a), R-verapamil (b), S-norverapamil (c) and R-norverapamil (d) to their respective metabolites by vaccinia-expressed cytochrome P450 3A4 containing cells. Substrate concentrations ranged from 2.5 to 450 μm. ○ D-617, • norverapamil, □ D-620.
Table 1.
Kinetic parameter estimates (±s.e. of the estimate) for the metabolism of S- and R-verapamil and S- and R-norverapamil to their respective metabolites by cytochrome P450 3A4. Each enantiomer was incubated individually at substrate concentrations ranging from 2.5 to 450 μm.

The reaction kinetics of the enantiomers of verapamil and norverapamil were also studied with the P450 3A5 isoform (Figure 3 and Table 2). P450 3A5 appeared to metabolize both S- and R-verapamil equally well, with norverapamil being the primary metabolite in both cases. The Km and Vmaxfor these processes were similar for the two enantiomers. Small amounts of D-620 formation from verapamil were noted but in both cases (R- and S-) the reaction appeared to saturate at very low concentrations of substrate and then diminish in velocity as the substrate concentration was increased. P450 3A5 also metabolized norverapamil but the only metabolite detected to any extent was D-620. Pronounced stereoselectivity was observed with S-verapamil being metabolized to D-620 by P450 3A5 at an ≈two-fold higher rate than was R-verapamil. Likewise, the Kmfor this process with S-verapamil is two-fold lower than for R- verapamil.
Figure 3.
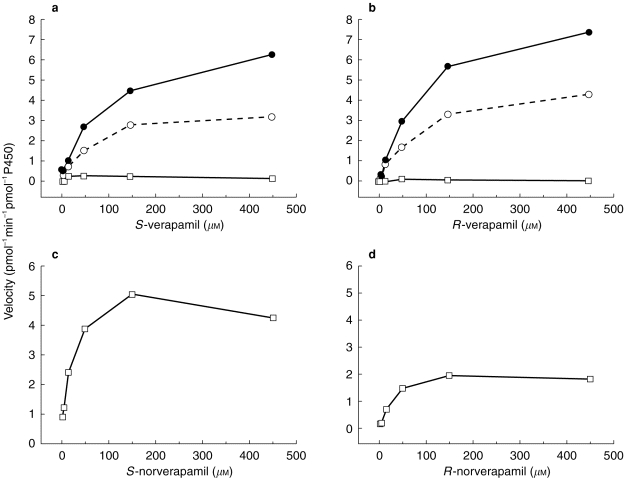
Metabolism of S-verapamil (a), R-verapamil (b), S-norverapamil (c) and R-norverapamil (d) to their respective metabolites by vaccinia-expressed cytochrome P450 3A5 containing cells. Substrate concentrations ranged from 2.5 to 450 μm. ○ D-617, • norverapamil, □ D-620.
Table 2.
Kinetic parameter estimates (±s.e. of the estimate) for the metabolism of S- and R-verapamil and S- and R-norverapamil to their respective metabolites by cytochrome P450 3A5. Each enantiomer was incubated individually at substrate concentrations ranging from 2.5 to 450 μm.

Finally, the metabolism of the enantiomers of verapamil and norverapamil was studied using P450 2C8 as the enzyme source. Results of these studies are presented in Figure 4 and Table 3. When verapamil was the substrate, norverapamil was the predominant metabolite regardless of the verapamil enantiomer used. Formation of both D-617 and PR-22 were also noted with PR-22 formation being the lowest of the three metabolites. Estimates of Km for these processes tended to be higher when S-verapamil was the substrate and for both enantiomers of verapamil, the formation of PR-22 appeared to exhibit substrate/product inhibition at higher substrate concentrations. For the PR-22 metabolite, estimates of Km and Vmax were made using the velocities from substrate concentrations up to and including 150 μm. P450 2C8 was much more active toward the metabolism of norverapamil than were either P450 3A4 or 3A5. Formation of both D-620 and PR-22 were observed from P450 2C8 incubations with norverapamil. There appears to be marked stereoselectivity in this process with S-norverapamil being predominantly metabolized to D-620 whereas R- norverapamil was metabolized primarily to PR-22. As with verapamil, formation of PR-22 from norverapamil appeared to diminish at higher than 150 μm substrate concentrations and thus kinetic parameter estimates were made using data obtained at substrate concentrations up to and including 150 μm.
Figure 4.
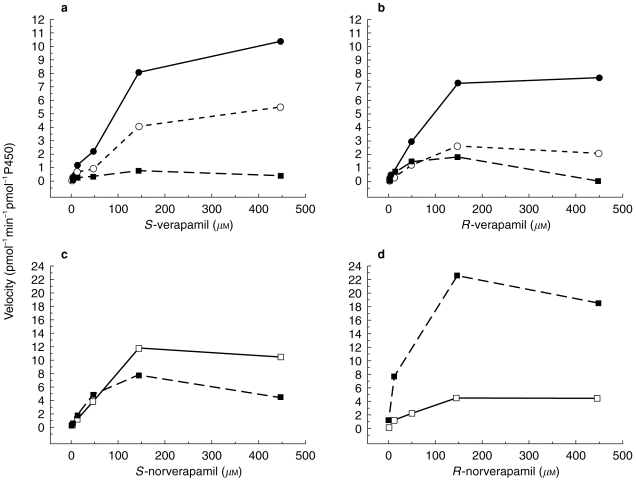
Metabolism of S-verapamil (a), R-verapamil (b), S-norverapamil (c) and R-norverapamil (d) to their respective metabolites by vaccinia-expressed cytochrome P450 2C8 containing cells. Substrate concentrations ranged from 2.5 to 450 μm. ○ D-617, • norverapamil, □ D-620, ▪ PR-22.
Table 3.
Kinetic parameter estimates (±s.e. of the estimate) for the metabolism of S- and R-verapamil and S- and R-norverapamil to their respective metabolites by cytochrome P450 2C8. Each enantiomer was incubated individually at substrate concentrations ranging from 2.5 to 450 μm.

Discussion
The metabolism of verapamil in vivo is extensive, resulting in substantial first pass metabolism. It is this first pass metabolism, particularly of the S-enantiomer, that necessitates the much lower intravenous doses of verapamil and accounts for the antiarrhythmic effect when given intravenously but not when given orally [7]. Previously, it has been suggested that P450s 3A4 and 1A2 are responsible for verapamil N-dealkylation and that the P450 2C subfamily (especially 2C8, 2C9 and 2C18) are responsible for verapamil O-dealkylation [3, 4]. However, the subsequent metabolism of norverapamil has not been studied.
Our findings of the substantial involvement of P450 3A4 in the formation of R- and S-D-617 and R- and S-norverapamil from verapamil are congruent with those reported previously [3]. Additionally, we observed that P450 3A5 participates in these verapamil metabolite formation pathways. To our knowledge this is the first formal report of P450 3A5 involvement in verapamil metabolism, though the results are not surprising given the overlapping substrate specificities of the two P450 3A isoforms. It has been reported that P450 3A5 is present in about 30% of human liver samples in quantities approximately one-fourth to one-third that observed for P450 3A4 [8]. Thus, at least with respect to liver mediated metabolism, P450 3A5 will play a role in verapamil metabolism in some individuals though probably to a lesser extent than P450 3A4. The gut also possesses P450 3A isoforms and may produce a substantial contribution to the ‘first pass’ metabolism of cyclosporin and possibly other medications [9, 10]. In the gut, P450 3A5 is expressed in ≈70% of patients in addition to P450 3A4 [11]. Thus, this isoform may play an even more significant role in intestinal metabolism of the enantiomers of verapamil. This role of gut P450 3A4 (and 3A5) in verapamil metabolism has been demonstrated by Fromm et al. [12] who studied the effect of the P450 3A inducer rifampicin on hepatic and prehepatic verapamil metabolism. In this study, coadministration of rifampicin produced little change in the systemic clearance of S-verapamil (1.3-fold increase) but caused a 32-fold increase in the oral clearance of this verapamil enantiomer. Lampen et al. [13] using in vitro techniques found that verapamil inhibited the metabolism of tacrolimus in liver and intestinal preparations with Ki values similar to the Km values observed by us. Finally, Kantola et al. [14] recently demonstrated that coadministration of verapamil with simvastatin (a P450 3A4 substrate) resulted in a 4.6-fold increase in simvastatin AUC and a 2.8-fold increase in simvastatin acid AUC. Again, demonstrating the role of P450 3A4 in verapamil metabolism and drug interactions.
It also appears that P450 2C8 may play some role in forming most of the major metabolites of verapamil (except D-620). In vitro, cytochrome P450 2C8 appears to metabolize verapamil as effectively as 3A4 and 3A5. However, this P450 isoform is probably of minor importance in potential in vivo drug interactions since P450 2C8 is proposed to constitute a relatively small fraction of the cytochrome P450 content of the liver [15]. Data to date suggest that cytochrome P450 2C8 does not appear to be involved in the metabolism of many xenobiotics but as further studies are conducted it is inevitable that more substrates for this isoform will be uncovered. Though P450 2C8 certainly has sequence homology to the clinically more important P450 2C9 which metabolizes warfarin and phenytoin, there appears to be little substrate overlap between the two isoforms.
We did not observe any involvement of P450 1A2 or P450 2C9 in the metabolism of verapamil as had been reported previously [3, 4] nor did they participate in norverapamil metabolism. Fuhr et al. [16] have reported that verapamil is an inhibitor of P450 1A2 but is not a substrate of this isoform to an extent likely to reach clinical significance. It should be noted that previous studies of verapamil metabolism [3, 4] have used higher concentrations of verapamil enantiomers as substrate (600–640 μm) compared with the 40 μm concentration used in our screening studies. Peak plasma concentrations of the verapamil enantiomers following dosing to humans are generally less than 1 μm [2]. This difference in verapamil substrate concentrations may explain the disparate results of the studies. Though our concentrations used for substrate screening are also higher than observed clinically, our results suggest that at therapeutic concentrations, P450 1A2 and P450 2C9 are not involved in verapamil metabolism to any significant extent.
We did not observe any appreciable metabolism of either verapamil or norverapamil by cytochrome P450 2D6 (at least as compared with 3A4, 3A5 and 2C8). This is of note since Mautz et al. [17] found that racemic-verapamil inhibited the in vitro cytochrome P450 2D6 mediated O-demethylation and α-hydroxylation of metoprolol in a competitive fashion with Ki values of 0.9–1.8 μm. Thus, though verapamil does not appear to be substantially metabolized by P450 2D6 it does appear to be able to inhibit this P450 isoform, analogous to the inhibition of P450 2D6 by quinidine [18].
To our knowledge, this is the first report of the isoforms involved in the metabolism of the norverapamil enantiomers. Certainly, previous reports of verapamil metabolism have mentioned the potential ‘degradation’ of norverapamil [suggesting further metabolism] [16] but this phenomenon has not been studied. Two metabolites [PR-22 and D-620] were measured following incubations of the enantiomers of norverapamil with the P450s. P450s 3A4, 3A5 and 2C8 all formed the D-620 enantiomer metabolites though there did seem to be a preference for formation of the S-D-620 metabolite especially with P450s 3A5 and 2C8. The stereoselective preference was reversed in the formation of the PR-22 metabolite by P450 2C8 (the only isoform producing this norverapamil metabolite). P450 2C8 metabolized R-norverapamil to R-PR-22 to a much greater extent than S-norverapamil. Thus, all three P450s (3A4, 3A5 and 2C8) were able to form D-620 from norverapamil but only P450 2C8 also formed the PR-22 metabolite. Norverapamil and its metabolites may account for up to one-fourth of the verapamil metabolites recovered in the urine [19] and thus norverapamil may also play a role in cytochrome P450 mediated drug interactions when verapamil is coadministered with other medications.
The studies presented herein suggest that P450s 3A4, 3A5 and 2C8 are the predominant isoforms involved in the metabolism of R- and S-verapamil as well as R- and S-norverapamil. Stereoselectivity was noted in some of the metabolite formation profiles but this appeared to be substrate and isoform dependent. This work confirms that compounds interfering with cytochromes P450 3A4 and 3A5 can potentially cause drug interactions when given with verapamil, particularly in light of the roles P450 3A4 and 3A5 play in both presystemic and hepatic drug metabolism.
Acknowledgments
This work was supported in part by a grant from the National Science Foundation (NSF #OSR-9450578. The authors would like to thank Isabelle Anacleto for her excellent technical support in conducting the metabolite assays.
References
- 1.Eichelbaum M, Ende M, Remberg G, Schomerus M, Dengler H. The metabolism of DL-[14C]-verapamil in man. Drug Metab Dispos. 1979;7:145–148. [PubMed] [Google Scholar]
- 2.Vogelgesang B, Echizen H, Schmidt E, Eichelbaum M. Stereoselective first-pass metabolism of highly cleared drugs: studies of the bioavailability of l- and d-verapamil examined with a stable isotope technique. Br J Clin Pharmacol. 1984;18:733–740. doi: 10.1111/j.1365-2125.1984.tb02536.x. [DOI] [PMC free article] [PubMed] [Google Scholar]
- 3.Kroemer HK, Gautier JC, Beaune P, Henderson C, Wolf CR, Eichelbaum M. Identification of P450 enzymes involved in metabolism of verapamil in humans. Naunyn-Schmiedebergs Arch Pharmacol. 1993;348:332–337. doi: 10.1007/BF00169164. [DOI] [PubMed] [Google Scholar]
- 4.Busse D, Cosme J, Beaune P, Kroemer HK, Eichelbaum M. Cytochromes of the P450, 2C subfamily are the major enzymes involved in the O–demethylation of verapamil in humans. Naunyn–Schmiedebergs Arch Pharmacol. 1995;353:116–121. doi: 10.1007/BF00168924. [DOI] [PubMed] [Google Scholar]
- 5.Gonzalez FJ, Aoyama T, Gelboin HV. Expression of mammalian cytochrome P450 using vaccinia virus. Methods Enzymol. 1991;206:85–92. doi: 10.1016/0076-6879(91)06079-i. [DOI] [PubMed] [Google Scholar]
- 6.Omura T, Sato R. The carbon monoxide–binding pigment of liver microsomes. I. Evidence for its hemoprotein nature. J Biol Chem. 1964;239:2370–2378. [PubMed] [Google Scholar]
- 7.Eichelbaum M, Birkel P, Grube E, Gutgemann U, Somogyi A. Effects of verapamil on P–R intervals in relation to verapamil plasma levels following single i.v. & oral administration and during chronic treatment. Klin Wochenschr. 1980;58:925–929. doi: 10.1007/BF01477049. [DOI] [PubMed] [Google Scholar]
- 8.Wrighton SA, Brian WR, Sari MA, et al. Studies on the expression and metabolic capabilities of human liver cytochrome P450IIIA5 (HLp3) Mol Pharmacol. 1990;38:207–213. [PubMed] [Google Scholar]
- 9.Hebert MF, Roberts JP, Prueksaritanont T, Benet LZ. Bioavailability of cyclosporine with concomitant rifampin administration is markedly less than predicted by hepatic enzyme induction. Clin Pharmacol Ther. 1992;52:453–457. doi: 10.1038/clpt.1992.171. [DOI] [PubMed] [Google Scholar]
- 10.Kolars JC, Awni WM, Merion RM, Watkins PB. First–pass metabolism of cyclosporin by the gut. Lancet. 1991;338:1488–1490. doi: 10.1016/0140-6736(91)92302-i. [DOI] [PubMed] [Google Scholar]
- 11.Lown KS, Kolars JC, Thummel KE, et al. Interpatient heterogeneity in expression of CYP3A4 and CYP3A5 in small bowel. Lack of prediction by the erythromycin breath test. Drug Metab Dispos. 1994;22:947–955. [PubMed] [Google Scholar]
- 12.Fromm MF, Busse D, Kroemer HK, Eichelbaum M. Differential induction of prehepatic and hepatic metabolism of verapamil by rifampin. Hepatology. 1996;24:796–801. doi: 10.1002/hep.510240407. [DOI] [PubMed] [Google Scholar]
- 13.Lampen A, Christians U, Guengerich FP, et al. Metabolism of the immunosuppressant tacrolimus in the small intestine: Cytochrome P450, drug interactions, and interindividual variability. Drug Metab Dispos. 1995;23:1315–1324. [PubMed] [Google Scholar]
- 14.Kantola T, Kivisto KT, Neuvonen PJ. Erythromycin and verapamil considerably increase serum simvastatin and simvastatin acid concentrations. Clin Pharmacol Ther. 1998;64:177–182. doi: 10.1016/S0009-9236(98)90151-5. [DOI] [PubMed] [Google Scholar]
- 15.Shimada T, Yamazaki H, Mimura M, Inui Y, Guengerich FP. Interindividual variations in human liver cytochrome P–450 enzymes involved in the oxidation of drugs, carcinogens and toxic chemicals: Studies with liver microsomes of 30 Japanese and 30 Caucasians. J Pharmacol Exp Ther. 1994;270:414–423. [PubMed] [Google Scholar]
- 16.Fuhr U, Woodcock BG, Siewert M. Verapamil and drug metabolis by the cytochrome P450 isoforms CYP1A2. Eur J Clin Pharmacol. 1992;42:463–464. doi: 10.1007/BF00280138. [DOI] [PubMed] [Google Scholar]
- 17.Mautz DS, Nelson WL, Shen DD. Regioselective and stereoselective oxidation of metoprolol and bufuralol catalyzed by microsomes containing cDNA–expressed human P4502D6. Drug Metab Dispos. 1995;23:513–517. [PubMed] [Google Scholar]
- 18.Kobayashi S, Murray S, Watson D, Sesardic D, Davies DS, Boobis AR. The specificity of inhibition of debrisoquine 4–hydroxylase activity by quinidine and quinine in the rat is the inverse of that in man. Biochem Pharmacol. 1989;38:2795–2799. doi: 10.1016/0006-2952(89)90433-4. [DOI] [PubMed] [Google Scholar]
- 19.Kroemer HK, Echizen H, Heidemann H, Eichelbaum M. Predictability of the in vivo metabolism of verapamil from in vitro data: Contribution of individual metabolic pathways and stereoselective aspects. J Pharmacol Exp Ther. 1992;260:1052–1057. [PubMed] [Google Scholar]