

Abstract
Aims
Propofol is a widely used i.v. anaesthetic agent. However, its binding properties to blood components have not been fully studied.
Methods
We studied the binding of propofol to erythrocytes, to human serum and to isolated serum proteins. Because propofol bound to ultrafiltration and equilibrium dialysis membranes, we used a co-binding technique with dextran coated charcoal and with erythrocytes.
Results
Propofol free fraction in blood was 1.2–1.7% at total concentrations ranging from 2.80 to 179 μm (0.5 to 32 μg ml−1). Fifty percent was bound to erythrocytes and 48% to serum proteins, almost exclusively to human serum albumin. In the clinical range of concentrations (0.5–16 μg ml−1) 40% of the molecules bound to erythrocytes are on the red blood cells membranes. No binding to lipoproteins occurred and binding to α1-acid glycoprotein was less than 1.5%
Conclusions
We conclude that hypoalbuminaemia may increase propofol free fraction particularly during prolonged administration. Since propofol is non-restrictively cleared, no change in clearance is expected to occur, and the increase in free fraction will not be compensated by a parallel increase in clearance. It is also noted that many in vitro studies used concentrations 50 to 500 times the concentration expected to be encountered in the immediate cellular environment.
Keywords: anaesthetic agents, pharmacology, pharmacokinetics, propofol, protein binding
Introduction
Propofol is a widely used intravenous agent for induction and maintenance of anaesthesia and also for sedation in ICUs. It is a highly lipophilic drug more than 95% bound to human serum [1, 3]. Also, haemoglobin has recently been shown to bind propofol [4]. However, its binding properties on erythrocytes and serum proteins remain to be precisely quantified.
The knowledge of binding properties of drugs is of considerable importance not so much because of possible displacement interactions with other drugs [5], but because it is assumed that only a small fraction of the circulating drug (the free drug concentration) is able to cross membranes, especially the blood brain barrier and the endothelial barrier in the heart [6]. Propofol has a number of effects on the cardiovascular system including impairment of myocardial contractile force and a protective effect against ischaemia-reperfusion syndrome, but these effects often occur in vitro at concentrations which are very different from those seen in patients [7–9]. Thus, precise knowledge of the concentration of drug able to reach the target sites may help in differentiating between the numerous effects described and those which might be observed at therapeutic concentrations. Another application lies in the fact that pharmacokinetically driven infusion of anaesthetic agents is of growing interest [10, 11]. The basic concept of computer driven anaesthesia is to link dosing to pharmacokinetics and to pharmacodynamics. In that context, the precision of prediction models will certainly be improved if we can take into account the free fraction (and the factors leading to changes in this fraction). We, therefore, studied the binding of propofol on red blood cells, human serum and human serum fractions.
Methods
After institutional approval, blood was sampled from healthy males aged 28–47 years who gave their consent. All subjects were chosen from the same blood group (A+) for studies on erythrocytes in order to avoid any immunological alteration due to pooling (it was not possible to ensure complete absence of plasma in the erythrocyte solution during preparation). Sampling was done in Vacutainer® tubes with no additive (serum preparation) or with EDTA (washed cells preparation).
Washed erythrocytes and membranes (ghost cells) preparation
Blood was sampled on EDTA and rapidly centrifuged. The supernatant and the buffy coat were discarded and the remaining cells were washed three times with saline. They were suspended in buffer (see after for the composition) or in human serum at an approximate haematocrit of 46–48%. Ghost cells preparation was conducted at 4° C [12]. Washed erythrocytes were lysed with 5 mm K2HPO4 buffer for 15 min. After centrifugation, the lysed cells were washed until colourless with 5 mm phosphate buffer pH 7.40 containing 1.0 mm EDTA and 0.05 mm phenylmethylsulfonyl fluoride. Before resuspension in the usual buffer, the cells were suspended for reannealing at 37° C in isotonic phosphate buffer pH 7.40 containing 0.25 mm MgCl2 and 0.075 mm CaCl2.
Buffer and serum protein fractions
The serum obtained from the volunteers was pooled and frozen for no more than 4 weeks before use. The following fractions were purchased from Sigma Chemical (St Quentin-Fallavier, France): Human serum albumin (HSA) prepared from Cohn fraction V (globulin free) (A-8763), human α1-acid glycoprotein (AAG) prepared from Cohn fraction VI (G-9885), human high density lipoproteins (HDL) (L-5277) and human low density lipoproteins (LDL) (L-5402). The same buffer with the following composition (mm) was used throughout the study: NaCl, 118; KCl, 5.0; NaH2PO4, 4; Na2HPO4, 5; CaCl2, 0.8; MgCl2, 0.6. Albumin was dissolved in buffer at two concentrations (300 μm and 60 μm, i.e. respectively 20 and 4 g l−1). AAG was dissolved in buffer at a concentration of 20 μm (0.9 g l−1), LDL was dissolved at a concentration of 1.4 μm (0.2 g l−1 apoprotein) and HDL at a concentration of 5.4 μm (0.8 g l−1 apoprotein). Human serum and buffer solutions were adjusted to pH 7.40 before use if needed.
Propofol was a gift from Zeneca Pharma (Cergy France). Preliminary experiments showed no difference in binding between the drug dissolved in Intralipid® and a solution in methanol (final methanol concentration did not exceed 0.1 to 1%). Propofol adsorption on glass tubes and on polypropylene tubes was less than 10−3% but, we found an adsorption ≥20% on the dialysis and ultrafiltration membranes tested depending on the material and the membrane cut-off. The usual techniques were not available in these conditions and we used two different techniques of co-binding with some modifications of the original techniques [13–15]: 1) Co-binding with erythrocytes and 2) Co-binding with charcoal (see infra for the description of the technique).
Propofol was added to aliquots of erythrocyte solutions, human serum or protein solutions and incubated for one hour. Incubation was conducted at room temperature with a gentle agitation. Propofol was added to erythrocytes at the following concentrations: 2.80, 5.61, 11.2, 22.4, 44.9, 89.8, 179, 359, 718, 1436, 2872 and 5745 μm. These concentrations correspond to concentrations ranging from 0.5 to 1024 μg ml−1. For studies on pooled human serum or HSA solutions, propofol was added at the following concentrations: 2.80, 5.61, 11.2, 22.4, 44.9, 89.8, 179, 359 μm. An additional point at 718 μm was used with serum. For studies on AAG, HDL and LDL, propofol was added at the following concentrations: 2.80, 5.61, 11.2, 22.4, 67.3 and 168 μm. Thus, the ligand to protein molar concentration ratios studied varied from 9.3×10⁻³ to 11.8 for HSA, from 0.14 to 12 for AAG, from 2 to 118 for LDL and from 0.5 to 31 for HDL. After incubating for 1h, the different solutions containing propofol were centrifuged at 3500 g for 10 min and the supernatant was assayed for propofol content.
Three to five replicates were carried out at each concentration for binding on erythrocytes and serum and two to three replicates were done for the rest of the study.
Measurements
Total protein concentration in serum was measured by the method of Lowry (Sigma Chemical, St Quentin-Fallavier, France). HSA, AAG, apolipoproteins A1 and B were measured in serum and buffer solutions by radial immunodiffusion (Partigen, Behring, Rueil-Malmaison, France). Propofol was measured by h.p.l.c. with fluorescence detection [16]. The limit of detection of the assay was 120 nmol ml−1, and the intra- and inter-assay variability (CV) was 6 and 8% at 200 nmol ml−1 and 2.5 and 4% at 1000 nmol ml−1 respectively.
Statistics
We used a site oriented approach rather than a stoichiometric analysis [17, 18]. According to mass balance principle, the total (free and bound ligand) is:
| 1 |
where Ht is haematocrit, T is the total ligand concentration in blood, F is the free ligand concentration in serum, BS is the serum concentration of ligand bound to serum proteins and BE is the concentration of ligand bound to erythrocytes (BE is the concentration in a theoretical solution of pure erythrocytes, i.e., for a theoretical haematocrit of 100%).
The bound concentration to human serum, serum proteins solution, erythrocytes solution or charcoal solution is:
| 2 |
where B and F are the concentrations of bound and free ligand, respectively, niPi are the concentrations of the ith apparent binding site (ni is the number of sites and Pi the molar concentration of proteins), Kdi is the dissociation constant for the ith apparent binding site and Kns is a proportionality constant associated with non specific (linear) binding. The number of apparent binding sites k (one or two), was determined by the Schwartz criterion [19]. Fitting was made with the MK MODEL package [20].
Techniques of co-binding
A three steps implicit approach was used to fit the charcoal (respectively erythrocytes) binding experiments to serum or to isolated fractions. It was not possible to use the original dynamic technique of Yuan et al. [15] because binding of propofol to serum proteins was a very rapid process as compared to binding of propofol to charcoal. On another hand, Urien et al. [14] used a linearization approximation based on the fact that at very low ligand concentrations
since FKa≪1 (Ka=1/Kd). Then, we used a technique of co-binding without direct measurement of the free drug concentration.
Erythrocytes were obtained as previously described and dextran coated charcoal (C-6197) was obtained from Sigma Chemical (St Quentin-Fallavier, France). We used erythrocytes at a final haematocrit of 0.20 and charcoal at a final concentration of 0.75 g l−1. The absence of binding of serum proteins, HSA and AAG to charcoal was verified. Propofol was added at the same concentrations 1) to a charcoal-buffer solution acting as control (respectively to an erythrocyte solution in buffer) and 2) to the charcoal-protein or charcoal-serum solution (respectively to the erythrocytes-protein or erythrocytes-serum solution). In the following, only co-binding to charcoal is described but the same technique applies to co-binding to erythrocytes, the only difference is that the volume of erythrocytes is not negligible and therefore concentrations must be converted into amounts. In a practical way, a buffer-charcoal solution and a serum-charcoal solution (or a protein-charcoal solution) containing the same propofol concentrations were incubated for 1 h followed by 10 min centrifugation at 3500 g and the supernatant was assayed for propofol content. A total independence between binding sites on charcoal and on proteins was assumed: we considered that the presence of charcoal and serum proteins simultaneously in the same solution did not change the affinity of the sites to propofol (i.e. we considered that no cooperativity occurred). We considered the following linear systems T1 = BC1+F1 (for the buffer solution) and T2 = BS2+BC2+F2 (for the serum or protein solution), where T, F and BS are as previously defined and BC is the propofol concentration bound to charcoal; BS and BC are defined by equation 2. Propofol binding parameters to charcoal were first obtained by regression with MK MODEL, using the charcoal-buffer solution data and then, these parameters were used to calculate the free propofol concentration in the charcoal-serum or charcoal-protein solutions (BC2) after having calculated the fraction bound to charcoal by difference between the total amount (T2) and the amount measured in the supernatant (BS2+F2) (we made the assumption that no re-equilibration occurred during centrifugation.) This solution for F2 was obtained using non-linear regression with the method of Raphson-Newton [21]. Finally, we fitted the bound (BS2) vs free (F2) concentrations using equation 2 with MK MODEL as usual.
A preliminary experiment comparing this technique and the technique using linearization at low ligand concentration [14] has shown that the ratio nP/Kd was similar. However, the linearization technique applies only at very low ligand concentrations, when the free concentration is assumed to be much lower than the Kd.
We calculated the 95% confidence intervals for the parameters by bootstrapping the original data sets rather than using errors of estimation [22]. For the three-step approach we first generated new sets of calculated free concentrations by bootstrapping the propofol-charcoal data and then used these sets to calculate the confidence intervals. This technique gave almost the same results as if the errors calculated at the first step (with the resampling technique) had been used to calculate the final error using the classical method of propagation of errors. Bootstrapping was always performed with 512 replicates.
When possible, normalisation of free and bound concentrations with respect to protein concentration (Pi) in equation 2 was used for the presentation of data.
Results
The pooled human serum had the following composition: total protein content: 74.4 g l−1, HSA: 44.1 g l−1, α1-acid glycoprotein: 0.67 g l−1, apolipoprotein A1: 1.30 g l−1, apolipoprotein B: 0.96 g l−1. Calculations done using equation 1 show that in the range of clinically relevant concentrations, propofol free fraction in blood ranged from 1.2% at total propofol concentration of 2.80 μm (0.5 μg ml−1) to 1.7% at 89.8 μm (16 μg ml−1) and that 50% of propofol was bound to erythrocytes (Figure 1). Of these 50% bound to erythrocytes, about 30–40% was bound to the cell membrane and the remaining part (60–70%) was bound to intracellular components (Table 1 and Figure 2). Considering an average volume of 72×10−12 cm3 for a red blood cell [10] and =6×10²³ the Avogadro number, this gives on average 7.6×10¹³ apparent sites/erythrocyte, with 20–25% of these sites on the cell membrane. However, at clinical concentrations, 40% of propofol binds to membranes and 60% to intracellular components because of the high affinity of the membranes.
Figure 1.
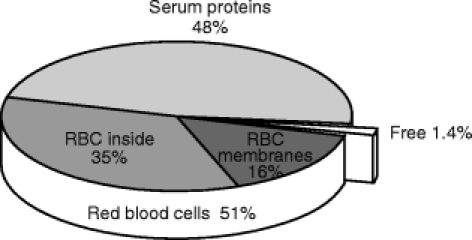
Distribution of propofol in blood. Data are from table 1, with a haematocrit of 0.45 and a propofol concentration in blood of 1 μg ml−1. The values are similar in the entire range of concentrations encountered in clinical situation, i.e. 0.5 to 16 μg ml−1.
Table 1.
Binding parameters of propofol to erythrocytes, human serum and human serum proteins. Results are given with three significant digits (95% Confidence Interval in bracket).
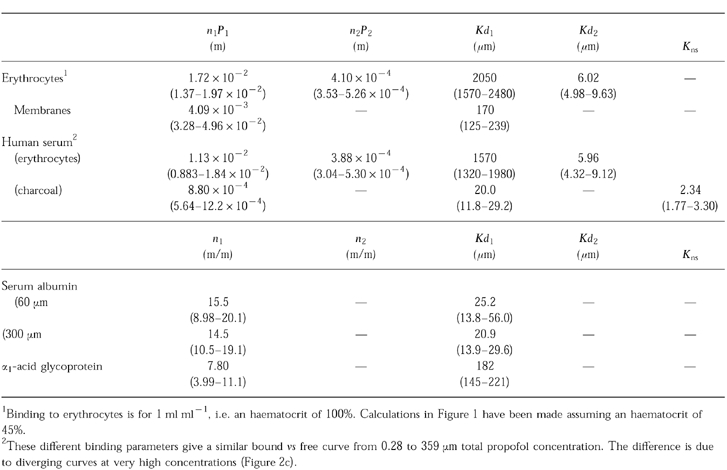
Figure 2.
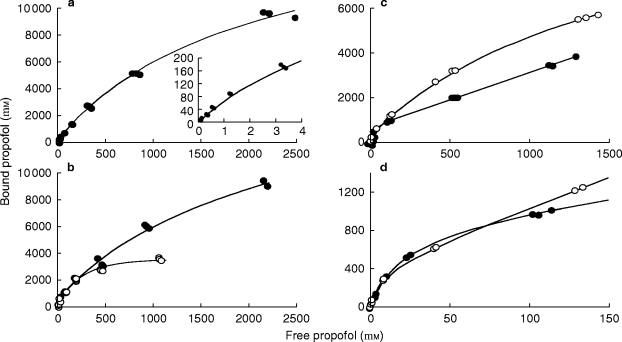
Bound vs free propofol concentration in erythrocytes (a). Closed circles are experimental data and the line is the fitted curve. The inset shows the initial part of the curve at clinically relevant concentrations. The lower left figure (b) represents the bound vs free propofol concentration in erythrocytes (closed circles) and in membranes (open circles). The lines are the fitted curves. Because of a higher affinity of the membranes, 40% of the ligand binds to membranes at low (clinically relevant) concentrations. The right part of the figure shows bound vs free propofol in human serum. Because of the three steps approach used to fit the data, the data do not present the usual pattern. Closed circles represent the data obtained with charcoal as co-binder and open circles represent the data obtained with erythrocytes (see text for details). The lines are the fitted curves. The upper part (c) shows the entire range of concentrations studied and the lower part (d) the initial part. At total serum concentrations lower than 359 μm (64 μg ml−1) charcoal and erythrocytes gave similar results.
Propofol binding to charcoal exhibited a one site profile with a specific capacity n = 4.7×10⁻⁴ m/g, a Kd=20 μm, and a non-specific binding constant Kns = 1.8. Co-binding to erythrocytes and to charcoal gave similar results at propofol concentrations lower than 359 μm (64 μg ml−1), with 45 to 48% of propofol molecules bound to serum (Table 1 and Figure 3). Binding to isolated serum protein was also concurrently studied with co-binding to erythrocytes and to charcoal. These two techniques gave almost identical results for binding to HSA in the range of concentration from 2.80 to 359 μm and we report only the charcoal experiments. At higher propofol concentrations the two techniques gave different results. With isolated HSA a sigmoid bound vs free curve was observed at concentrations greater that 359 μm, showing that the assumption of independence did not pertain at high ligand concentrations. However, binding experiments to isolated serum proteins showed that propofol was bound almost exclusively to HSA, although the binding capacity of isolated HSA was lower than that found with complete human serum (Table 1). In the range of concentrations studied, the affinity of propofol to AAG was very low and nearly no propofol was bound to HDL and LDL at concentrations lower than 168 μm.
Figure 3.
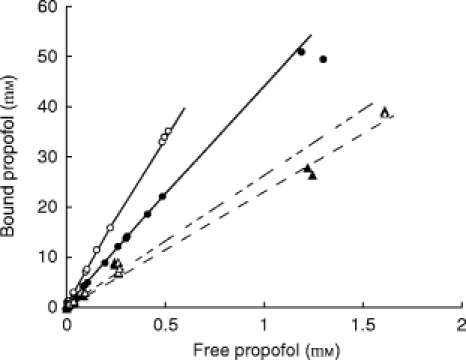
Comparison of the bound vs free propofol concentration at low concentrations. This figure shows the data obtained with serum and charcoal (closed circles) and erythrocytes (open circles). Solid lines are the fitted curves. The data and lines are the same as those represented in Figure 2, but at much lower concentrations. Binding of propofol to isolated albumin is represented by the triangles and dashed lines. Open symbols and upper dashed line have been obtained with the solution containing 4 g l−1 HSA, whereas the closed symbols and lower line have been obtained with the solution containing 20 g l−1 HSA. In fact binding to HSA in buffer was less strong than binding to serum. No other fraction has been found to bind propofol.
Discussion
The present study shows that propofol is more than 98% bound in whole blood over a range of clinical concentrations. Both red blood cells and serum proteins (nearly exclusively albumin) equally bind propofol.
The lipophilic properties of the molecule constrained us to accommodate existing techniques for measuring the free drug concentration in serum and in serum protein solutions. Contrary to other authors, we found that propofol significantly bound to ultrafiltration and dialysis membranes. A linearization technique has been used in similar cases [13, 14], but at least two major constraints are part of the technique. Firstly, one must use very low concentrations of ligand, especially if at least one binding site has high affinity and/or low capacity for the drug, i.e. saturation occurs very rapidly at low concentrations, and secondly this technique allows only the estimation of the ratio nP/Kd (or the product nP×Ka, where Ka is the association constant). We used a new approach that allowed us to calculate the binding parameters to human serum and to serum protein solutions in a large range of concentrations. Nevertheless, this implicit numerical solution or three steps approach needs the assumption that the sites under study and the control sites (on erythrocytes or charcoal) are totally independent, i.e., their binding parameters did not change when proteins are added to the erythrocytes-buffer or charcoal-buffer solution. In fact, such a change occurred at very high concentrations and a sigmoid bound vs free concentration curve was observed with HSA at concentrations higher than 359 μm. The kinetic approach of Yuan et al. [15] was not suitable in the case of propofol because equilibration occurred too rapidly to permit the calculation of rate constants.
Propofol binds tightly to erythrocytes: about 50% of the drug distributes in the red blood cells fraction. At total concentrations lower than 100 μm, i.e. free drug concentration lower than 2 μm, 30–40% of this fraction is bound to the erythrocyte membranes. The remaining 48% is bound to serum proteins and almost exclusively to serum albumin, since less than 2% binds to AAG and non specific binding to lipoproteins occurs only at concentrations greater than 168 μm. However, even in the range of concentrations observed in clinical practice propofol exhibited non linear binding with a 30% decrease in binding between the low total concentration (0.5 μg ml−1 with 1.2% binding) and the high concentration (16 μg ml−1 with 1.7% binding).
The role of protein binding (and of binding to erythrocytes) in propofol pharmacokinetics and pharmacodynamics has been emphasised [23]. A great number of physiological and pathological circumstances leading to changes in the blood composition may alter binding of propofol to blood components. However, our results show that only major changes in blood composition would significantly alter propofol free fraction. Isolated anaemia without any decrease in serum protein content would induce very little change in propofol free fraction, since erythrocytes are replaced by proteins: propofol equally binds to erythrocytes and to serum and both components have a low capacity, high affinity site, primarily involved at total concentrations lower than 10–20 μg ml−1. A decrease in blood HSA content would have more important effects. For example, a 20% decrease in binding capacity of serum due to a decrease in albumin content is expected to induce a 12–14% increase in free fraction and a 50% decrease in serum binding capacity would induce a 37–43% increase in free fraction (considering a range of total propofol concentration in whole blood between 1 and 10 μg ml−1). Although noticeable, these changes are not as dramatic as might be expected. This is due to the fact that the above mentioned high affinity sites compensate for the loss of global capacity. However, adverse effects due to increased propofol free fraction are expected to be frequent both due to drug displacement interaction [5] and to pathophysiological conditions leading to hypoalbuminaemia. Parallel to its high intravascular binding, propofol exhibits a large volume of distribution (V), attesting major tissue distribution [24–26]. If VP = vascular volume, VT = volume of the tissue water, fu = fraction unbound in blood and fuT = fraction unbound in tissues, the following equation relates the volume of distribution to the free fraction in blood [6]:
Since V VP, V k×fu, and therefore, the increased free fraction in hypoalbuminaemia will lead to an increased volume of distribution in proportion to the increase in free fraction (considering no change in tissue binding). On the other hand, because propofol is a high clearance compound, clearance is not expected to increase in the case of increased free fraction in contrast to would be observed with drugs with low clearance. This will result in an increased plasma half-life, roughly in proportion to the increase in free fraction. The size of a loading dose required to induce anaesthesia will be minimally affected by changes in volume of distribution, but we may expect an increase in awakening time in proportion to the increase in half-life. The effects of increased free fraction will be of clinical concern mostly after repeated injections or during continuous infusion rather than after one initial induction dose and in this case, the maintenance infusion rate may need to be reduced to maintain the same target tissue concentration. Moreover, the prolongation in awakening time after infusion discontinuation may be of greater magnitude than expected because of the possible emergence of a deep compartment after prolonged infusion. Such a major prolongation of the terminal half-life has been observed upon discontinuation of propofol infusion in ICU patients [25]. Thus, care should be taken in these patients, inasmuch as their albumin concentration in serum is often lower than normal.
On the other hand, because only the free drug crosses biological barriers one cannot expect a free propofol concentration greater than 0.5 μm in the immediate cellular environment (at the target site). It is obvious that, because of the large octanol/buffer partition coefficient and the strong binding pattern of the drug, the total (free+bound) concentration inside the cells might be much greater than 0.5 μm. However, this maximum pericellular concentration has to be taken into account when one performs in vitro studies as already emphasised by Alphin et al. [27]. For example, Mouren et al. compared the effects of propofol on a blood perfused Langendorff preparation and a buffer perfused Langendorff preparation [28]. They observed a much greater effect when the hearts were perfused with buffer solution than when the hearts were perfused with a solution containing red blood cells. In addition to their interpretation that only oxygen content can explain this difference, we think that the difference in free fraction may appear as the primary cause. This fact is of great importance because some effects described with in vitro preparations are observed at concentrations higher than 3–100 μm [7, 8, 9, 29, 30]. Such concentrations, sometimes as high as ten times the maximum total concentration observed in patients (and therefore more than 500 times the free drug concentration) are totally unrealistic as long the free drug concentration principle has not been shown to be incorrect.
In conclusion, propofol tightly binds to erythrocytes and serum albumin. Because of the properties of the molecule, a prolongation of effect may be expected in case of hypoalbuminaemia, without any compensation due to a change in clearance. Displacement interaction with other drugs may be worth further investigation. On the other hand, because only the free drug cross membranes, this study shows that propofol concentration in the immediate cellular environment does not exceed 0.1–0.5 μm. This fact needs to be taken into account when performing in vitro studies.
Acknowledgments
The authors wish to thank Mrs Régine Le Guen for technical assistance and Zeneca Pharma for the gift of propofol.
This work was supported in part by a grant from Association MAPAR.
References
- 1.Servin F, Desmonts JM, Haberer JP, Cockshott ID, Plummer GF, Farinotti R. Pharmacokinetics and protein binding of propofol in patients with cirrhosis. Anesthesiology. 1988;69:887–891. doi: 10.1097/00000542-198812000-00014. [DOI] [PubMed] [Google Scholar]
- 2.Gin T, Yau G, Jong W, Tan P, Leung RKW, Chan K. Disposition of propofol at caesarean section and in the postpartum period. Br J Anaesth. 1991;67:49–53. doi: 10.1093/bja/67.1.49. [DOI] [PubMed] [Google Scholar]
- 3.Costela JL, Jimenez R, Calvo R, Suarez E, Carlos R. Serum protein binding of propofol in patients with renal failure or hepatic cirrhosis. Acta Anaesthesiol Scand. 1996;40:741–745. doi: 10.1111/j.1399-6576.1996.tb04521.x. [DOI] [PubMed] [Google Scholar]
- 4.Altmayer P, Buch U, Buch HP. Propofol binding to human blood proteins. Arzneimittelforschung. 1995;45:1053–1056. [PubMed] [Google Scholar]
- 5.Rolan PE. Plasma protein binding displacement interactions—why are they still regarded as clinically important? Br J Clin Pharmacol. 1994;37:125–128. doi: 10.1111/j.1365-2125.1994.tb04251.x. [DOI] [PMC free article] [PubMed] [Google Scholar]
- 6.Tozer TN. Concepts basic to pharmacokinetics. Pharmacol Ther. 1981;12:109–131. doi: 10.1016/0163-7258(81)90077-2. [DOI] [PubMed] [Google Scholar]
- 7.Park WK, Lynch III C, Johns RA. Effects of propofol and thiopental in isolated rat aorta and pulmonary artery. Anesthesiology. 1992;77:956–963. doi: 10.1097/00000542-199211000-00019. [DOI] [PubMed] [Google Scholar]
- 8.Cook DJ, Housmans PR. Mechanism of the negative inotropic effect of propofol in isolated ferret ventricular myocardium. Anesthesiology. 1994;80:859–871. doi: 10.1097/00000542-199404000-00020. [DOI] [PubMed] [Google Scholar]
- 9.Ko SH, Yu CW, Lee SK, et al. Propofol attenuates ischemia-reperfusion injury in the isolated rat heart. Anesth Analg. 1997;85:719–724. doi: 10.1097/00000539-199710000-00002. [DOI] [PubMed] [Google Scholar]
- 10.Vyuk J, Engbers FHM, Lemmens HJM, et al. Pharmacodynamics of propofol in female patients. Anesthesiology. 1992;77:3–9. doi: 10.1097/00000542-199207000-00002. [DOI] [PubMed] [Google Scholar]
- 11.Bailey JM, Mora CT, Shafer SL. Pharmacokinetics of propofol in adult patients undergoing coronary revascularization. Anesthesiology. 1996;84:1288–1297. doi: 10.1097/00000542-199606000-00003. [DOI] [PubMed] [Google Scholar]
- 12.Mohammed SS, Christopher MM, Metha P, Kedar A, Gross S, Derendorf H. Increased erythrocyte and protein binding of codeine in patients with sickle cell disease. J Pharm Sci. 1993;82:1112–1117. doi: 10.1002/jps.2600821109. [DOI] [PubMed] [Google Scholar]
- 13.Garret ER, Lambert HJ. Pharmacokinetics of trichlorethanol and metabolites and interconversions among variously referenced pharmacokinetic parameters. J Pharm Sci. 1973;62:550–572. doi: 10.1002/jps.2600620404. [DOI] [PubMed] [Google Scholar]
- 14.Urien S, Riant P, Renouard A, Coulomb B, Rocher I, Tillement JP. Binding of indapamide to serum proteins and erythrocytes. Biochem Pharmacol. 1988;37:2963–2966. doi: 10.1016/0006-2952(88)90282-1. [DOI] [PubMed] [Google Scholar]
- 15.Yuan J, Yang DC, Birkmeier J, Stolzenbach J. Determination of protein binding by in vitro charcoal adsorption. J Pharmacokinet Biopharm. 1995;23:41–55. doi: 10.1007/BF02353785. [DOI] [PubMed] [Google Scholar]
- 16.Plummer GF. Improved method for the determination of propofol in blood by high performance liquid chromatography with fluorescence detection. J Chromatogr. 1978;421:171–176. doi: 10.1016/0378-4347(87)80394-8. [DOI] [PubMed] [Google Scholar]
- 17.Klotz IM, Hunston DL. Protein interactions with small molecules. Relationships between stoichiometric binding constants, site binding constants, and empirical binding parameters. J Biol Chem. 1975;250:3001–3009. [PubMed] [Google Scholar]
- 18.Fletcher JE, Spector AA. Alternative models for the analysis of drug-protein binding. Mol Pharmacol. 1976;13:387–399. [PubMed] [Google Scholar]
- 19.Schwartz G. Estimating the dimension of a model. Ann Stat. 1978;6:461–464. [Google Scholar]
- 20.Holford N. MKMODEL. A quantitative modelling system for pharmacologists. V5. Biosoft Cambridge; [Google Scholar]
- 21.Press WH, Flannery BP, Teukolsky SA, Vetterling WT Procedure RTSAFE in Numerical Recipes in C 2nd Ed v2.04. Cambridge: Cambridge University Press; 1992. p. 1992. [Google Scholar]
- 22.Mazoit JX, Cao LS, Samii K. Binding of bupivacaine to human serum proteins, isolated albumin and isolated alpha1-acid glycoprotein. Differences between the two enantiomers are partly due to cooperativity. J Pharmacol Exp Ther. 1996;256:109–115. [PubMed] [Google Scholar]
- 23.Gin T. Pharmacodynamics of propofol and free drug concentrations (letter) Anesthesiology. 1993;78:604. doi: 10.1097/00000542-199303000-00030. [DOI] [PubMed] [Google Scholar]
- 24.Shafer A, Doze VA, Shafer SL, White PF. Pharmacokinetics and pharmacodynamics of propofol infusions during general anesthesia. Anesthesiology. 1988;69:348–356. doi: 10.1097/00000542-198809000-00011. [DOI] [PubMed] [Google Scholar]
- 25.Bailie GR, Cockshott ID, Douglas EJ, Bowles BJM. Pharmacokinetics of propofol during and after long term continuous infusion for maintenance of sedation in ICU patients. Br J Anaesth. 1992;68:486–491. doi: 10.1093/bja/68.5.486. [DOI] [PubMed] [Google Scholar]
- 26.Murat I, Billard V, Vernois J, et al. Pharmacokinetics of propofol after a single dose in children aged 1–3 years with minor burns. Comparison of three data analysis approaches. Anesthesiology. 1996;84:526–532. doi: 10.1097/00000542-199603000-00006. [DOI] [PubMed] [Google Scholar]
- 27.Alphin RS, Martens JR, Dennis DM. Frequency-dependent effects of propofol on atrioventricular nodal conduction in guinea pig isolated heart. Anesthesiology. 1995;83:382–394. doi: 10.1097/00000542-199508000-00019. [DOI] [PubMed] [Google Scholar]
- 28.Mouren S, Baron J-F, Albo C, Szekely B, Arthaud M, Viars P. Effetcs of propofol and thiopental on coronary blood flow and myocardial performance in an isolated rabbit heart. Anesthesiology. 1994;80:634–641. doi: 10.1097/00000542-199403000-00021. [DOI] [PubMed] [Google Scholar]
- 29.Yamakage M, Hirshman CA, Croxton TL. Inhibitory effects of thiopental, ketamine, and propofol on voltage-dependant Ca2+ channels in porcine tracheal smooth muscle cells. Anesthesiology. 1995;83:1274–1282. doi: 10.1097/00000542-199512000-00018. [DOI] [PubMed] [Google Scholar]
- 30.Hara M, Kai Y, Ikemoto Y. Propofol activates GABAA receptor-cloride ionophore complex in dissociated hypocampal pyramidal neurons of the rat. Anesthesiology. 1993;79:781–788. doi: 10.1097/00000542-199310000-00021. [DOI] [PubMed] [Google Scholar]