

Abstract
Aims
To characterize the pharmacokinetics of the dual 5α-reductase inhibitor GI198745 (dutasteride) to allow for more accurate predictions of GI198745 concentrations after different dosing schedules.
Methods
In this randomized, single-blind, parallel group study, 32 healthy male volunteers received single oral doses of GI198745 ranging from 0.01 to 40 mg. Data were analysed by nonlinear mixed effects modelling using NONMEM where both linear and nonlinear pharmacokinetic models were examined.
Results
The time course of GI198745 serum concentrations indicated concentration dependent elimination, with the apparent half-life increasing with dose. Data were best described by a two-compartment model with first order absorption and parallel linear and nonlinear elimination pathways. Drug absorption was rapid, and was followed by a short distribution phase. A high volume of distribution (511 l) and a low linear clearance (0.58 l h−1) combined to give a half-life of up to 5 (1–7) weeks at high concentrations. As concentrations declined towards Km (0.96 ng ml−1), the proportion eliminated by the relatively rapid saturable elimination pathway, with a maximum clearance of 6.2 l h−1, increased and the half-life reduced to about 3 days. The estimated inter individual variability for the linear clearance was high (CV = 70%).
Conclusions
GI198745 pharmacokinetics are well described by a pharmacokinetic model with parallel linear and nonlinear elimination. Simulations using this model show that at daily doses of 0.1 mg the steady state drug concentrations, and the rate at which these are achieved, are mainly influenced by the nonlinear pathway, while at daily doses above 1 mg they are almost entirely influenced by the linear pathway.
Keywords: 5α-reductase inhibitor, nonlinear, NONMEM, pharmacokinetics, dutasteride
Introduction
Pharmacological intervention to treat benign prostatic hyperplasia (BPH) is desirable due to the high incidence of this disease and its resulting erosion in the quality of life for affected men. Approximately 40–50% of men over the age of 60 years suffer symptoms of bladder outlet obstruction caused by BPH and ultimately 25–30% of these require surgery [1, 2]. Dihydrotestosterone (DHT) is thought to be the androgen primarily responsible for the development of BPH. Testosterone is converted to DHT by 5α-reductase of which there are two types. Although the relative physiological roles of these enzymes are not yet fully understood, the type 2 5α-reductase is the primary isozyme present in human prostate [3]. Treatment of patients with finasteride, a selective type 2 5α-reductase inhibitor, reduces circulating DHT concentrations to 20–40% of baseline values and has proven efficacious for the treatment of BPH [4]. There is a possibility that lowering circulating DHT concentrations beyond those observed with finasteride may lead to faster onset of action and/or greater magnitude of clinical effect in the treatment of symptoms associated with BPH.
GI198745 (17β-N (2,5-bis (trifluormethyl)phenylcarbamoyl)-4-aza-5-androst-1-en-3-one) is a potent and specific dual 5α-reductase inhibitor. Enzymology studies indicate that GI198745 is a potent irreversible competitive inhibitor of human cloned type 1 and type 2 5α-reductase [5]. In rats and dogs, GI198745 appears more potent than finasteride, a result which likely reflects the greater inherent potency [5] and a longer terminal half-life [6].
Here we report pharmacokinetic modelling of GI198745 using data from the first human single dose escalation study.
Methods
Study design
This study was part of a randomized, single-blind, placebo controlled, parallel group study in which 48 healthy males, aged 20–57 years (median 37 years) and weighing 56.3–102 kg (median 76.1 kg) received single doses of GI198745, finasteride or placebo. Data from the 32 subjects who received GI198745 are addressed in this paper. Each subject gave written informed consent to the study, which was approved by the institutional review board of Besselaar Ltd. The study was carried out in accordance with the provisions of the Declaration of Helsinki (1964) and revisions (Hong Kong 1989). All subjects were healthy according to physical examination and clinical laboratory data. Four subjects per dose level received doses of 0.01, 0.1, 1, 2.5, 5, 10, 20 and 40 mg. GI198745 was administered as oral solutions in a volume of 7.5 ml of PEG400/TWEEN80 0.01% except for 40 mg which was administered in 15 ml. The doses were administered together with 240 ml of water.
Intake of any medications was prohibited from 1 week prior to dosing. Alcoholic beverages, caffeine containing food or beverages and all tobacco products were prohibited from 24 h prior to drug administration. The subjects were fasted from 8 h prior to dosing until 4 h post dosing.
Blood samples (5 ml) for assay of GI198745 levels were drawn predose and at 0.5, 1, 2, 3, 4, 6, 8, 12, 16, 24 h and 2, 3, 7, 14, 21, 28 and, for three subjects, 56 days after dosing. The actual time of sampling was recorded and used in all calculations.
Samples were allowed to stand and clot for at least 30 min and were then centrifuged at a minimum of 3000 g for 15 min. Serum was harvested and stored at −70° C.
GI198745 levels were analysed by a LC/MS assay with a quantification limit of 0.1 ng ml−1 [7]. The assay displayed an intraday coefficient of variation of <15% at the limit of quantification and ≤10% over the rest of the concentration range. The interday coefficient of variation was <10% across the concentration range. All doses except 0.01 mg gave detectable levels and all available data were included in the analysis.
Data analysis
As the expected half-life of GI198745, and thus the duration of the sampling period, was long, the study was by necessity of a parallel group design. This presents special problems for the analysis of the data, as data from different individuals will have to be combined to describe the full dose range. A valid way of combining data from different individuals is using mixed effects modelling, where both population average model parameters and the associated inter individual variabilites are estimated. Therefore, all analyses were carried out using a nonlinear mixed-effect model. The data analysis was performed using the first-order method. Data analysis and simulations were performed using NONMEM IV, level 1.1 and PREDPP v3, level 1.0 (ADVAN9) running on a DEC alphaserver 200 4/275 computer. Xpose 1.14 [8] running under Splus3.3 for Windows (MathSoft Inc., Seattle, Washington) and SAS 6.08 (SAS Institute Inc., Cary, North Carolina) were used to produce graphs and to visually evaluate the fits.
Pharmacokinetic model
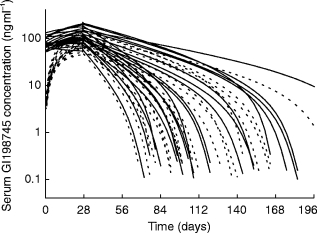
As can be seen from Figure 1, the terminal half-life of GI198745 apparently increased with dose. The AUC increased nonlinearly with dose while Cmax apparently remained proportional to dose. Three different models were applied to the data:
A two compartment model with first order absorption and an absorption lag-time.
As model (1) but with Michaelis-Menten type saturable elimination.
- As model (1) but with two parallel elimination pathways, one saturable and one nonsaturable. This model can be described using a system of differential equations:
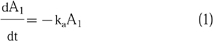
1 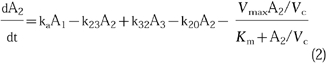
2
where t represents time, A1, A2 and A3 are the amounts in the absorption, central and peripheral compartments, respectively, ka is the absorption rate constant, Vc is the volume of the central compartment, Km is the concentration at which the saturable pathway operates at half the maximal rate, Vmax is the maximum elimination rate of the saturable pathway, k20 is the linear elimination rate constant and k23 and k32 are intercompartmental rate constants.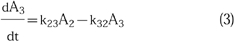
3
Figure 1.
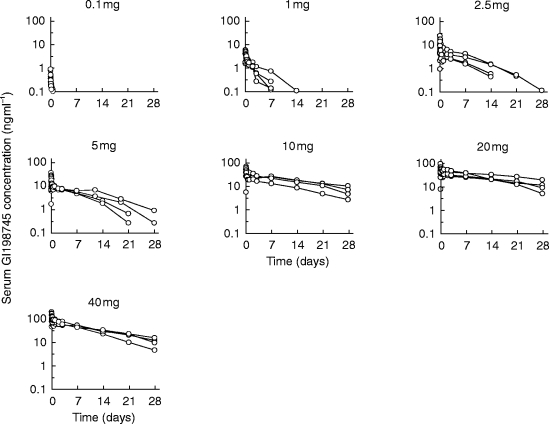
Observed serum GI198745 concentration data by dose.
For all models, k23, k32 and k20 were reparameterised to more physiologically relevant parameters as follows:
| 4 |
| 5 |
| 6 |
where Q is the intercompartmental clearance, CLl is the linear, nonconcentration dependent, clearance and Vp is the volume of the peripheral compartment. Vss, the volume of distribution at steady state, is the sum of Vc and Vp. This model was examined with and without an absorption lag-time.
As GI198745 was administered orally, volumes and clearances in the above model are not absolute values, and it is assumed that the bioavailability of GI198745 is independent of the administered dose.
Variability model
Interindividual variability in the pharmacokinetic parameters was included in the model as described in eqn 7, where Pi is the pharmacokinetic parameter value for the ith subject, P^ the average population parameter value and ηi the deviation for an individual from the population mean. ηi is assumed to be normally distributed with mean zero and a variance to be estimated.
| 7 |
The residual variability (ε), corresponds to the deviation of observed serum concentrations from the curve predicted by the subject specific parameters (Pi). ε is assumed to be normally distributed with mean zero. The variance of ε will be estimated in the analysis. ε was included in the model using the following equation:
| 8 |
where C is the measured serum GI198745 concentration and Ĉ is the value predicted by the model using the individual parameters.
The model was evaluated with interindividual variabilities initially applied to all parameters. If the interindividual variability for a parameter approached zero it was not included in the model.
As this study was performed in a relatively small group of healthy volunteers, no attempts were made to examine the effects of covariates on the pharmacokinetic parameters.
Simulations
The population estimates of the parameters were used to calculate the contributions of nonlinear and linear clearance to total clearance for a range of concentrations. Simulations of dosing to steady state were performed using population parameters and the time to achieve steady state was calculated from the simulated concentrations.
For the final model, individual predicted parameters from all subjects that had received doses of at least 2.5 mg were obtained using a Bayesian approach (POSTHOC routine of NONMEM). Data from these individuals were used as only individuals at these high doses could be expected to have data supporting all parts of the model. The parameters from these subjects were used to simulate GI198745 time-concentration profiles for a variety of dosing regimens, with the purpose of illustrating the interindividual variability in kinetics and comparing the consequences of different loading and maintenance dosing regimens over a range of dose levels.
Results
The linear two compartment model could not describe the pharmacokinetics of GI198745 accurately. Individual predicted values did not follow the shape of the measured profiles and there were clear dose dependent trends.
Using the two compartment Michaelis-Menten model the shape of the individual curves improved in some cases, but the overall fit to the data was not improved as indicated by trends in the residuals and by an increase in the objective function by 11.8.
Using the model with one linear and one nonlinear pathway substantially improved the fit both in terms of patterns in the residuals and in a drop in the objective function by 64.0, which indicated that the model was statistically significantly better than both the linear and Michaelis-Menten models. There was good agreement between actual and predicted concentrations, and there were no obvious trends in the weighted residuals vs time. There was no apparent dependence of weighted residuals on the predicted concentrations indicating that the applied residual variance model was appropriate. Individually predicted values closely followed the observed concentrations (Figure 2).
Figure 2.
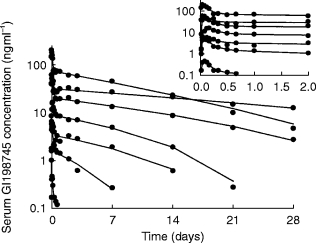
Observed concentration data for one subject per dose group (•), with individually predicted (Bayesian) values (——). Insert: first 2 days after administration.
The parameters of the final model are displayed in Table 1. After a short lag-time, the absorption of GI198745 was rapid, followed by a brief distribution phase. The pharmacokinetics of GI198745 showed an unusual profile, where a high volume of distribution (511 l) and a low linear clearance (0.58 l h−1) combined to give a half-life of up to 5 weeks at high concentrations. As concentrations declined towards Km (0.96 ng ml−1) the proportion eliminated by the relatively rapid saturable elimination pathway, with a maximum clearance of 6.2 l h−1 (calculated as Vmax/Km), increased and the half-life reduced to about 3 days. The population parameters were used to calculate the dependence of the linear, nonlinear and total clearance on the GI198745 concentration, as shown in Figure 3. At low concentrations (below 0.1 ng ml−1) the nonlinear pathway is not saturated and clearance is approximately independent of concentration. At concentrations over 0.1 ng ml−1 the nonlinear clearance starts to become saturated and clearance is highly dependent of concentration. When concentrations exceed 10 ng ml−1, the slower linear clearance dominates, and the total clearance is again concentration independent. The pharmacokinetic parameters were generally well estimated, with the standard error for the estimation being around 10–30% of the estimated population parameter values, except for Vmax (39%) and Km (49%). These two parameters were highly correlated, and reparameterising the model to include the ratio Vmax/Km showed that this could be well estimated (s.e. mean = 14%).
Table 1.
Pharmacokinetic estimates from a two compartment model with simultaneous linear and nonlinear elimination.
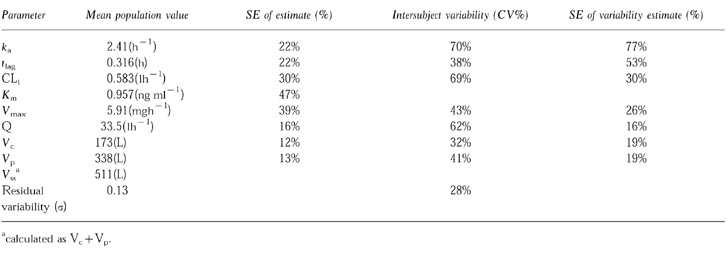
Figure 3.
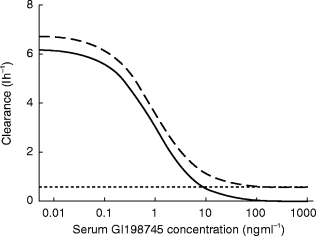
Linear (–-), nonlinear (—) and total (–) clearance as a function of serum concentration.
The interindividual variability associated with the pharmacokinetic parameters was generally high, especially for the linear clearance parameter (CV = 69%), the intercompartmental clearance (62%) and the absorption rate constant (70%). The residual variability was lower at 13%. The variability was well determined except for that associated with ka (s.e. mean = 77%) and tlag (53%).
The simulations of dosing to steady state showed the time to achieve steady state to be dose dependent, ranging from about 1 week at 0.01 mg day−1 to 3 months at doses greater than 0.5 mg day−1. The rate of approach to steady state is independent of dose at doses over 0.5 mg day−1 (Figure 4).
Figure 4.
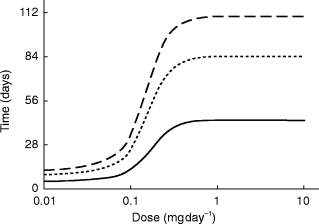
Time to achieve 70% (—), 90% (–-) and 95% (–) of steady state vs dose.
Individual predicted parameters from the 20 subjects who received doses of at least 2.5 mg were used to simulate GI198745 time-concentration profiles after different dosing schedules, as exemplified in Figure 5.
Figure 5.
Simulated individual profiles from a 2.5 mg once daily dose given over 28 days with (—) and without (–-) a loading dose of 40 mg.
Discussion
In the present study, a low serum clearance and a high volume of distribution was observed. This agrees with the pharmacokinetics observed after intravenous doses in animals [6]. As no intravenous dose has been given to man, the bioavailability of GI198745 is unknown, and the modelling was performed assuming that the bioavailability was independent of dose. In animal studies, the bioavailability has been reported as 43% in dogs and 100% in rats [6]. Across the doses administered in the present study Cmax appears to increase proportionally to dose, indicating that absorption is linear, furthermore, any nonlinearities in absorption would most likely produce decreasing exposure with increasing dose, the opposite of what was observed here.
Possible explanations for the nonlinearity include a low capacity metabolic pathway or saturable biliary excretion. Another possible explanation for the nonlinearity could be irreversible binding of GI198745–5α-reductase and subsequent breakdown, a process that would be saturated as the amount of free 5α-reductase decreases.
The close agreement between actual and individually predicted concentrations (Figure 2) indicates that individual predictions from this model, at least in this data rich situation, would be appropriate for use in pharmacokinetic/pharmacodynamic modelling.
Even though a major nonlinearity exists in the elimination of GI198745, the presence of a linear elimination pathway ensures that unlimited accumulation will not take place. Simulations showed that for doses ≥1.5 mg day−1 the nonlinear pathway will contribute less than 10% of the elimination of GI198745 at steady state. Thus at these doses the nonlinear pathway is of little importance in defining the steady state level. As can be expected from the long half-life at higher concentrations, up to 3 months of dosing are needed to reach 90% of steady state concentrations (Figure 4). To address this, a loading dose could be applied. Two possible dosing regimens have been simulated in Figure 5, one with daily doses of 2.5 mg for 28 days and one with a loading dose of 40 mg followed by 2.5 mg daily. The loading dose assists in bringing the levels more rapidly to steady state, the concentrations being slightly higher even after 28 days of dosing. The achieved levels of 50–200 ng ml−1 at the end of dosing could be expected to suppress DHT levels by 93–98% [9], significantly more than the 60–80% previously reported for finasteride [4].
The impact of an increased suppression on the clinical efficacy and safety of GI198745 remains to be evaluated. Clinically effective doses may range from 0.1 to 10 mg day−1, dependent on the desired degree of DHT suppression [9]. At the lower end of this range, the nonlinear kinetics play a major role in defining plasma levels. For the higher doses, plasma steady state levels are mainly determined by the linear clearance, while the nonlinear clearance contributes to the increased rate of the final elimination of drug after the end of treatment and thus in the return of DHT to baseline levels.
As this study was performed in a limited number of subjects, no attempts were made to explain any of the variability estimates by using demographic covariates. The low precision in the estimation of the variability of some of the pharmacokinetic variables is likely due to the small sample size. Using the variability of CLl (69%) which was relatively well estimated from these data, steady state levels could be expected to have high variability.
In summary, this paper has demonstrated that the pharmacokinetics of GI198745 are well described by a model using parallel linear and nonlinear elimination. In spite of the dominance of the nonlinear pathway at low concentrations, at daily doses above 1 mg day−1 the steady state concentrations are almost entirely dependent on the linear clearance mechanism.
References
- 1.Garraway WM, Collins GN, Lee RJ. High prevalence of benign prostatic hypertrophy in the community. Lancet. 1991;338:469–471. doi: 10.1016/0140-6736(91)90543-x. [DOI] [PubMed] [Google Scholar]
- 2.Lange PH. Is the prostate pill finally here? N Engl J Med. 1992;327:1234–1236. doi: 10.1056/NEJM199210223271709. [DOI] [PubMed] [Google Scholar]
- 3.Russell DW, Wilson JD. Steroid 5alpha-reductase: two genes/two enzymes. Ann Rev Biochem. 1994;63:25–61. doi: 10.1146/annurev.bi.63.070194.000325. [DOI] [PubMed] [Google Scholar]
- 4.Moore E, Bracken B, Bremner W, et al. Proscar: five-year experience. European Urol. 1995;28:304–309. doi: 10.1159/000475071. [DOI] [PubMed] [Google Scholar]
- 5.Tian G, Mook RA, Moss ML, Frye SV. Mechanism of time-dependent inhibition of 5alpha-reductases by delta1–4-azasteroids: Toward perfection of rates of time-dependent inhibition by using ligand binding energies. Biochem. 1995;34:13453–13459. doi: 10.1021/bi00041a024. [DOI] [PubMed] [Google Scholar]
- 6.Bramson HN, Hermann D, Batchelor KW, et al. Unique preclinical characteristics of GG745, a potent dual inhibitor of 5AR. J Pharmacol Exp Ther. 1997;282:1496–1502. [PubMed] [Google Scholar]
- 7.Morris DM, Grosse CM, Selinger KA. Determination of GI198745 in human serum by LC/APCI/MS. 6th International symposium for pharmaceutical and biomedical analysis. 1995 M-P/A9 (Abstract) [Google Scholar]
- 8.Johnsson EN, Karlsson MO. Xpose—An Splus based model building aid for population analysis with NONMEM. In: Aarons L, Balant LP, Danhof M, et al., editors. The population approach: measuring and managing variability in response, concentration and dose. Brussels: The European Commission; 1997. pp. 411–413. [Google Scholar]
- 9.Olsson Gisleskog P, Hermann D, Hammarlund-Udenaes M, Karlsson MO. A model for the turnover of dihydrotestosterone in the presence of the irreversible 5α-reductase inhibitors GI 198745 and finasteride. Clin Pharmacol Ther. 1998 doi: 10.1016/S0009-9236(98)90054-6. in press. [DOI] [PubMed] [Google Scholar]