

Abstract
Aims
The aim of this open, randomised, crossover, parallel-group study was to compare the pharmacokinetics and neutrophil responses of lenograstim when administered subcutaneously (s.c.) and intravenously (i.v.).
Methods
A total of 27 healthy male volunteers was recruited. Lenograstim doses (0.5, 2, 5, or 10 μg kg−1) were administered s.c. or i.v. once-daily for 5 days, and then, after a 10-day washout period, vice versa for a further 5 days. Lenograstim concentrations and absolute neutrophil counts (ANCs) were measured predosing and postdosing on days 1 and 5.
Results
Maximum serum concentrations of lenograstim were higher following i.v. dosing (mean 5.2–185.5 vs 0.7–30.0 ng ml−1 after s.c. dosing on day 1) and attained sooner (median 0.5–0.8 vs 4.7–8.7 h on day 1). However, apparent elimination half-lives of lenograstim were longer following s.c. dosing (mean 2.3–3.3 vs 0.8–1.2 h after i.v. dosing on days 1 and 5). ANCs increased in a dose-dependent manner with both routes of lenograstim, but more prolonged rises and higher ANC peaks were attained following s.c. doses. ANCs peaked on day 6 following 5 μg kg−1 s.c. doses (mean peak = 26.3×10⁹ cells l−1), but on day 2 after 5 μg kg−1 i.v. doses (mean peak = 12.4×10⁹ cells l−1). Irrespective of route, the most common adverse events were headaches and back/spine pain; at doses of up to 5 μg kg−1 these were mild and generally well tolerated.
Conclusions
While supporting the use of both s.c. and i.v. administered lenograstim to treat neutropenia, these results demonstrate that neutrophil responses are more sustained and prolonged with the s.c. route.
Keywords: absolute neutrophil count, granulocyte colony-stimulating factor, healthy volunteers, lenograstim, pharmacokinetics, rHuG-CSF
Introduction
Neutropenia increases risk of infection in patients undergoing cancer chemotherapy, and is frequently a dose-limiting side-effect. Agents shortening the period of chemotherapy-associated neutropenia may reduce incidence or duration of serious infections and enable greater dose-intensification.
Production of neutrophils is controlled naturally by granulocyte colony-stimulating factor (G-CSF). G-CSF stimulates specifically the differentiation and activation of neutrophils from bone marrow-derived progenitor cells [1]. The recent development of recombinant DNA technology has permitted the large-scale expression, and introduction into clinical practice, of recombinant human G-CSF (rHuG-CSF). RHuG-CSF can be expressed either in glycosylated form by Chinese Hamster Ovary cells (lenograstim) [2] or as a nonglycosylated molecule by Escherichia coli (filgrastim) [3]. Lenograstim is identical in amino acid sequence and structure to endogenously produced G-CSF, while filgrastim has an extra methionine residue and is not glycosylated.
Both rHuG-CSFs elevate the number of circulating neutrophils. Characteristically an initial decrease (nadir) in neutrophil counts is followed by a dose-dependent increase [4]. When given as prophylaxis or treatment to patients receiving cytotoxic cancer therapy, rHuG-CSFs reduce the duration of neutropenia, the incidence of infections and the necessity for antibiotics [2, 3].
Lenograstim can be administered either subcutaneously (s.c.) or intravenously (i.v.). This report describes an open, randomised, crossover, parallel-group study designed to compare the pharmacokinetics and neutrophil responses of lenograstim doses when given s.c. and i.v.
Methods
Subjects and treatment
The study population consisted of 27 healthy male volunteers (age 18–38 years; weight 62.0–86.5 kg). All provided written consent. The study was approved by the Besselaar UK Independent Review Board. Volunteers were assigned to receive lenograstim at a once-daily dose of 0.5, 2, 5 or 10 μg kg−1 either by s.c. injection or i.v. infusion (over 30 min) for 5 days and then after a 10-day wash-out period, vice versa for a further 5 days.
Collection of blood and urine samples
For each lenograstim s.c. dose on days 1 and 5, venous blood samples were taken 30 min prior to dosing, and at 0.5, 1, 1.5, 2, 3, 4, 5, 6, 8, 10, 12, 16 and 20 h postdose; additional samples were taken 24, 36, 48 and 72 h after the day 5 dose. For lenograstim i.v. doses on days 1 and 5, venous blood samples were taken from the contralateral arm 30 min before and 0.17, 0.33, 0.5, 0.75, 1, 1.5, 2, 3, 4, 6, 8, 10, 12 and 16 h after the start of infusion. Additional samples were taken 24 and 36 h after the start of the i.v. infusion on day 5.
For each s.c. and i.v. dose on days 1 and 5, urine was collected predose and during the entire 24 h postdose period.
Detection of lenograstim
Serum and urine samples were analysed for lenograstim using an enzyme-immunoassay (EIA) procedure developed by Chugai Pharmaceutical Co. Ltd [5]. The lower limit of detection of lenograstim in this procedure was 32 pg ml−1 and the upper limit was 1000 pg ml−1. Intra-day precision (determined using control samples) was 17.0% at 62.5 pg ml−1, 10.0% at 250 pg ml−1 and 10.1% at 750 pg ml−1. The corresponding accuracy figures were 104.8%, 93.7% and 88.7%.
Pharmacokinetic data analysis
A noncompartmental approach was used to calculate pharmacokinetic parameters for lenograstim. Actual times of blood sampling were used for each serum lenograstim concentration vs time profile. Serum and urine concentrations below the lower limit of detection were taken as zero. Maximum serum concentrations (Cmax) and the time to Cmax (tmax) were noted directly. The area under the serum concentration-time curve (AUC) was calculated using the linear trapezoidal rule, and the absolute bioavailability (F) of each s.c. dose level as F = AUC(0, 24 h) (day 5, s.c.)/AUC(0, 24 h) (day 5, i.v.)× dose(i.v.)/dose(s.c.)×100.
Total clearance (CL) was calculated for i.v. doses as CL = dose/AUC. The apparent elimination half-life (t1/2) of s.c. and i.v. doses was determined following administration on days 1 and 5 by log-linear regression of data points describing the subsequent 24 h phase of the serum concentration-time curve. The terminal t1/2of s.c. and i.v. doses was calculated by log-linear regression of subjectively identified data points describing the terminal phase of the serum concentration-time curve, using the formula t1/2 = (ln 2)/λz, where λz is the terminal elimination rate constant. The amount of lenograstim excreted in the urine (Ae) after s.c. and i.v. doses was obtained by multiplying the collected urine volume by the concentration of lenograstim. Renal clearance (CLr,(0, 24 h)) was determined from CLr,(0, 24 h) = Ae (0, 24 h)/AUC(0, 24 h).
To test for period effects, comparisons of day 5 AUC(0, 24 h) and Cmax values for 2 and 5 μg kg−1 i.v. and s.c. groups were made by analysis of variance (anova) for a two-way crossover design. A test for sequence effect was performed to assess the likelihood of the occurrence of a carry-over effect.
Absolute neutrophil counts
Absolute neutrophil counts (ANCs) in venous blood samples were measured using a Technicon™ H1 Automate.
Safety measurements
Routine laboratory tests were performed prior to the start of treatment, on days 1, 2, 4 and 5 of each treatment period, and on days 1, 7 and 10 of the washout period. Supine blood pressure, pulse rate and temperature were recorded, and an electrocardiogram was performed, before and at time points between 4 and 24 h after each dose.
Investigators monitored adverse events throughout the study and assessed the likelihood of their relationship to lenograstim treatment (none, unlikely, possibly, probably, highly probably).
Results
A total of 27 volunteers was recruited. Groups of six volunteers were scheduled to receive lenograstim at doses of 0.5, 2, 5 and 10 μg kg−1. Two volunteers (assigned to 2 and 5 μg kg−1 groups) withdrew voluntarily prior to dosing and were replaced. One volunteer given 2 μg kg−1 s.c. withdrew due to vomiting and leg pain after the first dose and was replaced. Volunteers given 10 μg kg−1 s.c. or i.v. did not enter the second treatment phase as all experienced intolerable bone pain and changes in alkaline phosphatase (AP) levels during the first treatment phase.
Pharmacokinetic measurements
No period or sequence effect was seen for any pharmacokinetic parameter.
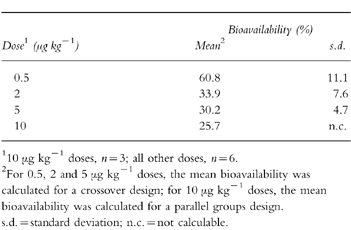
The main pharmacokinetic parameters (Cmax, tmax, AUC(0, 24 h) on days 1 and 5 of the s.c. and i.v. formulations are presented in Table 1. At all doses of lenograstim, mean Cmax and AUC(0, 24 h)were higher and median tmax was shorter following i.v. compared with s.c. administration. Mean Cmax and AUC(0,24 h) values were dose-dependent with both routes. On day 5, the mean absolute bioavailabilities of the s.c. doses were 60.8% at 0.5 μg kg−1, 33.9% at 2 μg kg−1, 30.2% at 5 μg kg−1, and 25.7% at 10 μg kg−1(Table 2).
Table 1.
Pharmacokinetic variables of lenograstim following subcutaneous and intravenous dosing.
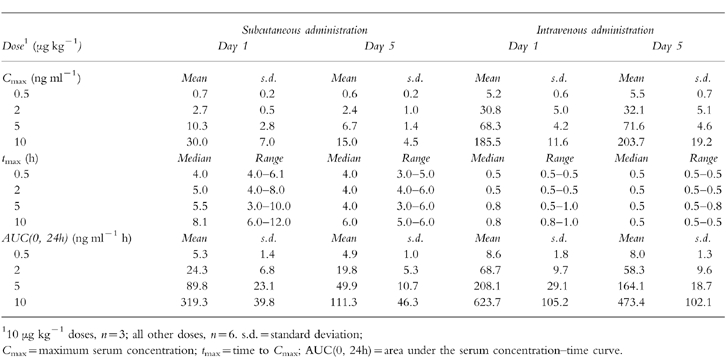
Table 2.
Bioavailability of lenograstim following subcutaneous dosing on day 5.
Total clearance of lenograstim decreased with dose following i.v. administration on both days 1 and 5 (day 1 CL = 75.0 [;.d., 16.9] ml min−1 at 0.5 μg kg−1to 19.5 [;.d. 2.7] ml min−1 at 10 μg kg−1; day 5 CL = 79.1 [.d. 15.1] ml min−1 at 0.5 μg kg−1 to 26.0 [.d. 5.4] ml min−1 at 10 μg kg−1). The mean apparent t1/2 of lenograstim on day 1 and day 5 was 2.3–3.3 h when given s.c. and 0.9–2.1 h when given i.v., with the longest mean apparent t1/2 of 3.3 h (s.d. 1.3) after 2 μg kg−1 s.c. on day 5 and the shortest of 0.9 h (s.d. 0.1) after 0.5 μg kg−1 i.v. on day 1. The median terminal t1/2 of each lenograstim s.c. dose (34.8 h [range 34.6–65.8] at 10 μg kg−1 to 94.1 h [range 94.1–94.1] at 0.5 μg kg−1) was longer than that of its corresponding i.v. dose (15.9 h [range 15.8–19.9] at 10 μg kg−1 to 55.1 h [range 55.1–55.1] at 0.5 μg kg−1). Renal clearance was low, <0.5 ml min−1, for all s.c. and i.v. doses on days 1 and 5.
Neutrophil response
Mean ANC nadirs were observed on day 1 within 10–20 min of i.v. administration of lenograstim (0.8×10⁹ l−1 after 0.5 μg kg−1; 0.3×10⁹l−1 after 2, 5 and 10 μg kg−1), and within 30–60 min of s.c. administration (2.5, 2.2, 1.8 and 2.4×10⁹ l−1, respectively).
ANCs then began to rise in a dose-dependent manner (Figure 1). Greater ANC increases were observed following each s.c. dose compared with its corresponding i.v. dose, and higher ANC peaks were attained. While ANCs remained relatively constant from day 2 following the 0.5, 2 and 5 μg kg−1 i.v. doses, rises were observed until day 6 after the 5 and 10 μg kg−1 s.c. doses. A mean ANC peak of 26.3×10⁹ l−1 on day 6 followed the 5 μg kg−1s.c. doses; the mean ANC peak for 5 μg kg−1i.v. on day 2 was 12.4×10⁹ l−1.
Figure 1.

Mean absolute neutrophil count (ANC) following subcutaneous (s.c. - - -) and intravenous (i.v. –––) administration of lenograstim (0.5 (▪), 2 (♦), 5 (▴) μg kg−1, n = 6; 10 (•) μg kg−1, n = 3) to healthy volunteers for 5 days.
Safety
Increases in alkaline phosphatase (AP), lactate dehydrogenase (LDH), and uric acid (UA) concentrations were observed. Changes were maximal on days 5 and 6 and were greater following s.c. than i.v. administration; rises above the normal ranges (AP = 97–240 i.u., LDH = 174–359 i.u., UA = 221–449 i.u.) were seen following all s.c. doses except the 0.5 μg kg−1 s.c. dose, and after the 10 μg kg−1 i.v. dose. All laboratory values returned to normal within 7–10 days of the final dose.
No significant changes in blood pressure, pulse rate or temperature were recorded during the study, and electrocardiograms were normal.
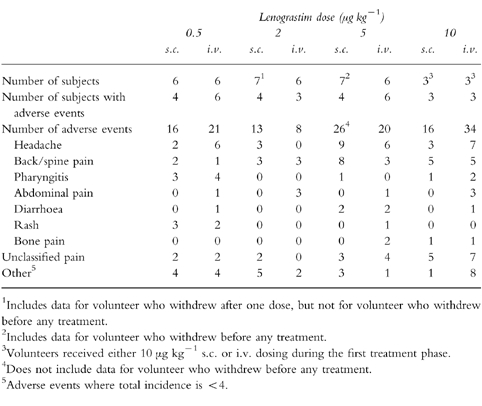
Lenograstim was generally well tolerated when given s.c. and i.v. at doses of up to 5 μg kg−1, and there was no apparent difference in the incidence of adverse events (Table 3). The total number of adverse events increased with dose, and the most common were headache, back/spine pain, generalized pain and pharyngitis. Seven volunteers (one with 5 μg kg−1 s.c.; three with 10 μg kg−1 s.c.; and three with 10 μg kg−1 i.v.) required ibuprofen (400 mg) for pain relief. Twenty-eight adverse events were considered by the investigators to be highly probably related to lenograstim treatment (22 bone pain, 2 generalized aches, 1 joint pain, 1 neck pain, 1 left subcostal pain, 1 pharyngitis); all occurred at the 10 μg kg−1 dose level (11 s.c.; 17 i.v.).
Table 3.
Adverse events following subcutaneous (s.c.) and intravenous (i.v.) dosing of lenograstim.
Discussion
The results of this study in healthy volunteers demonstrate that the pharmacokinetics of both s.c. and i.v. lenograstim are dose- and time-dependent. However, the maximum serum concentration of lenograstim is higher and attained sooner following i.v. administration, yet t1/2 is longer and ANC rises are more pronounced when the s.c. route is used.
Previously published data on the pharmacokinetics of lenograstim are limited. The present results are in agreement with an earlier study in healthy Japanese adults that also showed the pharmacokinetics of lenograstim (1–40 μg day−1 i.v.) to be dose- and time-dependent [5]. The time-dependent component may be associated with the accompanying rise in ANCs through which there is an increase in the capacity of neutrophil receptor-mediated endocytosis and degradation [6]. Increasing clearance of lenograstim with rising ANCs, to a maximum of 2 ml min−1 kg−1 at 17×109 cells l−1, has been observed [2]. Similarly, when nonglycosylated rHuG-CSF (filgrastim, 5–15 μg kg−1 s.c.) was administered to children with severe chronic neutropenia, increased clearance, from 0.40 to 0.74 ml min−1 kg−1, accompanied rises in ANCs [7]. The present study showed the renal clearance of lenograstim to be low, but there is evidence that degradation by hepatic enzymes and proteolytic enzymes in mature neutrophils are further important mechanisms [6]. Clearance of G-CSF may be a homeostatic mechanism to control neutrophil levels.
The longer apparent t1/2following s.c. compared with i.v. administration is probably due to the prolonged release of the former from its site of administration to the systemic circulation. The apparent t1/2of the lower lenograstim i.v. doses (0.5, 2, 5 μg kg−1) in the present study of healthy volunteers (≈1 h) is similar to that found for similar doses of filgrastim (1–3 μg kg−1) administered i.v. to cancer patients (≈1.5 h) [8]. Longer apparent t1/2s have, however, been observed following higher i.v. doses of filgrastim (10–60 μg kg−1) in cancer patients (≈3.5–4 h) [6]. It is suggested that the apparent t1/2s of rHuG-CSFs are affected by some disease states, and that clearance mechanisms are saturated at higher doses [2, 9].
The dose-dependent increase in Cmax following lenograstim administration in the present study is in agreement with data for filgrastim [3]. The observed tmax following s.c. administration (4–9 h) fits well with the study by Stute et al. [7] which reports the tmax of filgrastim to be 4–12 h.
The initial nadir and subsequent rapid increase in ANC observed following lenograstim administration in this study is similar to previous time-dependent neutrophil responses reported from studies in both healthy subjects and cancer patients [4, 5, 10–12]. Lenograstim has been shown to be more potent than filgrastim in increasing ANCs both in vitro [13] and in vivo [14]. The more pronounced elevation in ANCs seen in the present study in response to s.c. compared with i.v. administration of lenograstim indicates that the s.c. route may be more appropriate when aiming to achieve a large and sustained neutrophil recovery.
Previous studies agree that lenograstim is generally well tolerated [4]. Bone pain in the present study in healthy volunteers appeared more severe than that seen previously with filgrastim in studies of patients with bone marrow suppressiof#x005B;10]. A possible explanation for the difference is that the bone pain is related to increased bone marrow activity: a greater intensification of activity, and hence pain, may occur in healthy adults compared with patients with bone marrow suppression.
In summary, the good pharmacokinetic profile, neutrophil response, and tolerability of both s.c. and i.v. administered lenograstim seen in this study support the use of either route to treat or prevent neutropenia. However, the s.c. route offers benefits of a greater and more prolonged neutrophil response.
Acknowledgments
Lenograstim was supplied by Chugai Pharmaceutical Co. Ltd, Japan, and the study was supported by a grant from Chugai Rhône-Poulenc, France.
References
- 1.Steward WP. Granulocyte and granulocyte-macrophage colony-stimulating factors. Lancet. 1993;342:153–157. doi: 10.1016/0140-6736(93)91350-u. [DOI] [PubMed] [Google Scholar]
- 2.Frampton JE, Yarker YE, Goa KL. Lenograstim: a review of its pharmacological properties and therapeutic efficacy in neutropenia and related clinical settings. Drugs. 1995;45:767–793. doi: 10.2165/00003495-199549050-00009. [DOI] [PubMed] [Google Scholar]
- 3.Frampton JE, Lee CR, Faulds D. Filgrastim: a review of its pharmacological properties and therapeutic efficacy in neutropenia. Drugs. 1994;48:731–760. doi: 10.2165/00003495-199448050-00007. [DOI] [PubMed] [Google Scholar]
- 4.Morstyn G, Souza LM, Keech J, et al. Effect of granulocyte colony stimulating factor on neutropenia induced by cytotoxic chemotherapy. Lancet. 1988;i:667–672. doi: 10.1016/s0140-6736(88)91475-4. [DOI] [PubMed] [Google Scholar]
- 5.Sekino H, Moriya K, Sugano T, Wakabayashi K, Okasaki A. Recombinant human G-CSF (rG-CSF) Shinryo to Shinyaku. 1989;26:32–104. [Google Scholar]
- 6.Layton JE, Hockman H, Sheridan WP, Morstyn G. Evidence for a novel in vivo control mechanism of granulopoiesis: mature cell-related control of a regulatory growth factor. Blood. 1989;74:1303–1307. [PubMed] [Google Scholar]
- 7.Stute N, Sanatan VM, Rodman JH, Schell MJ, Ihle JN, Evans WE. Pharmacokinetics of subcutaneous recombinant granulocyte colony-stimulating factor in children. Blood. 1992;79:2849–2854. [PubMed] [Google Scholar]
- 8.Kearns CM, Wang WC, Stute N, Ihle JN, Evans WE. Disposition of recombinant granulocyte colony-stimulating factor in children with severe neutropenia. J Paediatr. 1993;123:471–479. doi: 10.1016/s0022-3476(05)81760-3. [DOI] [PubMed] [Google Scholar]
- 9.Morstyn G. The impact of colony-stimulating factors as cancer chemotherapy. Br J Haematol. 1990;75:303–307. doi: 10.1111/j.1365-2141.1990.tb04340.x. [DOI] [PubMed] [Google Scholar]
- 10.Hollingshead LM, Goa KL. Recombinant granulocyte colony-stimulating factor: a review of its pharmacological properties and prospective role in neutropenic conditions. Drugs. 1991;42:300–330. doi: 10.2165/00003495-199142020-00009. [DOI] [PubMed] [Google Scholar]
- 11.Sato K, Sawada K, Takahashi TA, et al. A time course study for optimal harvest of peripheral blood cells by granulocyte colony-stimulating factor in healthy volunteers. Exp Haematol. 1994;22:973–978. [PubMed] [Google Scholar]
- 12.Lane TA, Law P, Maruyama M, et al. Harvesting and enrichment of haemopoietic progenitor cells mobilized into the peripheral blood of normal donors by granulocyte-macrophage colony-stimulating factor (GM-CSF) or G-CSF. potential role in allogeneic marrow transplantation. Blood. 1995;85:275–282. [PubMed] [Google Scholar]
- 13.Nissen C, Dalle Carbonare V, Moser Y. In vitro comparison of the biological potency of glycosylated versus non-glycosylated rG-CSF. Drug Invest. 1994;7:346–352. [Google Scholar]
- 14.Höglund M, Smedmyr B, Bengtsson M, et al. Mobilization of CD34+ cells by glycosylated and nonglycosylated G-CSF in healthy volunteers—a comparative study. Eur J Haematol. 1997;59:177–183. doi: 10.1111/j.1600-0609.1997.tb00972.x. [DOI] [PubMed] [Google Scholar]