

Abstract
Aims
The cytochrome P450 enzyme CYP1A2 metabolises several drugs and carcinogens. We wanted to determine how much of the variability of CYP1A2 activity is explained by a newly discovered gene polymorphism in intron 1.
Methods
A single nucleotide polymorphism in intron 1 of the CYP1A2 gene at position 734 downstream of the first transcribed nucleotide was identified by DNA sequence analysis. The functional significance of this C/A polymorphism was assessed in 185 healthy Caucasian non-smokers and in 51 smokers by genotyping and phenotyping using caffeine (100 mg oral dose).
Results
Out of the total sample, 46% were homozygous for the variant A, 44% were heterozygous, and 10% were homozygous for the variant C. The ratio of 1,7-dimethylxanthine (17X) plus 1,7-dimethyluric acid divided by caffeine in 0–5 h urine samples from 185 non-smokers did not differ significantly between the three CYP1A2 genotypes. In the 51 smokers, analysis of variance revealed significant differences in the 5 h plasma 17X/caffeine ratios between the genotypes (P=0.008, F-test). The mean ratio was 1.37 in carriers of the A/A genotype, 0.88 in heterozygotes and 0.82 in carriers of C/C. The mean difference between the A/A and C/A groups was 0.48 (95% confidence interval 0.15–0.81; P=0.01).
Conclusions
The A/A genotype, which may represent a CYP1A2 high inducibility genotype, may either be a direct cause of increased CYP1A2activity, or be genetically linked to polymorphisms conferring high inducibility. Further studies are needed to define the role of this polymorphism on the pharmacokinetics of drugs metabolised by CYP1A2 and in the activation of carcinogens.
Keywords: caffeine test, cytochrome P450 1A2, CYP1A2, gene polymorphism, enzyme induction
Introduction
The cytochrome P450 enzyme CYP1A2 plays a major role in metabolism of many commonly used drugs including clozapine, imipramine, caffeine, paracetamol, phenacetin, theophylline, tacrine [1], and some neurotoxins [2]. Furthermore, CYP1A2 activates several aromatic amines and thus is a key enzyme in chemical carcinogenesis [3]. CYP1A2 activity is induced by the binding of aromatic hydrocarbons to the Ah-receptor. In vivo measurement of CYP1A2 activity in several human populations has shown wide interindividual variability, and population studies have reported either unimodal [4], bimodal or trimodal distributions of CYP1A2 activity [5–7]. Also, so-called metabolic crosstalk with polymorphisms of CYP2C19 [8] or GSTM1 [9] appears to modify CYP1A2 activity in humans. The wide interindividual variation in and possible polymodal distribution of CYP1A2 activity are suggestive of polymorphic control of enzyme activity. Very recently, sequencing of genomic DNA has revealed putative polymorphisms in exons 2 and 7 and in intron 1 of CYP1A2 [10–12]. Furthermore, the intron 1 polymorphism appears to affect the inducibility of CYP1A2 [12]. By sequencing intron 1 of CYP1A2 in Caucasian healthy volunteers, we have confirmed the presence of a polymorphism occurring at high frequency and have studied its functional relevance using caffeine as a test drug in populations of non-smokers and smokers.
Methods
The functional effect of the CYP1A2 polymorphism was studied in two groups. First, 185 non-smoking healthy Caucasian volunteers were phenotyped for their CYP1A2 metabolic capacity, using a single oral dose of 100 mg caffeine (Coffeinum purumTM, Berlin-Chemie). Immediately prior to taking the tablet, the volunteers were asked to empty their bladder and urine was collected for the subsequent 5 h. These subjects were recruited from a pool of healthy non-smoking volunteers regularly participating in phase I studies. Non-smoking status was confirmed by inquiry on the day of the test. All subjects had given written informed consent to the phenotyping procedures and to genotype analyses for heritable polymorphisms in foreign compound metabolising enzymes. The volunteers did not participate in drug trials for at least four weeks prior to phenotyping. Urine concentrations of caffeine (137X) and the CYP1A2 catalysed metabolites 1,7-dimethylxanthine (17X) and 1,7-dimethyluric acid (17U) were quantified by h.p.l.c. essentially as described by Grant et al. [13]. The interassay coefficient of variation (5 mg l−1) of each of the caffeine metabolites was 8.4% for 137X, 4.7% for 17U, and 4.8% for 17X (n=13). The urine 17X+17U/137X ratio, calculated on a molar basis, was used as the index of CYP1A2 activity [14].
The second study was performed in 51 healthy volunteers who were current smokers (1 to 50 [mean 15] cigarettes per day for at least 2 weeks prior to the test). They received an oral dose of 100 mg caffeine and a venous blood sample was taken 5 h after administration. The molar metabolic concentration ratio (MR) 17X/137X was used as the index of CYP1A2 activity [15]. 17X and 137X were quantified in plasma as described above but using 10% methanol in the mobile phase. The lower limit of quantification was 0.02 mg l−1 for 17X and 0.03 mg l−1 for 137X. Interassay coefficients of variation were 8.8% for 17X and 8.0% for 137X at a concentration of 5 mg l−1 for both compounds (n=20).
For the determination of genotype, 5–10 ml of whole blood were collected in EDTA tubes. DNA was extracted using a standard phenol/chloroform extraction procedure [16], and DNA samples were dissolved in 10 mm Tris/1 mm EDTA, pH 8.0 and stored at 4° C. Intron 1 of CYP1A2 was amplified by PCR using forward primer P1f (5′-CAACCCTGCCAATCTCAAGCAC, located in exon 1) and reverse primer P4r (5′-AGAAGCTCTGTGGCCGAGAAGG, located in exon 2). A 25 μl PCR mix comprised 10 mm Tris-HCl pH 8.3, 1.25 mm MgCl2, 50 mm KCl, 200 μm dNTPs, 0.2 μm of each of the primers, 1.25 U Taq polymerase (AmpliTaqTM, Perkin Elmer), and 1 μl of genomic DNA. PCR was performed with an initial denaturation for 2 min at 94° C followed by 35 cycles of 30 s at 94° C, 10 s at 60° C, 1 min at 72° C, and a terminal extension for 7 min at 72° C. For sequencing the CYP1A2 intron 1 region from the P1f/P4r PCR product, two shorter fragments were amplified in a nested PCR to increase the specificity (Figure 1). One fragment was amplified with primers P1f (see above) and P2r (5′-AAGAGTCCCTGCCAGTGCTGGC, located in intron 1), and the other fragment was flanked by P3f (5′-GGAACTCCTGGTCCCTTGGGTA, located in intron 1) and P4r (see above). DNA sequence analysis was performed on an ABI 373A instrument using a Taq DyeDeoxy Cycle Sequencing KitTM (Perkin Elmer, Weiterstadt, Germany).
Figure 1.
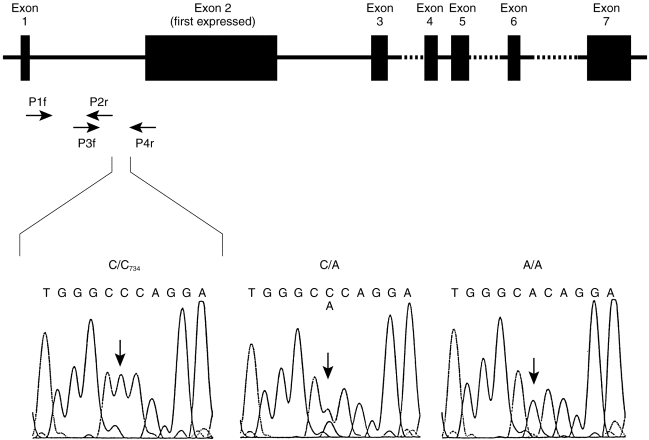
Structure of the CYP1A2 gene. Exons are shown as filled boxes, the dashed lines indicating incompletely characterised intron sequences, and the arrows showing the positions of the primers used for identification and routine genotyping of the intron 1 polymorphism. The boxes below show the DNA sequencing signals of the four nucleotides around the CYP1A2734 polymorphism for the three genotypes C/C, C/A and A/A. Number 734 refers to the position downstream of the first transcribed CYP1A2 nucleotide.
For routine genotyping, a PCR-RFLP test specific for the C/A polymorphism was established using the reaction with primers P1f and P4r as described above followed by a digestion with Bsp120I (MBI Fermentas). Wild-type alleles were cut into two fragments of 709 and 211 bp by the enzyme Bsp120l, whereas the mutant alleles remained uncleaved. Cleavage products were analyzed by 3% agarose gel electrophoresis.
Differences between the genetically defined subgroups were tested by one-way analysis of variance with the SAS statistical program (SAS institute, Cary, USA) with the procedure GLM using the logarithmically (base 10) transformed metabolic ratios. The coefficient of determination (R2) was also calculated using the SAS procedure GLM. Analysis of variance was applied after normal distribution of the logarithmically transformed data from all groups was confirmed using the Shapiro Wilk test. In addition, the prerequisite of homoscedasticity was fulfilled after logarithmic transformation. Means, confidence limits both for absolute values and differences between means were determined from logarithmically transformed values.
Results
We sequenced intron 1 of the CYP1A2 gene in DNA from eight volunteers. Only one polymorphism was identified, namely a C to A transversion at position 734 downstream of the first transcribed nucleotide of CYP1A2 (based on the CYP1A2 sequence published at GenBank accession no. M31664; Figure 1). A mutation-specific PCR-RFLP test was then developed and used to genotype 236 subjects. Only 24 subjects had the homozygous C/C genotype (10%, 95% confidence limits 6.6–15%), whereas 104 subjects had the A/C genotype (44%, 95% CL 38–51%) and 108 were homozygous A/A (46%, 95% CL 39–52%). This distribution is in accordance with the frequencies expected, namely 43% for A/C and 46% for A/A, when applying the Hardy-Weinberg principle based on the experimentally determined frequency of the C/C genotype.
The molar urinary ratios of (17X+17U)/137X following the oral administration of 100 mg caffeine to 185 non-smoking subjects are depicted on the left hand side of Figure 2. Mean values and their 95% confidence limits were 2.54 (2.19–2.99) for the A/A genotype, 2.28 (1.97–2.65) for the A/C genotype, and 3.26 (2.36–4.50) for the C/C genotype. No significant differences between CYP1A2 genotypes were observed according to one way analysis of variance.
Figure 2.
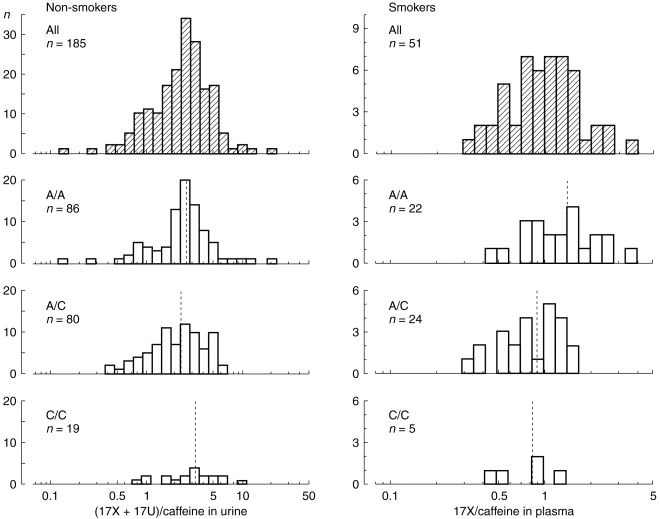
Frequency distribution of caffeine metabolic ratios in the different genotypes with respect to the CYP1A2 intron 1 polymorphism. On the left, logarithmically transformed molar urinary (17X+17U)/137X ratios from 185 non-smoking subjects are shown. There were no significant differences in the mean ratios between the three groups. On the right, the logarithmically transformed plasma 17X/137X ratios from 51 smokers are shown. In this group, the C/A polymorphism had a significant effect on the caffeine metabolic ratios (P=0.008). Dotted lines indicate the mean values in each group. The frequency distribution of each of the subgroups was not significantly different from a normal distribution according to the Shapiro-Wilk test.
In contrast, the mean molar ratios of 17X/137X in plasma from 51 smokers differed significantly between the CYP1A2 genotypes (Figure 2). Mean values and their 95% confidence intervals were 1.37 (1.07–1.72) for the A/A genotype, 0.88 (0.73–1.06) for the A/C, genotype, and 0.82 (0.46–1.46) for the C/C genotype. These differences were significant according to one way analysis of variance (F-test, P=0.008) with a coefficient of determination (R2) of 0.18, indicating that 18% of the phenotypic variability might be explained by the C/A polymorphism. The distribution of the logarithmically transformed data was not significantly different from that of a normal distribution according to the Shapiro Wilk test. However, the metabolic ratios of the A/C group did not appear to be normally distributed on visual inspection of the histogram (Figure 2). Thus, the nonparametric Kruskal-Wallis test was applied to confirm that the differences between the groups were significant (P=0.02 with 2 degrees of freedom). Post-hoc tests using a Bonferroni correction showed a significant difference between the A/A and the A/C group (P=0.01; mean difference: 0.48; 95% confidence limits: 0.15–0.81). In contrast, no significant differences were seen between the C/C and A/C group (mean difference: 0.06, 95% confidence limits: -0.42–0.55) and the C/C and A/A group (mean difference: 0.55, 95% confidence limits:-0.06–1.19).
The smokers were stratified into equal sized groups of moderate smokers (<15 cigarettes per day) and heavy smokers (≥15 cigarettes per day). In the heavy smoker subgroup (n=26), mean (95% confidence limits) of the metabolic ratios were 0.77 (0.34–1.76) for C/C, 0.81 (0.55–1.20) for A/C and 1.40 (1.02–1.92) for A/A, and there was a significant P difference of 0.59 (95% confidence limits 0.17–1.07) between the A/C and A/A groups.
Discussion
In this work we have confirmed the preliminary data of McLeod et al. [12] showing the presence of a polymorphism in intron 1 of the CYP1A2 gene. A single base change, namely a C to A transversion downstream of the first transcribed nucleotide, was identified. The previously published sequence of the wild type CYP1A2 gene contained C at position 734 [17]. However, in the present large population study we have found that the A variant is more frequent and suggest that it be termed CYP1A2*1A and the C variant CYP1A2*1B in accordance with the standard nomenclature for polymorphic drug metabolising enzymes [18].
There were no significant differences in CYP1A2 metabolic activity between the genotypes in non-smoking individuals (i.e., with uninduced CYP1A2 levels) with respect to the intron 1 polymorphism. However, in smokers a 1.6-fold higher metabolic activity was observed in subjects homozygous for the A allele compared with the other genotypes, a difference that was statistically significant. These data are in accordance with those published by McLeod et al. [12] in a smaller study. We observed a significant difference between the A/A and A/C genotypes but not between the A/C and the C/C genotypes. This might indicate that the A allele is a recessive factor for high inducibility but with only 5 subjects in the C/C group the power to establish the mode of inheritance for this gene was too small.
One shortcoming of this study was the different caffeine test ratios used in the non-smoker group and smoker groups. Although it has been shown that both urinary and plasma caffeine ratios reflect CYP1A2 activity [14], plasma ratios may be less biased and more sensitive parameters of CYP1A2 activity [6, 15]. For practical reasons only the urinary (17X+17U)/caffeine ratios could be measured in the study of non-smokers. Therefore, the small effect of this CYP1A2 polymorphism on enzyme induction seen in smokers could also be present in non-smokers, but may not have been detected because a less sensitive index of CYP1A2activity was used in the latter group. Alternatively, in non-smokers other segments in the CYP1A2 gene may be more important for regulation of the CYP1A2 activity.
Mechanistically, this single nucleotide polymorphism in the non-coding region of the CYP1A2 gene may either result in differential binding of putative regulatory proteins as suggested by McLeod et al. [12], or it may be in linkage disequilibrium with other mutations affecting CYP1A2 inducibility. The C/A polymorphism could contribute to interindividual differences in the metabolism of other CYP1A2 substrates. It may also be a risk factor in cancers associated with exposure to arylamines or heterocyclic amines, such as urinary bladder or colon cancer.
Acknowledgments
The study was supported by grants 01EC9408 and 01ZZ9511 of the German Federal Ministry of Education, Science, Research, and Technology. Furthermore, we thank Mr. A. Becker for his contribution to this study.
References
- 1.Bertz RJ, Grannemann GR. Use of in vitro data and in vivo data to estimate the likelihood of metabolic pharmacokinetic interactions. Clin Pharmacokinet. 1997;32:210–258. doi: 10.2165/00003088-199732030-00004. [DOI] [PubMed] [Google Scholar]
- 2.Coleman T, Ellis SW, Martin IJ, Lennard MS, Tucker GT. 1-Methyl-4-phenyl-1,2,3,6-tetrahydropyridine (MPTP) is N-demethylated by cytochromes P450 2D6, 1A2 and 3A4—implications for susceptibility to Parkinson’s disease. J Pharmacol Exp Ther. 1996;277:685–690. [PubMed] [Google Scholar]
- 3.Gooderham NJ, Murray S, Lynch AM, et al. Heterocyclic amines: evaluation of their role in diet associated human cancer. Br J Clin Pharmacol. 1996;42:91–98. doi: 10.1046/j.1365-2125.1996.37513.x. [DOI] [PMC free article] [PubMed] [Google Scholar]
- 4.Catteau A, Bechtel YC, Poisson N, Bechtel PR, Bonaiti-Pellie C. A population and family study of CYP1A2 using caffeine urinary metabolites. Eur J Clin Pharmacol. 1995;47:423–430. doi: 10.1007/BF00196856. [DOI] [PubMed] [Google Scholar]
- 5.Kalow W, Tang BK. Use of caffeine metabolite ratios to explore CYP1A2 and xanthine oxidase activities. Clin Pharmacol Ther. 1991;50:508–519. doi: 10.1038/clpt.1991.176. [DOI] [PubMed] [Google Scholar]
- 6.Fuhr U, Rost KL. Simple and reliable CYP1A2 phenotyping by the paraxanthine/caffeine ratio in plasma and in saliva. Pharmacogenetics. 1994;4:109–116. doi: 10.1097/00008571-199406000-00001. [DOI] [PubMed] [Google Scholar]
- 7.Eaton DL, Gallagher EP, Bammler TK, Kunze KL. Role of cytochrome P4501A2 in chemical carcinogenesis: implications for human variability in expression and enzyme activity. Pharmacogenetics. 1995;5:259–274. doi: 10.1097/00008571-199510000-00001. [DOI] [PubMed] [Google Scholar]
- 8.Rost KL, Brösicke H, Brockmöller J, Scheffler M, Helge H, Roots I. Increase of cytochrome P450IA2 activity by omeprazole: evidence by the 13C-[N-3-methyl]-caffeine breath test in poor and extensive metabolizers of S-mephenytoin. Clin Pharmacol Ther. 1992;52:170–180. doi: 10.1038/clpt.1992.126. [DOI] [PubMed] [Google Scholar]
- 9.MacLeod S, Sinha R, Kadlubar FF, Lang NP. Polymorphisms of CYP1A1 and GSTM1 influence the in vivo function of CYP1A2. Mutat Res. 1997;376:135–142. doi: 10.1016/s0027-5107(97)00036-5. [DOI] [PubMed] [Google Scholar]
- 10.Nakajima M, Yokoi T, Mizutani M, Shin S, Kadlubar FF, Kamataki T. Phenotyping of CYP1A2 in Japanese population by analysis of caffeine urinary metabolites: absence of mutation prescribing the phenotype in the CYP1A2 gene. Cancer Epidemiol Biomarkers Prev. 1994;3:413–421. [PubMed] [Google Scholar]
- 11.Yokoi T, Sawada M, Kamataki T. Polymorphic drug metabolism: studies with recombinant Chinese hamster cells and analyses in human populations. Pharmacogenetics. 1995;5:S65–S69. doi: 10.1097/00008571-199512001-00003. [DOI] [PubMed] [Google Scholar]
- 12.MacLeod SL, Tang Y-M, Yokoi Yokoi, et al. The role of recently discovered genetic polymorphism in the regulation of the human CYP1A2 gene. Proceedings of the American Association for Cancer Research. 1998;39:396. [Google Scholar]
- 13.Grant DM, Tang BK, Kalow W. A simple test for acetylator phenotype using caffeine. Br J Clin Pharmacol. 1984;52:459–464. doi: 10.1111/j.1365-2125.1984.tb02372.x. [DOI] [PMC free article] [PubMed] [Google Scholar]
- 14.Butler MA, Lang NP, Young JF, et al. Determination of CYP1A2 and NAT2 phenotypes in human populations by analysis of caffeine urinary metabolites. Pharmacogenetics. 1992;2:116–127. doi: 10.1097/00008571-199206000-00003. [DOI] [PubMed] [Google Scholar]
- 15.Rostami-Hodjegan A, Nurminen S, Jackson PR, Tucker GT. Caffeine urinary metabolite ratios as markers of enzyme activity: a theoretical assessment. Pharmacogenetics. 1996;6:121–149. doi: 10.1097/00008571-199604000-00001. [DOI] [PubMed] [Google Scholar]
- 16.Sambrook J, Fritsch EF, Maniatis T. Molecular cloning: a laboratory manual. 2. Cold Spring Harbor: Cold Spring Harbor Laboratory Press; 1989. [Google Scholar]
- 17.Ikeya K, Jaiswal AK, Owens RA, Jones JE, Nebert DW, Kimura S. Human CYP1A2: sequence, gene structure, comparison with the mouse and rat orthologous gene, and differences in liver 1A2 mRNA expression. Mol Endocrinol. 1989;3:1399–1408. doi: 10.1210/mend-3-9-1399. [DOI] [PubMed] [Google Scholar]
- 18.Daly AK, Brockmöller J, Broly F, et al. Nomenclature for human CYP2D6 alleles. Pharmacogenetics. 1996;6:193–201. doi: 10.1097/00008571-199606000-00001. [DOI] [PubMed] [Google Scholar]