Abstract
Aims
To validate the use of randomly collected urine samples for assessment of cytochrome P4501A2 (CYP1A2) activity based on dietary caffeine (caffeine metabolic ratio, MRcaff), and to relate the MRcaff to caffeine intake and smoking habits in a larger group of individuals.
Methods
Nineteen healthy volunteers were included in the validation study. Caffeine (100 mg) was ingested and a urine sample was collected after 6 h. Within the following week a random urine sample was collected in the individuals without a preceding test dose of caffeine. Urine samples were analysed for caffeine and its metabolites by h.p.l.c. and the (AFMU+1U+1X)/1,7U metabolic ratio was used to reflect CYP1A2 activity. In an extended investigation of 522 healthy pregnant women the MRcaff was related to intake of caffeine from various sources, and to smoking.
Results
The results from the random and standardised sampling methods correlate with each other (correlation coefficient of MRcaff was 0.91). The MRcaff as assessed by the random sampling method in a larger population was not affected by source or amount of caffeine ingested. Significantly higher MRcaff was found in smokers compared to non-smokers. In the large group of individuals the random sampling method was possible to use in 80% of the cases. In the residual 20% one or several of the metabolite concentrations were too low or unmeasurable.
Conclusions
Our study demonstrates that the random urine caffeine phenotyping method is possible to use in as many as 80% of the individuals when based on dietary caffeine. Our approach should prove applicable in most countries with widely spread caffeine consumption. The method is useful in larger studies of drug metabolising enzyme activities and minimises the time consumption and costs.
Keywords: dietary caffeine, CYP1A2 activity, phenotyping, validation, metabolic ratio
Introduction
Cytochrome P450 (CYP) 1A2 is one of the major phase I enzymes in the liver, accounting for about 15% of the total liver P450 content [1]. This enzyme is important in the metabolism of widely used drugs such as theophylline [2, 3], clozapine [4, 5] and imipramine [6]. It is the most important catalyst in the metabolism of caffeine [2, 3, 7], and has been implicated in the bioactivation of carcinogenic substances such as aryl- and heterocyclic amines [8]. Therefore, it may be of clinical interest to assess the activity of CYP1A2 in panels of patients that have experienced certain adverse drug reactions or that have been subject to possible metabolic interactions at the level of CYP1A2.
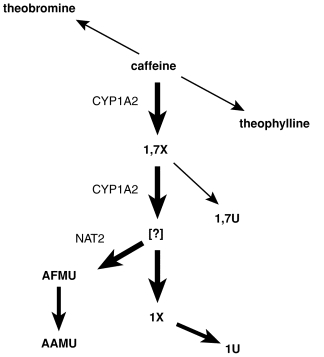
Caffeine (1,3,7-trimethylxanthine) is the probe drug of choice for assessment of CYP1A2 activity. It is extensively metabolised in man and at least 14 metabolites have been identified (Figure 1). About 80% of caffeine is N3-demethylated to paraxanthine (1,7X) and the major enzyme catalysing this reaction is CYP1A2 [2, 3, 7, 9]. 1,7X is further metabolised by CYP1A2 [2, 9] and other enzymes.
Figure 1.

Biotransformation pathways for caffeine. Thick arrows indicate the major pathways and abbreviations beside the arrows indicate enzymes. Abbreviations: 13X; theophylline (1,3-dimethylxanthine), 37X; theobromine(3,7-dimethylxanthine), 1,7X; 1,7-dimethylxanthine, 1,7U; 1,7-dimethyluric acid, 1X; 1-methylxanthine, 1U; 1-methyluric acid, AFMU, 5-acetylamino-6-formylamino-3-methyluracil, AAMU; 5-acetylamino-6-amino-3-methyluracil, NAT2; N-acetyltransferase 2.
Several studies have demonstrated a high correlation between the urinary ratio (5-acetylamino-6-formylamino-3-methyluracil (AFMU)+1-methyluric acid (1U)+1- methylxanthine (1X))/1,7-dimethyluric acid (1,7 U) and caffeine clearance [10–12]. Rostami-Hodjegan et al. [13] also state that the ratio covaries directly and quite closely with CYP1A2 activity. Studies using the (AFMU+1U+1X)/1,7U ratio have confirmed known characteristics of CYP1A2 such as inducibility by smoking, and inhibition in women using oral contraceptives [10, 14–16], indicating that this ratio reflects CYP1A2 activity.
Caffeine is widely used all over the world and major sources include coffee, tea and cola beverages. In Sweden the average daily consumption of caffeine is 300–400 mg (Swedish Food Administration).
We have investigated the possibility of using dietary caffeine as a probe agent since most individuals have a constant but irregular intake of caffeine. We have collected random urine samples from a series of healthy volunteers. The (AFMU+1U+1X)/1,7U urinary ratio (MRcaff) was used to assess the activity of CYP1A2. This approach was then validated against the conventional methodology with a standardised caffeine dose and urine sampling time. Using the random sampling method we related the MRcaff to intake of various caffeine sources and smoking in a large group of healthy individuals.
Methods
Subjects and study protocol
Validation of dietary caffeine and random urine sampling
Nineteen healthy individuals (males and females) with daily coffee or tea consumption were included. Caffeine (100 mg) was ingested and a urine sample, 10–12 ml in a tube containing 500 μl of 1 m HCl was collected after 6 h. The samples were frozen at −20° C until analysis. A random urine sample was collected from the same individuals during the following week without a preceding test dose of caffeine. The urine samples were collected without any record of last urination or the time since the last intake of caffeine. The study was approved by the Ethics Committee at Uppsala University.
Interindividual variation
Pregnant women, or women with a spontaneous abortion within 6–12 completed gestational weeks (n=522), were included in our study. These women were part of a large epidemiological study on risk factors for spontaneous abortions. After obtaining informed consent the women were subjected to an extensive face-to face interview performed by specially trained mid-wives. The interview included questions about drug treatment, intake of caffeine containing beverages, and smoking habits. A urine sample was collected as described earlier. The quantity of caffeine intake and smoking was estimated from data collected at the interview but information on the precise time interval between last exposure and urine collection was not obtained. The study was approved by the Ethics Committee at Uppsala University.
Intraindividual variability in metabolic ratio
Four female non-pregnant persons participated in this part. Urine samples were randomly collected twice daily during 3–5 days. All were non-smokers and one was on contraceptives. The time between last ingestion of caffeine containing beverages (coffee, tea or cola-beverages) and urine collection was recorded.
Chemicals and reagents
1,7-dimethylxanthine (1,7X), 1-methyluric acid (1U), 1-methylxanthine (1X), 1,7-dimethyluric acid (1,7U), caffeine and β-hydroxy-ethyltheophylline were purchased from Sigma (St Louis, MO, USA). 5-Acetylamino-6-formylamino-3-methyluracil (AFMU) was a generous gift from Dr E. Rey, Hospital Saint-Vincent-De-Paul (Paris, France) and Dr M. Kall, Roskilde University (Roskilde, Denmark). All other chemicals used were of analytical or h.p.l.c.-grade and were obtained from commercial sources.
Analysis of caffeine and its metabolites
Urine samples were analysed by a h.p.l.c. method according to Rasmussen & Brosen [17] with modifications. Unless otherwise stated all samples were kept on ice in order to prevent degradation of AFMU. One hundred μl of urine was added to 100 μl 300 μm β-hydroxy-ethyl theophylline (reference compound) in a glass tube and the total volume was adjusted to 400 μl with sodium acetate buffer (pH 3.0). Ethyl acetate/2-propanol (92:8 v/v) (5 ml) was added. The mixture was shaken vigorously for 10 min (4° C) and then centrifuged at 2000 rev min−1 for 10 min, at 4° C. The organic phase (4 ml) was transferred to a new glass tube and evaporated to dryness under a nitrogen stream at 40° C. The residue was reconstituted in 300 μl mobile phase (95:5 v/v acetate buffer:methanol) and vortexed for 10 s. One hundred μl was transferred to 0.5 ml plastic vials (Sarstedt), that were kept at 4° C until h.p.l.c. analysis. Forty μl were injected into the column.
Chromatography was performed using Beckman instruments; a 128 Solvent Module, a 166 Detector and an 507e Autosampler and a 7970 h.p.l.c. Column Heater (Jones Chromatography Ltd, AU). An Ultrasphere ODS column, 5 μm, 25 cm×4.6 mm (Beckman Instrument Inc., CA. USA) was used. The mobile phase consisted of 0.01 m sodium acetate buffer (adjusted to pH 3 with HClO4) and methanol in a gradient elution system (91:9 0–6 min; 85:15 6–11 min; 70:30 11–22 min; 91:9 22–30) with an increasing flow rate (1 ml min−1 0–11 min; 1.5 ml min−1, 11–19 min; 2.5 19–22 min; 1 ml min−1 22–30 min). The column temperature was 3°C. Compounds was detected by u.v. at 280 nm.
Identification of caffeine and its metabolites was made on the basis of retention times and areas under the curve of authentic standards.
The mean coefficients of variation of the analyses (CV) were 8.1%, 5.2%, 5.8%, 4.3% for AFMU, 1U, 1X and 1,7U, respectively at concentrations of 12.5, 25, 50, 150, 400 and 1,000 μm.
Data analysis
At interview different sources of caffeine were recorded, such as tea, chocolate, cola beverages and coffee. The daily mean caffeine intake was calculated according to Lelo et al. [18]. A standard brew of coffee was considered to contain 0.9 mg ml−1, tea 0.19 mg ml−1 and cola beverages about 0.13 mg ml−1 caffeine. Number of cups, the size of the cup and the average caffeine content in the respective type of drink were considered. Due to high variability in caffeine content in different brands of chocolate, concentration estimates were not considered to be meaningful. The information from the interview was extracted from the last week prior to urine collection.
The effect of smoking on the MRcaff was investigated by two-sided t-test. The effect of different sources on MRcaff was investigated by ANOVA. Probability values <0.05 were considered to indicate statistical significance.
Results
Validation of dietary caffeine and random urine sample
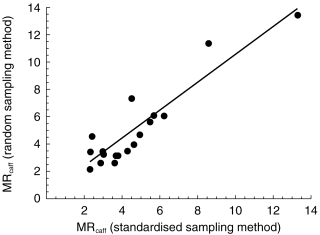
The MRcaff varied between 2.2–13.6 and 2.3–13.3 for the random and standardised sampling methods, respectively. The correlation coefficient was 0.91 (Figure 2).
Figure 2.

Correlation of urinary metabolic ratios (MRcaff) obtained by the standardised (100 mg caffeine and a urine sample after 6 h) and random sampling method (dietary caffeine and randomly collected urine sample). The correlation coefficient, r=0.91.
Intraindividual variability in metabolic ratio
The average MRcaff in the non-pregnant group of women was 4.1±1.6 (s.d.) over 3 to 5 days. The range of MRcaff in all four women varied between 2.2 and 10.4, with the majority between 3 and 6. The mean CV in these individuals was 28% (13, 17, 21 and 59).
Interindividual variability
One hundred and six out of 522 pregnant or aborting women in the epidemiological study had low and/or unmeasurable concentrations of caffeine metabolites. Six out of these women did not drink any caffeine containing beverages according to the interview.
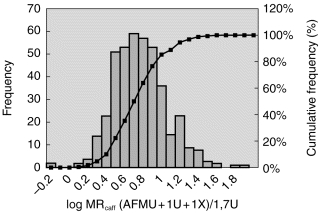
The MRcaffin the whole group of women (n=416) was log normal distributed with a 70-fold difference (0.48–76) between extremes (Figure 3). The average MRcaff of the whole group was 6.8 (±6.6 s.d.). No tendency of a bimodal distribution was observed when assessed by probit analysis.
Figure 3.

Frequency distribution of the urinary metabolic ratio, log MRcaff (AFMU+1U+1X)/1,7U in 416 women. Bars indicate no of individuals (left y-axis) in each MRcaff interval. The cumulative values may be read at the right y-axis.
To study the effect of various kinds of caffeine sources on CYP1A2 activity the group was divided according to intake (non-drinkers, coffee, cola beverages, tea, cola and coffee, chocolate, and mixed ingestion (tea and cola and/or coffee)). There was no statistically significant difference between groups of women with different dietary sources of caffeine. Nevertheless, there was a difference between the mean values of MRcaff in non-drinkers (4.2) and tea drinkers (7.8).
Among the 416 women with measurable metabolite concentrations used in the MRcaff there were 11 that claimed not to drink any caffeine. The mean MRcaff was 4.2 (±2.6 s.d.) in these individuals.
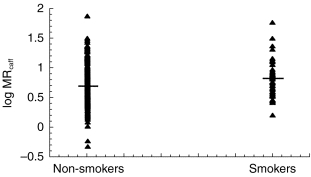
Forty-eight women were smokers (minimum 1–6 cigarettes/day last week prior to urine collection). The average MRcaffin these women was 8.9 (±9.7 s.d.) as compared with 6.5 (±6.1) in non-smoking women [95% CI: 0.49,4.44; P=0.15] (Figure 4).
Figure 4.

The log distribution of MRcaff in non-smokers and smokers. The mean values were 6.5 and 8.9. The difference in mean values between smokers and non-smokers was statistically significant (95% CI: 0.49–4.44; P=0.015).
The effect of the amount (mg) ingested caffeine on MRcaff was investigated. There was no tendency to higher or lower values with increasing caffeine intake.
Discussion
Our results show that random urine samples and MRcaff analysis based on dietary caffeine is possible to use for assessment of CYP1A2 activities in subjects with normal daily caffeine intake. This approach should be applicable in most countries with widely spread caffeine consumption.
In the group of 522 women we found that 20% had low or unmeasurable metabolite concentrations.
Although many of these women ingested caffeine according to the questionnaire the low or unmeasurable concentrations may be explained by long interval since last ingested caffeine or low intake of caffeine. Alternatively, their metabolic activity was extremely high. Interestingly, most of the subjects who claimed not to consume any caffeine containing beverages did not contribute to the group with unmeasurable metabolite concentrations. One hundred and twenty women in the group were studied also in the third trimester. In this group only 6% of these women had low or unmeasurable metabolite concentrations (unpublished). This is probably due to increasing caffeine intake towards the end of pregnancy.
There was no statistically significant difference between different caffeine sources. Selective users of tea had higher MRcaff than any other group although the difference was not statistically significant. We have no explanation for this.
The non-drinkers had lower mean MRcaff than the rest of the individuals, 4.2 against 6.9. It seems that even a small amount of caffeine could increase the MRcaff. This is consistent with finding in rats that caffeine may induce CYP1A2 [19–21].
Because the (AFMU+1U+1X)/1,7U ratio uses only metabolic end products of caffeine metabolism, the exact amount and time of urine collection are relatively unimportant as long as there is a sufficient time interval between intake and collection and the caffeine intake is large enough [14, 22]. The constant daily caffeine intake will lead to a ‘quasi steady state’ condition. Therefore, the observed results are theoretically justified since relative urinary recoveries of caffeine and metabolites for any random sample at steady state will largely reflect ratios observed at full urinary recoveries of these compounds following single dose administration.
The ratio was log normal distributed. This is consistent with data from other investigators [14, 17, 23]. At the actual dose levels of caffeine in our material, there was evidently no sign of dose-dependency. Such a dose-dependency has been shown previously [24, 25]. However, these authors compared different dose levels within the same individuals, which facilitates the detection of such kinetics.
The intraindividual variation of the MRcaff was studied in four subjects by repeated estimates over several days. The intraindividual variation of MRcaff is smaller than the interindividual variation. This supports the validity of our random sample estimates of the MRcaff on the basis of dietary caffeine. The variation could not be explained by differences in time interval between caffeine ingestion and sample collection. The variation in MRcaff in our material was similar to that of Kashuba et al. [26]. They have investigated intraindividual variability in CYP1A2 activity over a three-month period and the median CV was 16.8% (range 4.5–49.3%).
The average MRcaffin the whole group was 6.79, which is in the same range as reported before in the literature, 6.08–7.80 [14] and 8.18–13.21 [11]. The majority of values were within a range of 0.48 to 30, with only four individuals above this range. We did not find any evidence that the large variation is associated with amount of caffeine or intake of caffeine from different sources. Other dietary constituents, such as cruciferous vegetables might however affect the CYP1A2 activity and contribute to the variability [16].
CYP1A2 is known to be inducible by smoking [15, 27]. In agreement with this we found that smoking significantly enhances the MRcaffvalues. This is probably caused by polycyclic aromatic hydrocarbons present in cigarette smoke.
In summary, our study demonstrates the validity of phenotyping CYP1A2 on the basis of dietary caffeine and random sampling of urine. The ubiquity of caffeine in the diet obviates the need for administration of a standardised caffeine dose in at least 80% of subjects. This approach is useful in larger studies of drug metabolising enzyme activities and minimises the time consumption and costs.
Acknowledgments
This study was supported by International Epidemiology Institute (Rockville, USA) and the Swedish Medical Research Council (04496). We are grateful to all the healthy volunteers that participated in this study. We also acknowledge the careful interviews made by the midwives Margareta Aveskogh, Ragnhild Cnattingius and Ingela Wessén.
References
- 1.Shimada T, Yamazaki H, Mimura M, Inui Y, Guengerich PF. Interindividual variations in human liver cytochrome P-450 enzymes involved in the oxidation of drugs, carcinogens and toxic chemicals: studies with liver microsomes from 30 japanese and 30 caucasians. J Pharmacol Exp Ther. 1994;270:414–423. [PubMed] [Google Scholar]
- 2.Campbell ME, Grant DM, Inaba T, Kalow W. Biotransformation of caffeine, paraxanthine, theophylline, and theobromine by polycyclic aromatic hydrocarbon-inducible cytochrome(s) in human liver microsomes. Drug Metab Dispos. 1987;15:237–249. [PubMed] [Google Scholar]
- 3.Gu L, Gonzalez FJ, Kalow W, Tang BK. Biotransformation of caffeine, paraxanthine, theobromine and theophylline by cDNA-expressed human CYP1A2 and CYP2E1. Pharmacogenetics. 1992;2:73–77. doi: 10.1097/00008571-199204000-00004. [DOI] [PubMed] [Google Scholar]
- 4.Jerling M, Lindström L, Bondesson U, Bertilsson L. Fluvoxamine inhibition and carbamazepine induction of the metabolism of clozapine: evidence from a therapeutic drug monitoring service. Ther Drug Monitor. 1994;16:368–374. doi: 10.1097/00007691-199408000-00006. [DOI] [PubMed] [Google Scholar]
- 5.Bertilsson L, Carillo JA, Dahl M-L, et al. Clozapine disposition covaries with CYP1A2 activity determined by a caffeine test. Br J Clin Pharmacol. 1994;38:471–473. doi: 10.1111/j.1365-2125.1994.tb04385.x. [DOI] [PMC free article] [PubMed] [Google Scholar]
- 6.Lemoine A, Gautier JC, Azoulay D, et al. Major pathway of imipramine metabolism is catalysed by cytochromes P-450 1A2 and P-450 3A4 in human liver. Mol Pharmacol. 1993;43:827–832. [PubMed] [Google Scholar]
- 7.Berthou F, Flinois JP, Ratanasavanh D, Beanu P, Riche C, Guillouz A. Evidence for the involvement of several cytochromes P450 in the first steps of caffeine metabolism by human liver microsomes. Drug Metab Disp. 1991;19:561–567. [PubMed] [Google Scholar]
- 8.Eaton DL, Gallagher EP, Bammler TK, Kunze KL. Role of cytochrome P4501A2 in chemical carcinogenesis: implications for human variability and enzyme activity. Pharmacogenetics. 1995;5:259–274. doi: 10.1097/00008571-199510000-00001. [DOI] [PubMed] [Google Scholar]
- 9.Tassaneeyakul W, Mohamed Z, Birkett DJ, et al. Caffeine as a probe for human cytochromes P450: validation using cDNA-expression, immunoinhibition and microsomal kinetic and inhibitor techniques. Pharmacogenetics. 1992;2:173–183. doi: 10.1097/00008571-199208000-00004. [DOI] [PubMed] [Google Scholar]
- 10.Campbell ME, Spielberg SP, Kalow W. A urinary metabolite ratio that reflects systemic caffeine clearance. Clin Pharmacol Ther. 1987;42:157–165. doi: 10.1038/clpt.1987.126. [DOI] [PubMed] [Google Scholar]
- 11.Denaro CP, Wilson W, Jacob III P, Benowitz NL. Validation of urine caffeine metabolite ratios with use of stable isotope-labeled caffeine clearance. Clin Pharmacol Ther. 1996;59:284–296. doi: 10.1016/S0009-9236(96)80006-3. [DOI] [PubMed] [Google Scholar]
- 12.Rost KL, Roots I. Accelerated caffeine metabolism after ompeprazole treatment is indicated by urinary metabolite ratios: Coincidence with plasma clearance and breath test. Clin Pharmacol Ther. 1994;55:402–411. doi: 10.1038/clpt.1994.49. [DOI] [PubMed] [Google Scholar]
- 13.Rostami-Hodjegan A, Nurminen S, Jackson PR, Tucker GT. Caffeine urinary metabolite ratios as markers of enzyme activity: a theoretical assessment. Pharmacogenetics. 1996;6:121–149. doi: 10.1097/00008571-199604000-00001. [DOI] [PubMed] [Google Scholar]
- 14.Kalow W, Tang B-K. Use of caffeine metabolite ratios to explore CYP1A2 and xanthine oxidase activities. Clin Pharmacol Ther. 1991;50:508–519. doi: 10.1038/clpt.1991.176. [DOI] [PubMed] [Google Scholar]
- 15.Kalow W, Tang B-K. Caffeine as a metabolic probe: Exploration of the enzyme-inducing effect of cigarette smoking. Clin Pharmacol Ther. 1991;49:44–48. doi: 10.1038/clpt.1991.8. [DOI] [PubMed] [Google Scholar]
- 16.Vistisen K, Poulsen HE, Loft S. Foreign compound metabolism capacity in man measured from metabolites of dietary caffeine. Carcinogenesis. 1992;13:1561–1568. doi: 10.1093/carcin/13.9.1561. [DOI] [PubMed] [Google Scholar]
- 17.Rasmussen BB, Brosen K. Determination of urinary metabolites of caffeine for the assessment of cytochrome P4501A2, xanthine oxidase and N-acetyltransferase activity in humans. Ther Drug Monit. 1996;18:254–262. doi: 10.1097/00007691-199606000-00006. [DOI] [PubMed] [Google Scholar]
- 18.Lelo A, Miners JO, Robson R, Birkett DJ. Assessment of caffeine exposure: Caffeine content of beverages, caffeine intake, and plasma concentration of methylxanthines. Clin Pharmacol Ther. 1986;39:54–59. doi: 10.1038/clpt.1986.10. [DOI] [PubMed] [Google Scholar]
- 19.Ayalogu E, Snelling J, Lewis DFV, Talwar S, Clifford M, Ioannides C. Induction of hepatic CYP1A2 by the oral administration of caffeine to rats; lack of association with the Ah locus. Biochim Biophys Acta. 1995;1272:89–94. doi: 10.1016/0925-4439(95)00071-b. [DOI] [PubMed] [Google Scholar]
- 20.Goasduff T, Dréano Y, Guillois B, Ménez J-F, Berthou F. Induction of liver and kidney CYP1A1/1A2 by caffeine in rat. Biochem Pharmacol. 1996;52:1915–1919. doi: 10.1016/s0006-2952(96)00522-9. [DOI] [PubMed] [Google Scholar]
- 21.Chen L, Bondoc FY, Lee M-J, Hussin AH, Thomas PE, Yang CS. Caffeine induces cytochrome P4501A2: induction of CYP1A2 by tea in rats. Drug Metab Dispos. 1996;24:529–533. [PubMed] [Google Scholar]
- 22.Kalow W, Tang BK. The use of caffeine for enzyme assays: A critical appraisal. Clin Pharmacol Ther. 1993;53:503–514. doi: 10.1038/clpt.1993.63. [DOI] [PubMed] [Google Scholar]
- 23.Schrenk D, Brockmeier D, Mörike K, Bock KW, Eichelbaum M. A distribution study of CYP1A2 phenotypes among smokers and non-smokers in a cohort of healthy Caucasian volunteers. Eur J Clin Pharmacol. 1998;53:361–367. doi: 10.1007/s002280050394. [DOI] [PubMed] [Google Scholar]
- 24.Denaro CP, Brown CR, Wilson M, Jacob III P, Benowitz NL. Dose-dependency of caffeine metabolism with repeated dosing. Clin Pharmacol Ther. 1990;48:277–285. doi: 10.1038/clpt.1990.150. [DOI] [PubMed] [Google Scholar]
- 25.Cheng WS, Murhy TL, Smith MT, Cooksley WG, Halliday JW, Powell LW. Dose-dependent pharmacokinetics of caffeine in humans: relevance as a test of quantitative liver function. Clin Pharmacol Ther. 1990;47:516–524. doi: 10.1038/clpt.1990.66. [DOI] [PubMed] [Google Scholar]
- 26.Kashuba ADM, Bertino JS, Kearns GL, et al. Quantitation of three-month intraindividual variability and influence of sex and menstrual cycle phase on CYP1A2, N-acetyltransferase-2, and xanthine oxidase activity determined with caffeine phenotyping. Clin Pharmacol Ther. 1998;63:540–551. doi: 10.1016/S0009-9236(98)90105-9. [DOI] [PubMed] [Google Scholar]
- 27.Parsons WD, Neims AH. Effect of smoking on caffeine clearance. Clin Pharmacol Ther. 1978;24:40–45. doi: 10.1002/cpt197824140. [DOI] [PubMed] [Google Scholar]


