Abstract
Aims
To model the pharmacokinetic profiles of alpha interferon (αIFN) after a single subcutaneous (s.c.) injection of 3 million units of alpha 2b interferon, to correlate the pharmacokinetic parameters with patient demographic covariates, and to develop a limiting sampling strategy for determining the αIFN plasma area under the curve of concentration vs time (AUC).
Methods
The plasma αIFN pharmacokinetics were determined in 27 patients with chronic hepatitis C virus infection after the first s.c. injection of the drug. Ten patients had normal renal function and 17 were chronic haemodialysis patients. Plasma samples were assayed by an Elisa method. Concentration-time data was analysed by a population approach using NONMEM.
Results
The pharmacokinetic model which better described the concentration vs time data was a one-compartment model with two processes of absorption: a zero-order followed by a first-order process. The mean clearance of dialysis patients represented 37% (with 95% confidence interval: 30%–44%) of the mean value of the patients with normal renal function. The volume of distribution was significantly correlated to the body surface area. Bayesian analysis using NONMEM allowed determination of the individual plasma AUC from three samples within the 24 h period post s.c. injection.
Conclusions
The present pharmacokinetic model will allow one to obtain individual parameters such as, the area under the curve of concentration vs time from a limited-sampling strategy, and to perform pharmacokinetic-pharmacodynamic analysis of combined αIFN plasma concentrations and viraemic data.
Keywords: alpha interferon, haemodialysis patients, limited sampling strategy, population pharmacokinetics
Introduction
Alpha interferon (αIFN) is a major cytokine for the treatment of a variety of diseases, including chronic hepatitis B and C [1]. Several pharmacokinetic studies of αIFN have previously been performed in healthy volunteers [2, 3], and in patients with malignancies or other diseases [4–8]. As for other recombinant cytokines, no specific pharmacokinetic model was used for fitting the αIFN plasma concentrations after intramuscular or subcutaneous (s.c.) administration. Indeed, for most of the studies, the pharmacokinetic parameters such as the area under the plasma concentrations vs time curve (AUC) were obtained by model-independent analysis. Except for one study [3], a one-compartment model with a zero order absorption was used to evaluate the half-lives of absorption and elimination, but no comment was made on the quality of fit; particularly, were concentration-time data during the absorption phase adequately fitted? However, characterization of αIFN pharmacokinetics, i.e. determination of the pharmacokinetic structural model and parameter estimates, is required in several circumstances such as design of optimal sampling strategies with minimum inconvenience for the patients, and pharmacokinetic/pharmacodynamic (PK/PD) studies. We conducted a population pharmacokinetic analysis of plasma concentrations of αIFN given by s.c. administration using the NONMEM (non linear mixed-effects model) computer program [9], which allows the treatment of the population rather than the individual as the unit of analysis. The pharmacokinetic (PK) structural model was developed from the data of 27 patients. Twenty of them have been studied within a controlled trial which showed that the αIFN AUC (obtained by model-independent analysis) measured in the group of 10 patients with normal renal function was about 50% of that obtained in 10 dialysis patients [10]. In the present study, quantitative relationships between pharmacokinetic parameters, clearance and volume of distribution, and other demographic covariates were investigated. Lastly, in order to illustrate the usefulness of the model, the ability to determine accurately the plasma αIFN exposure (i.e. the AUC) from a limited number of samples was tested. Limited sampling strategy using NONMEM was previously proposed for other drugs [11, 12].
Methods
Characteristics of patients
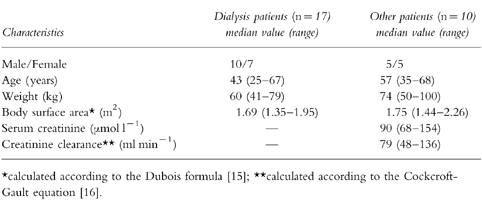
The 27 patients who entered into this study had chronic hepatitis C virus infection indicated by positive HCV serology as well as positive HCV viraemia and features of chronic active hepatitis on liver biopsy. Ten patients had a normal renal function, and 17 patients had chronic renal failure requiring chronic haemodialysis for more than 4 years. Informed written consent was obtained from all patients before entering them into the pharmacokinetic study approved by the regional ethics committee of Toulouse. The characteristics of the patients are summarized in Table 1.
Table 1.
Characteristics of the 27 Patients Studied.
Alpha interferon-2b administration, blood sampling protocol, and plasma αIFN assay
The patients were given a treatment of alpha interferon-2b (INTRON A, Schering Plough, Kenilworwh, NJ) of 3×10⁶ units (15 000 ng) administered subcutaneously (s.c.) 3 times a week; the therapy was scheduled for 1 year. The PK study of αIFN was performed at the time of the first injection. In dialysis patients, the first injection was given 8 h after the completion of the last dialysis session. Venous blood (5 ml) was drawn in nonheparinized vacutainer tubes immediately before the first s.c. injection of alpha interferon-2b and then 1, 2, 3, 4, 6, 8, 12, 16, 20, 24, 28, and 32 h after the injection. In dialysis patients, the dialysis session subsequent to the first injection of alpha interferon-2b never occurred before the last blood sample was taken. Blood samples were immediately centrifuged. Plasma was removed and immediately frozen at −80° C and maintained in the frozen state until analysed. Plasma αIFN concentrations were determined by human ELISA test (ENDOGEN, Cambridge, MA, USA). The procedure followed the instructions of the manufacturer. All samples were analysed in duplicate and the mean value was considered. The lower limit of detection and the limit of quantification were <3 pg ml−1 and 4.1 pg ml−1, respectively. The interassay (n=6) coefficient of variation for precision ranged between 6% (standard sample of 160 pg ml−1) and 13% (standard sample of 4.1 pg ml−1). Quality control samples showed intra- and interassay coefficients of variation lower than 10%. Samples obtained before the alpha interferon-2b injection were below the limit of quantification for all patients suggesting that endogeneous interferons do not interfer significantly with the pharmacokinetic study.
Pharmacokinetic analysis
Plasma αIFN levels were analysed using the programme NONMEM [13] (version IV, level 1.1) and the PREDPP package [14] running on PC computer. A proportional error model was used for the interpatient variabilities. Preliminary testing of combination model (i.e. additive plus proportional) for residual variability led to negligible value for the additional term. Then, a proportional model was used for residual variability. Five alternative structural models for absorption from the depot-compartment (e.g. site of subcutaneous injection) to the central compartment were tested:
zero-order absorption (according to a duration: tk0),
first-order absorption (according to a rate constant for absorption: ka) without lag time,
first-order absorption with a lag time,
combined zero-(which concerns a fraction of the total dose: FZ; and according to a duration: tk0) and first-order absorption (according to a rate constant for absorption, ka) both starting at time 0,
zero-order absorption immediately followed by a first-order absorption.
The parameters tk0, ka, lag time, and FZ were computed and allowed to vary from one patient to another. One-and two-compartment models were also compared. The influence of eight patient covariates (dialysis status, serum creatinine, weight, height, body surface area calculated according to the Dubois formula [15], sex, age, and creatinine clearance (CLcr) calculated according to the Cockcroft-Gault equation [16]) on the pharmacokinetic parameters was tested. In fitting the data, NONMEM computed the value of a statistical function, the minimal value of the objective function, which is equal to minus twice the log likelihood. Both structural model selection, and the testing of the relationships between covariates and pharmacokinetic parameters were based on the objective function value. The selected structural model was that which gave the lowest value of the objective function. If two models gave the same or similar values then the most parsimonious model should be chosen. For testing of the covariates, the different models were compared using the approximation to the chi squared distribution of the objective function value of the reduced model (e.g. model without covariate) minus that of the full model (e.g. model with covariate); the number of degrees of freedom is equal to the difference in the number of parameters between two nested models. For example: a difference in the objective function larger than 3.8 (associated with a P value of <0.05 and d.f. of 1) was required to consider the model where clearance/F (bioavailability-scaled parameter) was expressed as a function of the renal status (CL/F=θ1. (1−θ2.DIA) with DIA=1, or=0 if the patient was a dialysis patient, or (not) more appropriate than the model where CL/F was independant of DIA (CL/F=θ1).
Development of a limited sampling strategy (LSS) to estimate αIFN plasma AUC
Six schedules of two to five samples within the 24 h period after the αIFN administration were compared: 2–4–8–12–20, 2–4–8–20, 2–8–20, 2–8, 8–20, and 2–20 h after the injection. The 20 h value was selected rather than the 24 h concentration value because concentrations at 24 h after the injection were below the limit of quantification for several patients with normal renal function. The schedules tested for LSS were arbitrarily selected according to both the concentration vs time profile (e.g. 8 h sample was retained since it corresponded to the maximum plasma concentrations for most of the patients) and practical considerations (e.g. 16 h sample was excluded since it is nocturnal). For seven patients randomly selected, the individual AUCs obtained by empirical Bayesian estimation using the NONMEM programme (POSTHOC option, and the final structural and covariate models as described in the Results section) and the limited number of plasma concentrations corresponding to each schedule were compared to the ‘actual’ AUC. The actual AUC was obtained individually using all data points by linear trapezoidal rule up to the last measured concentration and extrapolation to infinite time by using the rate constant for the terminal phase (SIPHAR program, Simed, France). The relative prediction error, pej%, for AUC is defined as follows:
 |
where AUCLSS is the empirical Bayesian estimate of AUC for patient j, and AUC is the actual AUC. Predictive performance of empirical Bayesian estimations using the various schedules was evaluated by computing the mean relative prediction error as a measure of bias and the root mean squared relative prediction error as an assessment of precision [17].
Results
Structural and covariate models
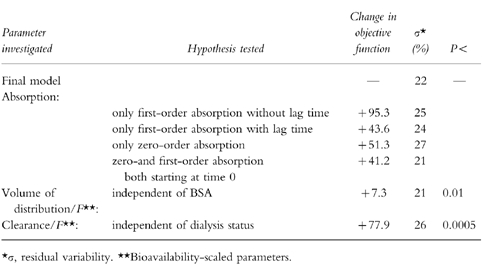
In a first step, the different structural models were compared without any covariate. By using the objective function as criterium, the one-compartment model with a zero-order absorption immediately followed by a first-order absorption (Figure 1) fitted the data significantly better than the other one-compartment models (i.e. with zero-or first-order absorption with or without a lag time, and combined zero-and first-order absorption both starting at time 0). The fit of the two-compartment model was not significantly better than that of the one-compartment model. Then, the screening test of the influences of the seven covariates on clearance (CL/F) and volume of distribution (V/F) were performed with the one-compartment model combining the two absorption processes. CL/F was significantly correlated with dialysis status (CL/F=θ1. (1−θ2.DIA) with DIA=1, or=0 if the patient was a dialysis patient), and to the creatinine clearance (CL/F=θ1. (1+θ2.CLcr) with CLcr=0 if the patient was a dialysis patient) with a difference in the objective function of 77.9 and 77.3, respectively. Testing of the model combining the two covariates (CL/F=θ1. (1−θ2.DIA). (1+θ3.CLcr)) showed that one of the covariates was redundant (deletion of CLcr led to a difference in objective function of 1.3); then, dialysis status was retained as the only covariate on CL/F: CL/F=θ1. (1−θ2.DIA); the mean value (95% confidence interval) was 36.5 l h−1 (30.3–42.7) and 0.638 (0.568–0.708) for θ1 and θ2, respectively. V/F was significantly correlated with the body weight, but the correlation was better with the body surface area. It has been previously shown that the choice of structural pharmacokinetic model can be affected as much by the covariate model (as the choice of covariate model can be affected by the structural model) [18]. Then, in order to make sure that the structural model was not affected by the covariate model, comparisons between the different structural models of absorption were performed with a covariate model on CL/F and V/F. Table 2 summarizes the final results of the NONMEM analysis. The final model combining the two processes of absorption remained justified not only regarding the objective function, but also by taking into account the residual error (σ). The residual error (which is dependent among other sources on assay error and model misspecification) was lower for the final model than those of the other structural models (with the exception of the model combining simultaneously the two processes of absorption). The AUC of the 27 patients obtained by Bayesian estimation using NONMEM and the full concentration-time profile were similar to those obtained by the trapezoidal rule: mean value of 893 and 879 pg ml−1 h, repectively, with a bias of −0.6% (95% confidence interval: −2.7%−+1.6%) and precision of 5.3%. The percentage extrapolation of AUC using the trapezoidal rule ranged between 4 and 26% (mean: 11%).
Figure 1.
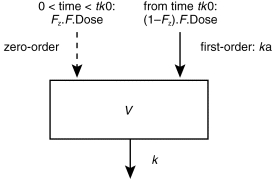
One compartment model with zero-order absorption (which involves a fraction of the total bioavailable dose (F.Dose): FZ; and for a duration: tk0) immediately followed by a first-order absorption (according to a rate constant for absorption, ka) from the subcutaneous injection site. V and k represent the volume of the compartment and the rate constant for drug elimination.
Table 2.
Testing of the final model: one-compartment model with a zero-order absorption immediately followed by a first-order absorption, volume of distribution proportional to body surface area, and clearance dependent on dialysis status.
Pharmacokinetic parameters
The mean pharmacokinetic parameters for the final model and their interindividual variabilities are shown in Table 3. The 95% confidence interval assigned to the mean pharmacokinetic parameters, the coefficient allocated to significant covariates, and interpatient variabilities are also stated. A typical curve of the αIFN concentrations vs time is shown in Figure 2.
Table 3.
Pharmacokinetic parameters of alpha interferon.
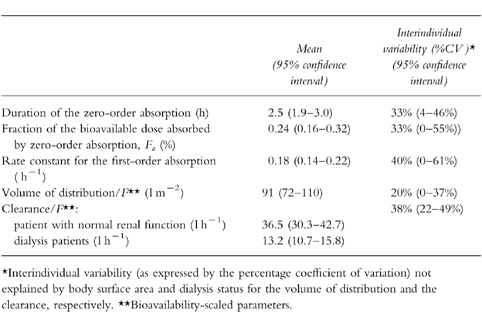
Figure 2.
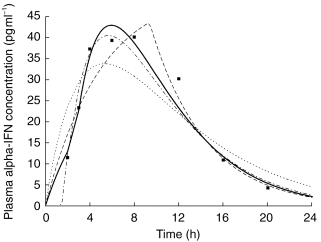
Plasma concentrations of alpha interferon given subcutaneously in one subject. Curves corresponding to the final model (one-compartment model with an absorption according to a zero-order process immediately followed by a first-order process) and alternative models for absorption are shown. The curve corresponding to combined zero-and first-order processes both starting from time 0 is not presented for clarity. ▪ observed concentration,— final model, ——— zero-order absorption, —•— first-order absorption with lag time, ··· first-order absorption without lag time.
Performance of the LSS
Among the seven patients randomly selected, five were dialysis patients and two had a normal renal function. Bias and precision of AUC with four of the six tested schedules are given in Table 4. Three sampling times, and two sampling times at 8 and 20 h after the injection, allowed one to determine the plasma AUC with an accuracy similar to that of the full sampling times. Comparison of AUC as determined by the trapezoidal rule and empirical Bayesian estimation using the schedule with two sampling times (8, and 20 h after the injection) and the final model is represented in Figure 3.
Table 4.
Predictive performance of empirical Bayesian estimation of alpha interferon area under the plasma curve (AUC) with different sampling schedules tested with the data from seven patients.
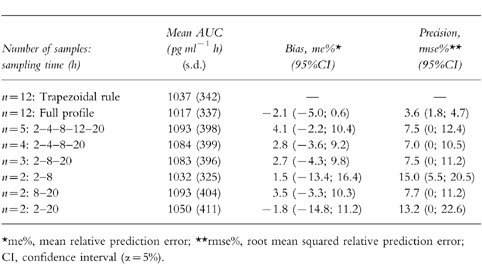
Figure 3.
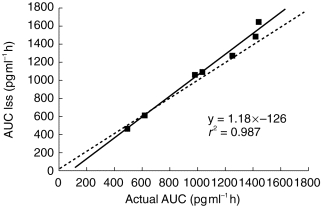
Correlation between area under the plasma concentrations vs time curve of alpha interferon obtained by a limited sampling strategy (i.e. two sampling times at 8, and 20 h after the subcutaneous injection) using NONMEM and actual values in seven patients. The line of identity (———) and the linear regression line (—) are shown.
Discussion
Several pharmacokinetic studies have been carried out on αIFN, but to the best of our knowledge, the present study represents the first time that plasma concentrations obtained after s.c. administration of αIFN have been analysed with a pharmacokinetic population approach. Therefore, by combining data from 27 patients, it was possible to obtain a structural pharmacokinetic model which fitted the concentration-time data better than the conventional absorption model (e.g. first-order absorption) even if a lag time was considered. Besides, a lag time for absorption (a mean value of 0.42 h was obtained) is less probable after subcutaneous injection than it is after oral administration. The two processes of absorption (zero-order process immediately followed by a first-order process) could present a pharmacological rationale in the case of αIFN. The drug is a recombinant cytokine for which pharmacokinetics may involve carrier-mediated membrane transport. Saturability of active transport may lead to a zero-order process of absorption just after the subcutaneous injection when the local αIFN concentrations are high. At the time when the concentrations become lower than the Michaelis-Menten constant (plasma concentration at which half of the maximal rate is reached) corresponding to the active transport, the absorption tends to be a first-order process. But for most of the patients, as illustrated by Figure 2, the absorption rate corresponding to the zero-order process was lower than that during the first-order absorption phase (which was calculated by multiplying ka and the amount of drug not absorbed at the end of the zero-order process), which means that the previous pharmacological hypothesis is not acceptable. The model combining the two processes of absorption both starting from time zero has been previously proposed in case of s.c. administration of drug in suspension: the first-order absorption concerned the fraction of the dose in solution and the dissolution process of the drug represented the limiting factor of absorption of the remaining fraction [19]. In the present study, precipation of αIFN is not likely to occur. Moreover, the model of absorption with the two processes simultaneously led to a worse fit to the data than the final model. Finally, from the present analysis it would be hazardous to decide on the mechanism by which the drug is absorbed from the available plasma data.
The mean value for the rate constant for absorption (ka=0.18 h−1) was similar to the mean rate constant for elimination (calculated by the ratio CL/V: k=0.08 h−1 and 0.23 h−1 in, respectively, dialysis patients and patients with normal renal function). These values are very consistent with the values of 0.13 h−1 for ka and 0.24 h−1 for k observed by Radwanski et al. [3] after s.c. injection of αIFN. All the results confirm that αIFN is absorbed slowly after subcutaneous administration and that terminal decay is largely influenced by the absorption process. Protracted absorption of αIFN after s.c. and intramuscular administration was previously shown by comparing their plasma concentration vs time profile with that obtained after intravenous injection [20]. Indeed, after intravenous injection, the elimination half-life is about 1.7–1.9 h [3, 7]. Moreover, these observations confirm that model misspecification of the absorption process of αIFN would lead to poor adjustment of concentration vs time data even during the decline phase.
The lack of benefit of using a two-compartment model was likely to occur since the first sampling time was 1 h postinjection, and the rate of absorption was low.
One of the advantages of the pharmacokinetic population approach using NONMEM over the more traditional methods (e.g. two-stage approach consisting of the subject-by-subject determination of the pharmacokinetic parameters, and then the investigation of the correlation between covariates and pharmacokinetic parameters) is to investigate more efficiently quantitative relationships between pharmacokinetic parameters and pathophysiological features within a single step. In our previous analysis of the pharmacokinetic data of the first 20 patients, impact of the dialysis status on the elimination of αIFN was evaluated by comparing the mean trapezoidal AUC of the 10 dialysis patients and that of the 10 patients with normal renal function: the difference was highly significant with a mean AUC in the dialysis patients 1.9 fold larger than the mean value of the other group [10]. This result was confirmed by the NONMEM analysis performed with the data of 27 patients, but a larger ratio (i.e. 2.8) between the mean values from the two groups was obtained. Moreover, the population approach allowed one to assign relatively narrow 95% confidence intervals to mean αIFN clearance: 10.7–15.8 l h−1, and 30.3–42.7 l h−1 for, respectively, dialysis patients and patients with normal renal function. The CL of αIFN was also significantly correlated to the calculated creatinine clearance. This covariate will likely be a relevant covariate for the larger scale study that we plan to perform with more patients having intermediate renal functions. A weak but significant correlation between the volume of distribution and the body surface area was obtained.
Limited sampling strategies can be developed either from model-independant analysis using multiple linear regression or Bayesian estimation in conjunction with population pharmacokinetic methods. In a recent study [21], optimal sampling design coupled empirical Bayesian estimation performed significantly better than a model- independent method. The use of a pharmacokinetic model which accurately fitted the concentration-time data allowed us to develop a LSS. From three samples obtained 2, 8, and 20 h after the αIFN administration, it was possible to obtain precise and unbiased individual plasma AUC estimates in seven randomly selected patients. The schedule with two samples at 8, and 20 h had similar performance, but those with samples at 2–20 h, and 2–8 h were less precise. But, since the LSS schedule was derived from the dataset used to derive the pharmacokinetic model, prospective evaluation of this LSS is still needed. Then, practical sampling schedules could be applied for the next pharmacokinetic studies of αIFN.
Finally, the pharmacokinetic model we developed could be useful to perform simultaneous analysis of concentration-time data and pharmacodynamic data (e.g. viraemia levels).
Acknowledgments
The authors thank Dr Christian Laveille for his help in the population analysis and Miss Jilly Walsh for language assistance.
References
- 1.Hoofnagle JH, Lau D. Chronic viral hepatitis. Benefits of current therapies. N Engl J Med. 1996;334:1470–1471. doi: 10.1056/NEJM199605303342210. [DOI] [PubMed] [Google Scholar]
- 2.Wills RJ, Dennis S, Spiegel HE, Gibson DN, Nadler PI. Interferon kinetics and adverse reactions after intravenous, intramuscular, and subcutaneous injection. Clin Pharmacol Ther. 1984;35:722–727. doi: 10.1038/clpt.1984.101. [DOI] [PubMed] [Google Scholar]
- 3.Radwanski E, Perentesis G, Jacobs S, et al. Pharmacokinetics of interferon a-2b in healthy volunteers. J Clin Pharmacol. 1987;27:432–435. doi: 10.1002/j.1552-4604.1987.tb03044.x. [DOI] [PubMed] [Google Scholar]
- 4.Quesada GR, Gutterman JU. Clinical study of recombinant DNA-produced leucocyte interferon (clone A) in a intermittant schedule in cancer patients. J Natl Cancer Inst. 1983;70:1041–1046. [PubMed] [Google Scholar]
- 5.Budd GT, Bukowski RM, Miketo L, Yen-Lieberman B, Proffit MR. Phase-I trial of ultrapureTM human leukocyte interferon in human malignancy. Cancer Chemoth Pharmacol. 1984;12:39–42. doi: 10.1007/BF00255907. [DOI] [PubMed] [Google Scholar]
- 6.Gutterman JU, Seymour F, Queseda J, et al. Recombinant leucocyte A interferon: Pharmacokinetics, single-dose tolerance, and biologic effects in cancer patients. Ann Intern Med. 1982;96:549–556. doi: 10.7326/0003-4819-96-5-549. [DOI] [PubMed] [Google Scholar]
- 7.Smith RA, Norris F, Palmer D, Bernhard L, Will RJ. Distribution of alpha interferon in serum and cerebrospinal fluid after systemic administration. Clin Pharmacol Ther. 1995;37:85–88. doi: 10.1038/clpt.1985.16. [DOI] [PubMed] [Google Scholar]
- 8.Lam NP, Pitrak D, Speralakis R, Lau AH, Layden TJ. Effect of obesity on pharmacokinetics and biologic effect of interpheron-alpha in hepatitis C. Dig Dis Sci. 1997;42:178–185. doi: 10.1023/a:1018865928308. [DOI] [PubMed] [Google Scholar]
- 9.Beal SL, Sheiner LB. Methodology of population pharmacokinetics. In: Garrett ERHirtz J, editor. Drug Fate and Metabolism. Vol. 5. New York, NY: Marcel Decker; 1985. pp. 135–183. [Google Scholar]
- 10.Rostaing L, Chatelut E, Payen JL, et al. Pharmacokinetics of alpha interferon 2b in chronic hepatitis C virus patients, undergoing chronic hemodialysis or with normal renal function: clinical implications. J Am Soc Nephrol. 1998;9:2344–2348. doi: 10.1681/ASN.V9122344. [DOI] [PubMed] [Google Scholar]
- 11.Maitre PO, Bührer M, Thompson D, Stanski DR. A three-step approach combining bayesian regression and NONMEM population analysis: application to midazolam. J Pharmacokin Biopharm. 1991;19:377–384. doi: 10.1007/BF01061662. [DOI] [PubMed] [Google Scholar]
- 12.Baille P, Bruno R, Schellens JHM, et al. Optimal sampling strategies for bayesian estimation of docetaxel (Taxotere) clearance. Clin Cancer Res. 1997;3:1535–1538. [PubMed] [Google Scholar]
- 13.Boeckmann AJ, Sheiner LB, Beal SL. NONMEM users guides. introductory guide. 1992. Technical Report of the Division of Clinical Pharmacology, University of California, San Francisco part V.
- 14.Beal SL, Boeckmann AJ, Sheiner LB. NONMEM users guides, introductory guide. 1992. Technical Report of the Division of Clinical Pharmacology, University of California, San Francisco Part VI.
- 15.Dubois D, Dubois EF. A formula to estimate the approximate surface area if height and weight be known. Arch Intern Med. 1916;17:863–871. [Google Scholar]
- 16.Cockcroft DW, Gault MH. Prediction of creatinine clearance from serum creatinine. Nephron. 1976;16:31–41. doi: 10.1159/000180580. [DOI] [PubMed] [Google Scholar]
- 17.Sheiner LB, Beal SL. Some suggestions for measuring predictive performance. J Pharmacokinet Biopharm. 1981;9:503–512. doi: 10.1007/BF01060893. [DOI] [PubMed] [Google Scholar]
- 18.Wade JR, Beal SL, Sambol NC. Interaction between structural, statistical, and covariate models in population pharmacokinetic analysis. J Pharmacokin Biopharm. 1994;22:165–177. doi: 10.1007/BF02353542. [DOI] [PubMed] [Google Scholar]
- 19.Wagner JG, Nelson E. Kinetic analysis of blood levels and urinary excretion in the absorptive phase after single doses of drug. J Pharm Sci. 1964;53:1392–1403. doi: 10.1002/jps.2600531126. [DOI] [PubMed] [Google Scholar]
- 20.Wills RJ. Clinical pharmacokinetics of interferons. Clin Pharmacokinet. 1990;19:390–399. doi: 10.2165/00003088-199019050-00003. [DOI] [PubMed] [Google Scholar]
- 21.Jodrell DI, Murray LS, Hawtof J, Graham MA, Egorin MJ. A comparison of methods for limited-sampling strategy design using data from a phase I trial of the anthrapyrazole DuP-941. Cancer Chemoth Pharmacol. 1996;37:356–362. doi: 10.1007/s002800050397. [DOI] [PubMed] [Google Scholar]


