

Abstract
Aims
To clarify how troglitazone, an insulin-sensitizing agent, affects lipid metabolism and postheparin plasma lipoprotein lipase (LPL).
Methods
Fifteen patients (3 male, 12 female) (the average age 62±7 years; the mean body mass index (BMI) 25±3 kg/m2) were recruited for this study. The serum lipids and postheparin plasma lipoprotein lipase (LPL) mass before and 4 weeks after oral administration of troglitazone (200 mg day−1) were measured. A mouse preadipocyte cell line, 3T3-L1, was incubated with troglitazone and LPL enzyme protein mass in the culture media was measured by an enzyme linked immunosorbent assay. A reverse transcription polymerase chain reaction (RT-PCR) using primers specific for the carboxyl terminal 135 amino acid of mouse LPL cDNA was used to evaluate the effect of troglitazone on expression of LPL and Northern blot analysis carried out to determine expression of LPL.
Results
The average levels before treatment of fasting serum total cholesterol, triglycerides, high density lipoprotein cholesterol, plasma glucose and glycohaemoglobin A1c were 5.6±0.9, 1.8±1.0, 1.5±0.5, 8.1±1.7 mmol l−1 and 7.8±1.6% respectively. Four weeks after treatment, those levels were 5.4±0.9, 1.2±0.3 (P=0.004), 1.6±0.5 (P=0.02) mmol l−1, 7.7±2.3 mmol l−1 and 7.3±0.6% (P=0.01), respectively. The postheparin plasma LPL mass increased from 226±39 to 257±68 ng ml−1 (P=0.03) during that period. The LPL mass in the media of 3T3 L1 cells cultured in the presence of 10, 20 or 30 μm of this compound increased in a dose dependent manner. RT-PCR revealed that the area of the bands of the RT-PCR products on 1.5% agarose gel analyzed with NIH image from the cell extracts cultured in the presence of 10 μm troglitazone was significantly larger (P=0.0069) than that in the absence of this compound. Northern blot analysis revealed that in the cultured 3T3-L1 cells, the expression of LPL was enhanced in the presence of 10 μm troglitazone.
Conclusions
Troglitazone improves plasma triglyceride-rich lipoproteins metabolism by enhancing the expression of LPL in adipocytes.
Keywords: troglitazone, lipoprotein lipase, 3T3-L1 cells, insulin
Introduction
Troglitazone, a thiazolidinedione derivative, is a novel oral antidiabetic agent that lowers plasma glucose levels and enhances insulin action in obese animals [1]. It is effective in lowering plasma glucose, reducing hyperinsulinaemia, and correcting glucose metabolism in animal models of obesity and NIDDM as well as improving insulin sensitivity in cultured cells [2–5]. Ciaraldi et al. [6] demonstrated that troglitazone increases peripheral insulin binding capacity with a subsequent increase in insulin-stimulated glucose uptake. Szalkowski et al. [7] proposed that a possible mechanism by which this compound improves insulin sensitivity is by preventing the inhibitory effect of tumor necrosis factor (TNF-α) on adipocytes and enhancement of expression of CCAAT/enhancer-binding protein (C/EBP) and glucose transporter isoform 4 (GLUT4). More recently it was demonstrated that a thiazolidinedione derivative BRL49653 is a strong ligand for peroxisome proliferator-activated receptor-γ (PPAR-γ), which is known to play an important role in adipocyte differentiation [8].
Lipoprotein lipase (LPL) is a lipolytic enzyme which catalyzes the hydrolysis of triglycerides in chylomicrons and very low density lipoproteins (VLDL). This enzyme is well known to be regulated by insulin both transcriptionally [9] and posttranscriptionally [10]. Thus, in the situation of insulin resistance, the LPL activity is lowered, leading to hypertriglyceridaemia and hypoalphalipoproteinaemia. Since adipose tissue is one of the target tissues for insulin and plays an important role in producing LPL, experiments with a preadipocyte cell line, 3T3-L1, provide useful information regarding the effect of insulin action on LPL.
In this paper, we report the effect of troglitazone, which enhances insulin action, on plasma lipid metabolism in patients with hyperlipidaemia and diabetes mellitus and describe studies on the possible mechanisms involved in the lowering of plasma triglycerides from the aspect of LPL using a mouse preadipocyte cell line, 3T3-L1.
Methods
Subjects
Fifteen patients (3 men, 12 women) aged 50 to 75 (mean age: 62±6.9 years) with hyperlipidaemia and NIDDM were recruited for the study. The mean body mass index of the subjects was 25±2.9 kg/m2. The average levels of fasting plasma total cholesterol (TC), triglycerides (TG), high density lipoprotein-cholesterol (HDL-C), glucose and glycohaemoglobin (Hb) A1c were 5.6±0.9, 1.8±1.0, 1.5±0.5, 8.1±1.7 mmol l−1 and 7.8±1.6%, respectively. Patients with liver disease, kidney disease, renal disease, and hormonal disease were excluded from this study. Patients with familial lipoprotein lipase deficiency, familial hypercholesterolaemia, or type V hyperlipidaemia were also excluded.
All of the 15 subjects received 200 mg troglitazone once a day. Four weeks after the start of treatment, levels of plasma glucose and lipids were evaluated. Five additional subjects [(2 men, 3 women) aged 49 to 63 (mean age: 57±5.6 years), the mean body mass index: 24.5±1.3 kg/m2] with hyperlipidaemia and NIDDM were also recruited as control subjects who were not given troglitazone. The average levels of fasting plasma TC, TG, HDL-C, glucose and HbA1c were 5.8±0.9, 1.8±0.5, 1.1±0.2, 7.1±0.9 mmol l−1 and 7.5±0.5%, respectively. None of the subjects was under treatment with anti-lipid medication but five of the troglitazone group and two of the control group received glibenclamide for treatment of diabetes.
Cell culture of 3T3-L1
Troglitazone ((±)-5-[4-(6-hydroxy-2, 5, 7, 8-tetramethylchroman-2-yl-methoxy) benzyl]-2-4-thiazolidinedione) was provided by Sankyo Co Ltd (Tokyo). A mouse preadipocyte cell line, 3T3 L1, was obtained from American Type Culture Collection (Rockville MD, USA). For adipocyte differentiation experiments, cells were grown in Dulbecco’s modified Eagle’s medium (DMEM) containing 10% fetal bovine serum (FBS). After confluence, the cells were treated with differentiation medium (basal medium supplemented with 5% FBS, 1 μg ml−1 of insulin, 1 μm dexamethasone) with or without the indicated amount of troglitazone for 6–7 days. The cells were given fresh differentiation medium every 3 days. At 6–7 days, the media were harvested for measurement of lipoprotein lipase (LPL) enzyme protein mass. Troglitazone was added to the media by dissolving the drug in dimethyl sulphoxide (DMSO) and diluting the drug 1000 times in media.
Measurement of LPL mass
Lipoprotein lipase mass in both human plasma and cultured media from 3T3 cells was measured using an enzyme linked immunoassay as previously reported [11]. The LPL monoclonal antibody 5D2 (20 μg ml−1 in 50 μl of phosphate buffer saline (PBS)) was incubated in microtiter wells (Gibco) at room temperature for 3 h. The plates were rinsed three times with PBS. Sample plasma in T-PBS (PBS containing 1 m NaCl, 0.2% BSA and 0.05% Tween 20) was incubated for 2 h at room temperature. Then the plates were rinsed and chicken-anti-bovine milk LPL polyclonal antibody (10 μg ml−1) was added and incubated for 2 h at room temperature. After washing, 50 μl of goat anti-chicken IgG conjugated with horseradish peroxidase was added for incubation at room temperature for 2 h.
The plates were then rinsed and the peroxidase activity was measured by absorbance at 492 nm using o-phenylenediamine in citrate buffer (pH 5.3) containing H2O2 as substrate.
RNA extraction and reverse transcription polymerase chain reaction
Total cellular RNA was extracted from the 3T3-L1 cells using a single-step acid guanidinium thiocyanate-phenol—chloroform method. The isolated RNA was used for reverse transcription polymerase chain reaction (RT-PCR) analysis. The concentration of total RNA was assessed by spectrophotometric absorbance at 260 nm. Two micrograms of RNA were reverse transcribed to cDNA using 200 U of Moloney Murine Leukemia Virus (M-MLV) reverse transcriptase (GIBCO-BRL, Life Technologies, Inc., Rockville MD, USA) in 10 mm Tris-HCl (pH 8.3), 50 mm KCl, 5 mm MgCl2, 0.5 mm of each deoxynucleoside triphosphatase (d NTP), 18 U of ribonuclease inhibitor and 1 mg of random primers (hexamer) (Takara Biochemical, Kyoto, Japan). First-strand cDNA synthesis of total RNA was performed for 60 min at 42° C. Two negative controls were included for the first-strand synthesis, in which samples were denatured for 5 min at 95° C prior to PCR in order to inactivate M-MLV-reverse transcriptase.
A 405 base pair PCR product corresponding to the carboxyl terminal of mouse LPL was generated following the addition of 5 μl of cDNA to the PCR reaction buffer containing 10 mm of Tris-HCl, 2 mm Mg Cl2, 50 mm KCl (pH 8.3), 0.2 μm of each dNTP, 12.5 pmol of primers and 2.5 U of Takara Taq DNA polymerase (Takara Biochemical, Kyoto, Japan) in a final volume of 50 μl. The conditions for PCR were as follows: 95° C for 1 min, 54° C for 1 min, 72° C for 1 min for the indicated cycles and a final extension period of 72° C for 5 min. For identification of amplified products, 10 μl of each reaction mixture was electrophoresed on a 1.5% agarose gel containing ethidium bromide. After recording agarose gel images with a video camera in a computer, the band intensities were processed with the NIH image program [12]. Mouse cyclophilin B mRNA using RT-PCR served as controls for comparisons between samples. We used primers 5′-TTCCATTACCAAGTCAAGATTCAC-3′ and 5′-TCAGCCCGACTTCTTCAGAGACTT-3′ for amplification of the carboxyl terminal of mouse lipoprotein lipase and 5′-GGAAAGACTGTTCCAAAAACAGTG-3′ and 5′-GTCTTGGTGCTCTCCA-CCTTCCG-3′ corresponding to nucleotides 212-235 (sense) and 563-586 (antisense) for amplification of mouse cyclophilin B [13].
Northern blot analysis
For Northern analysis, 20 μg of total RNA in the presence of Glyoxal was separated by electrophoresis in 1.2% agarose gel and transfered to nylon membranes. After baking for 2 h at 80° C in a vacuum oven, the filter was prehybridized at 65° C for 30 min in a buffer containing 0.5 m NaH2PO4/10 mm-EDTA (pH 8.0), 1% bovine serum albumin and 7% SDS. Hybridization was conducted overnight under the same condition as prehybridization in the presence of 5×10⁶ cpm/ml of 32P-labelled carboxyl terminal of mouse LPL cDNA (405 bp). After hybridization, the filter was washed and then subjected to the autoradiography.
Statistical analysis
StadView-J 4.11 software was used for all statistical analysis.
Data are expressed as mean±s.d. The significance of differences in a time-course series was determined by one-way analysis of variance (anova). Individual data were compared with the control by Dunnett test. A Mann-Whitney test was conducted where data were not distributed normally.
A difference with a P value <0.05 was considered to be statistically significant.
Results
Effect of oral administration of troglitazone on plasma lipids, lipoproteins and glucose levels for patients with hyperlipidaemia and diabetes mellitus
The plasma total cholesterol (TC) level tended to decrease and the triglyceride (TG) level decreased significantly (P=0.004) 4 weeks after oral administration of troglitazone 200 mg once a day (Table 1), while those values did not change significantly in control subjects, who did not receive troglitazone (Table 2). In order to determine the mechanism by which plasma TG decreased, we measured LPL mass in post-heparin plasma of the subjects before and after the treatment. The LPL mass in post-heparin plasma increased significantly (n=12, P=0.03) in patients with 200 mg a day (Table 1), whereas, again, LPL mass did not change in subjects without this treatment (Table 2).
Table 1.
Effects of troglitazone (200 mg day−1) on clinical profile.

Table 2.
Clinical course of subjects who did not receive troglitazone.

Effect of troglitazone on LPL mass from cultured 3T3-L1 cells
In order to determine the effect of troglitazone on LPL protein mass in vitro, we compared the LPL mass in the media and in 3T3-L1 cells cultured with and without this compound. After 3T3-L1 cells were cultured with 1 μg ml−1 of insulin and 1 μm of dexamethasone in the presence or absence of 10, 20 or 30 μm of troglitazone, culture media were harvested for measurement of LPL mass by an enzyme-linked immunosorbent assay reported previously [11]. The LPL mass in the media for 3T3-L1 cells cultured in the presence of troglitazone was found to be significantly higher than that in the absence of troglitazone in a concentration dependent manner (Figure 1).
Figure 1.
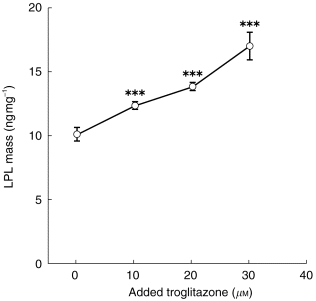
Lipoprotein lipase mass in culture media from 3T3 L1 cells cultured with or without troglitazone. Cells were grown in Dulbecco’s modified Eagle’s medium (DMEM) containing 10% fetal bovine serum. After confluence, the cells were treated with differentiation medium (basal medium supplemented with 5% FBS,1 mg of insulin, 1 μm dexamethasone) with or without 10, 20 or 30 μm troglitazone for 6–7 days, replacing the media with fresh differentiation medium every 3 days. After the culture, media were harvested for measurement of lipoprotein lipase (LPL). Troglitazone was added to the media by dissolving the drug in dimethyl sulphoxide (DMSO) and diluting the drug 1000 times with media. LPL mass in cultured media from 3T3 cells was measured using an enzyme linked immunoassay as previously reported [11]. ***P<0.001vs LPL mass in the absence of troglitazone.
Effect of troglitazone on mouse LPL using reverse transcription polymerase chain reaction (RT-PCR) method
In order to determine how troglitazone affects expression of LPL mRNA from the 3T3-L1 cells, we carried out RT-PCR using primers specific for the carboxyl terminal mouse LPL cDNA in four separate PCR cycles. The area of the bands of the RT-PCR product for the carboxyl terminal mouse LPL in the cell extracts cultured in the presence of troglitazone was significantly larger than those from the cells cultured in the absence of troglitazone for all of the cycles (20, 25 cycles) (Figure 2, Table 3). For the RT-PCR products in cycle 22, the same tendency was observed (data not shown). For the RT-PCR products in cycle 18, the products from the RNA of the cells cultured without troglitazone were barely visible, whereas clear and thicker bands were detected from the RNA of the cells cultured with 10 μm troglitazone (data not shown). In contrast, the RT-PCR product for mouse cyclophilin did not differ among the cells cultured with media in the presence and in the absence of troglitazone for those cycles (18, 20, 22, 25 cycles).
Figure 2.

RT-PCR products for either the carboxyl terminal of mouse LPL or mouse cyclophilin B in 3T3-L1 cells cultured with (Tro+) or without (Tro−) 10 μm troglitazone. For identification of amplification products, 10 μl of each reaction mixture was electrophoresed on a 1.5% agarose gel containing ethidium bromide. RNA (2 μg) was reverse transcribed to cDNA using 200 U of Moloney Murine Leukemia Virus (M-MLV) reverse transcriptase in 10 mm Tris-HCl (pH 8.3), 50 mm KCl, 5 mm MgCl2, 0.5 μm of each deoxynucleoside triphosphate (dNTP), 18 U of ribonuclease inhibitor and 1 μg of random primers (hexamer). A 405 base pair PCR product corresponding to the carboxyl terminal of mouse LPL was generated following the addition of 5 μl of cDNA to the PCR reaction buffer containing 10 mm Tris-HCl, 2 mm MgCl2, 50 mm KCl (pH 8.3), 0.2 μm of each dNTP, 12.5 pmol of primers and 2.5 U of TaKaRa Taq DNA polymerase for a final volume of 50 μl. For identification of amplification products, 10 μl of each reaction mixture was electrophoresed on a 1.5% agarose gel containing ethidium bromide. After recording agarose gel images with a video camera in a computer, band intensities were processed with the NIH image program [12]. LPL a carboxyl terminal of mice lipoprotein lipase, Cy B cyclophilin B.
Table 3.
Intensities of the bands for RT-PCR products analyzed by NIH image.

Northern blot analysis of RNA in the 3T3-L1 cells for expression of LPL
To confirm the results of RT-PCR, Northern blot analysis was carried out for the RNA from the 3T3-L1 cells cultured with or without 10 μm of troglitazone. The signal for LPL mRNA extracted in duplicate from 3T3-L1 cells in separate culture wells was found to be far stronger in 3T3-L1 cells cultured in the presence of 10 μm of troglitazone than without this compound, despite the fact that same amounts of total RNA (20 μg of RNA for each lane) were run (Figure 3).
Figure 3.

Northern blot analysis of RNA in 3T3-L1 cells. Total RNA was isolated from the 3T3-L1 cells cultured in the presence (left two lanes) or absence of (right two lanes) 10 μm troglitazone, and 20 μg of RNA samples were examined by Northern blot analysis. Hybridization was carried out over night in the presence of 32P-labelled carboxyl terminal of mouse LPL (405 bp) cDNA.
Discussion
In this study, we have demonstrated using the mouse preadipocyte cell line, 3T3-L1, that LPL enzyme protein mass and the LPL mRNA levels were induced in the presence of troglitazone, suggesting that this compound regulates the expression of LPL mRNA in adipose tissue transcriptionally, possibly leading to improvement of triglyceride-rich lipoproteins metabolism in plasma. It is well known that LPL is regulated by insulin action both transcriptionally and posttranscriptionally [9, 10]. In fact it is reported that insulin resistance causes a decrease in LPL in muscles and other tissue, leading to hypertriglyceridaemia and hypoalphalipoproteinaemia [14]. Thus, it is clinically important to improve insulin sensitivity and increase LPL activity for the treatment of subjects with insulin resistance.
Troglitazone, a thiazolidinedione derivative, is a novel oral antidiabetic agent that lowers plasma glucose levels and enhances insulin action in obese animals [1]. It is effective in lowering plasma glucose, reducing hyperinsulinaemia, and correcting glucose metabolism in animal models of obesity and NIDDM and also improves insulin sensitivity in cultured cells [2–5]. Several studies have been conducted to clarify the effect of this compound on plasma lipids levels in human as well as animal models such as KK and ob/ob mice and Zucker fatty rats. It is reported that this compound improves hypertriglyceridaemia as well as hyperglycaemia and hyperinsulinaemia [1]. Mimura et al. [15] report that in subjects with type 2 diabetes, plasma levels of triglyceride is decreased from 1.3 to 1.1 mmol l−1 by treatment with 400 mg day−1 of this compound, although they do not discuss possible mechanisms for the reduction of plasma triglyceride level. In the current study, plasma triglycerides were reduced from 1.8 to 1.2 mmol l−1 by treatment with 200 mg day−1, due possibly to the higher plasma triglyceride levels before treatment.
It has been shown that troglitazone causes an improvement in fasting plasma insulin levels and insulin sensitivity as evaluated by the glucose clamp method [15, 16]. The mechanism by which insulin sensitivity is improved by thiazolidinedione derivatives is reported to involve enhancement of adipose tissue differentiation and expression of C/EBP-α and GLUT4 [7]. More recently it has been shown that a thiazolidinedione derivative BRL 49653 is a strong and high affinity ligand for peroxisome proliferator-activated receptor-γ (PPAR-γ) [8]. Peroxisome is known to contribute to the oxidation of fatty acids and peroxisome proliferator is a substance which increases peroxisome in the liver. PPAR-γ has two subtypes, namely PPAR-γ 1 and γ 2. PPAR γ2 is known to be expressed specifically in adipocytes and is essential for the differentiation of fibroblasts into mature adipocytes.
Currently there is much interest in insulin resistance syndrome or metabolic syndrome X, in which the initial stage of pathophysiology is thought to be impairment of insulin sensitivity. Because hypertriglyceridaemia and hypoalphalipoproteinaemia are often accompanied by these syndromes, their pathophysiology would be closely related to impaired insulin sensitivity. Possible mechanisms of hypertriglyceridaemia and hypoalphalipoproteinaemia in these syndromes may be increased VLDL production from the liver or impaired hydrolysis of TG-rich lipoproteins by LPL in the plasma, which is known to catalyze hydrolysis of triglycerides in chylomicrons and very low density lipoproteins (VLDL). In fact we have demonstrated that subjects with abdominal visceral fat accumulation, which is considered to be closely related to insulin resistance syndrome [17], showed decreased levels of LPL activity and mass in post-heparin plasma. Thus, it may be useful to use troglitazone for treatment of subjects with insulin resistance syndrome and hypertriglyceridaemia, in view of its effect on LPL expression in cultured 3T3-L1 cells.
The concentration of troglitazone used in vitro in the present study was in the range of at least 10 fold higher than the in vivoconcentration achieved by clinical use of this drug [18]. The main factor contributing to the discrepancy of LPL in the in vitro and in vivo study could be that the muscle tissue, which is considered to be affected by troglitazone in terms of insulin sensitivity through its inhibitory effect on TNF-α, is also an important source besides adipose tissue for LPL in PHP. Thus, the mass of PHP-LPL reflects not only LPL derived from adipose tissue, which relates to the in vitro study conducted with 3T3-L1 cells but also muscle tissue, of which there was no in vitro study.
Finally, although there have been concerns about the hepatotoxiciy of this compound and in fact, it has been reported that elevations in serum alanine aminotransferase concentrations of more than three times the upper limit of normal level were detected in 48 out of 1134 subjects who received this drug, discontinuation of drug caused normalization of serum alanine aminotransferase in all cases [19]. In the present study, none of the subjects showed any elevation of liver transaminase during the treatment.
In summary, we found that troglitazone improves plasma triglyceride-rich lipoproteins metabolism by inducing the expression of LPL from adipocytes at the transcriptional level.
Acknowledgments
We thank Dr Tarou Matsumoto for his excellent technique to conduct the present study.
References
- 1.Fujiwara T, Yoshida S, Yoshida T, Ushiyama I, Horikoshi H. Characterization of new oral antibiotic agent CS-045. Studies in KK and ob/ob mice and Zucker fatty rats. Diabetes. 1988;37:1549–1558. doi: 10.2337/diab.37.11.1549. [DOI] [PubMed] [Google Scholar]
- 2.Chang AY, Wyse BM, Gilchrist BJ, Peterson T, Diani AR. Ciglitazone, a new hypoglycemic agent. I. Studies in ob/ob and db/db mice, diabetic Chinese hamsters and normal and streptozocin-diabetic rats. Diabetes. 1983;32:830–838. doi: 10.2337/diab.32.9.830. [DOI] [PubMed] [Google Scholar]
- 3.Fujita T, Sugiyama Y, Taketomi S, et al. Reduction of insulin resistance in obese and/or diabetic animal by 5-[4-(1-methylcyclohexymethoxy) benzyl]-thiazolidine-2,4 dione (ADD-3878, U -63,287, ciglitazone) a new antidiabetic agent. Diabetes. 1983;32:804–810. doi: 10.2337/diab.32.9.804. [DOI] [PubMed] [Google Scholar]
- 4.Sugiyama Y, Shimura Y, Ikeda H. Effect of pioglitazone on hepatic and peripheral insulin resistance in Wistar fatty rats. Arzneimittel Forsch. 1990;40:436–440. [PubMed] [Google Scholar]
- 5.Blackmore PF, McPherson R K, Stevenson RW. Actions of the novel antidiabetic englitazone in rat hepatocytes. Metabolism. 1993;42:1583–1587. doi: 10.1016/0026-0495(93)90154-g. [DOI] [PubMed] [Google Scholar]
- 6.Ciaraldi TP, Gilmore A, Oelfsky JM, Goldberg M, Heidenreich KA. In vitro studies on the action of CS 045. A new antibiotics agent. Metabolism. 1990;39:1056–1062. doi: 10.1016/0026-0495(90)90166-a. [DOI] [PubMed] [Google Scholar]
- 7.Szalkowsk D, White-Carrington S, Berger J, Zhang B. Antidiabetic thiazolidinediones block the inhibitory effect of tumor necrosis factor on differentiation, insulin-stimulated glucose uptake, and gene expression in 3T3-L1 cells. Endocrinol. 1995;136:1474–1481. doi: 10.1210/endo.136.4.7895657. [DOI] [PubMed] [Google Scholar]
- 8.Lehmann JM, Moore LB, Smith-Oliver TA, Wilkison WO, Willson TM, Kliewer SA. An antidiabetic thiazolidinedione is a high affinity ligand for peroxisome proliferator-activated receptor γ (PPAR γ) J Biol Chem. 1995;270:12953–12956. doi: 10.1074/jbc.270.22.12953. [DOI] [PubMed] [Google Scholar]
- 9.Ong JM, Kirchgessner TG, Schotz MC, Kern PA. Insulin increases the synthetic rate and messenger RNA level of lipoprotein lipase in isolated rat adipocytes. J Biol Chem. 1988;263:12933–12938. [PubMed] [Google Scholar]
- 10.Semenkovich CF, Wims M, Noe L, Etinne J, Chan L. Insulin regulation of lipoprotein lipase activity in 3T3-L1 adipocytes is mediated at posttranscriptional and posttranslational levels. J Biol Chem. 1989;264:9030–9038. [PubMed] [Google Scholar]
- 11.Kobayashi J, Hashimoto H, Fukamachi I, et al. Lipoprotein lipase mass and activity in severe hypertriglyceridemia. Clin Chim Acta. 1993;216:113–123. doi: 10.1016/0009-8981(93)90144-s. [DOI] [PubMed] [Google Scholar]
- 12.Becker A, Reith A, Napiwotszki J, Kadenbach B. A quantitative method of determining initial amounts of DNA by polymerase chain reaction cycle titrating using digital imaging and a novel DNA stain. Anal Biochem. 1996;237:204–207. doi: 10.1006/abio.1996.0230. [DOI] [PubMed] [Google Scholar]
- 13.Hasel KW, Glass JR, Godbout M, Sutcliffe JG. An endoplasmic reticulum-specific cyclophilin. Mol Cell Biol. 1991;11:3484–3491. doi: 10.1128/mcb.11.7.3484. [DOI] [PMC free article] [PubMed] [Google Scholar]
- 14.Yost TJ, Froyd KK, Jensen DR, Eckel RH. Changes in skeletal muscle lipoprotein lipase activity in response to insulin/glucose in non-insulin-dependent diabetes mellitus. Metabolism: Clinical and Experimental. 1995;44:786–790. doi: 10.1016/0026-0495(95)90193-0. [DOI] [PubMed] [Google Scholar]
- 16.Iwamoto T, Kuzuya T, Matsuda A, Awata T, Inooka G, Shiraishi I. Effects of new oral antidiabetic agent CS-045 on glucose tolerance and insulin secretion in patients with NIDDM. Diabetes Care. 1991;14:1083–1086. doi: 10.2337/diacare.14.11.1083. [DOI] [PubMed] [Google Scholar]
- 15.Mimura K, Umeda F, Hiramatsu S, et al. Effect of a new oral hypoglycemic agent (CS-045) on metabolic abnormalities and insulin resistance in type II diabetes. Diabetic Med. 1994;11:685–691. doi: 10.1111/j.1464-5491.1994.tb00333.x. [DOI] [PubMed] [Google Scholar]
- 17.Kobayashi J, Tashiro J, Murano S, Morisaki N, Saito Y. Lipoprotein lipase mass and activity in post-heparin plasma from subjects with intra-abdminial visceral fat accumulation. Clin Endocrinol. 1998;48:515–520. doi: 10.1046/j.1365-2265.1998.00485.x. [DOI] [PubMed] [Google Scholar]
- 18.Shibata H, Arai S, Kobayashi M, et al. Phase I study of a new hypoglycemic agent CS-045 in healhy volunteers. Rinsho Iyaku. 1993;9:1503–1518. [Google Scholar]
- 19.Watkins PB, Whitcomb RW. Hepatic dysfunction associated with troglitazone. N Engl J Med. 1998;338:916. doi: 10.1056/NEJM199803263381314. [DOI] [PubMed] [Google Scholar]