

Abstract
Aims
To assess the utility of human hepatic microsomes for predicting in vivo intrinsic clearance (CLint) via the use of four cytochrome P450 2C9 substrates: phenytoin, tolbutamide (S)-ibuprofen (two pathways) and diclofenac, and to examine the role of exogenous albumin within the microsomal incubation.
Methods
V max, Km and CLint (defined as V max/Km ratio) were estimated under initial rate conditions for five pathways of metabolism in a bank of 15 human hepatic microsomal samples and were scaled to in vivo units using the microsomal protein index. Non-metabolic related binding in microsomes was measured for phenytoin and tolbutamide in the presence and absence of albumin.
Results
Microsomal CLint values differed by over two orders of magnitude, with the means ranging from 0.18 (phenytoin) to 40.70 (diclofenac) μl min−1 mg−1 microsomal protein. When these data were scaled and compared with published in vivo studies a similar rank order was obtained, however, the actual CLint tended to be underpredicted. While the in vivo unbound Km for phenytoin, 1–5 μm is substantially lower than the value determined in microsomes based on total concentrations (56 μm), correction for the in vitro binding reduces this value to 20 μm and 6 μm in the absence and presence of albumin, respectively. Similar trends were seen with tolbutamide Km.
Conclusions
An appreciation of the utility of in vitro prediction can be best achieved when the range of CLint values predicted from the individual hepatic microsomal samples are compared with the range of individual in vivo CLint values reported in the literature. The degree of underprediction is less evident using the range than the mean data and no consistent advantage in adding albumin to the incubation media is apparent.
Keywords: CYP2C9, human microsomes, intrinsic clearance, in vitro predictions
Introduction
A general strategy to quantitatively predict in vivo drug clearance from CLint values estimated from in vitro drug metabolising systems has recently been explored and evaluated in the rat using a data base of 35 drugs which show a range of turnovers covering four orders of magnitude [1–3]. The ultimate application of such a prediction strategy is with human tissue, and although there have been many studies with human in vitro tissue, often sufficient methodological detail is lacking from the original report to allow a systematic analysis. Iwatsubo and coworkers [3] have compiled literature data on the in vitro and in vivo clearances of 25 drugs and were able to demonstrate a significant correlation despite the numerous sources of these data and the low sample numbers upon which the parameters were based (see later). There remains a need for more indepth examinations of the utility of human in vitro kinetic data for the prediction of the in vivo situation.
As there is a shortage of good quality human liver material from which hepatocytes can be successfully isolated, the vast majority of researchers employ the hepatic microsomal fraction as their enzyme source due to its ease of preparation from tissue of varying quality and its long storage time. One of the main confounding issues with the use of human material is the large degree of interindividual variability in terms of the cytochrome P450 (CYP) complement. CYP2C9, a human CYP isoform of major importance [4], has been reported to consistently display the least interindividual variability, both in terms of immunoblotted content (four-fold range) [5, 6] and probe substrate kinetic properties (four-fold range) [6, 7] and contrasts with CYP3A4 (60-and 15 fold for immunoblotted content and substrate kinetics) [5–7] and CYP2D6 (16-and 14-fold range) [5–7]. However, an in vivo study [8], using tolbutamide as a CYP2C9 probe and the ratio of metabolite to parent drug as the index of enzyme activity, demonstrated a 10-fold range in a group of 106 healthy subjects and speculated on a possible incidence of 1 in 500 for the poor metaboliser phenotype.
As part of a systematic study to assess the utility of human microsomes to predict in vivo clearance, four CYP2C9 substrates were selected for study: phenytoin, tolbutamide (S)-ibuprofen and diclofenac. These compounds show a wide range of CLint covering 0.28–44 l min−1 70 kg−1 (see Table 1), are all extensively metabolized by CYP2C9 and show considerable plasma protein binding. Phenytoin, an anticonvulsive agent, is metabolized via 4′-hydroxylation to hydroxyphenytoin, which is eliminated mainly in the urine as the glucuronide conjugate [9]. Interestingly phenytoin displays nonlinear kinetics in vivo, consistent with saturation of the metabolic enzyme, and the parameters V maxand Km have been well documented due to the need for plasma concentration monitoring in therapy. Tolbutamide is a compound of low hepatic extraction which is also metabolized to one metabolite by hydroxylation of the 4-benzyl group. However, most of an administered dose is eliminated in urine as carboxytolbutamide, formed by oxidation of the primary hydroxy metabolite [10]. (S)-Ibuprofen, a nonsteroidal anti-inflammatory drug, has been less extensively studied than the other CYP2C9 substrates detailed above, but it is known that there are two main metabolites, both hydroxylated on the propyl group to form 2-hydroxy-and 3-hydroxyibuprofen. The latter metabolite undergoes further oxidation to form 2-carboxyibuprofen, the fraction of each metabolite formed (fm) from the two primary metabolites are 0.3 and 0.5, for the 2-and 3-hydroxy forms, respectively [10]. Diclofenac is also a nonsteroidal anti-inflammatory agent, it is metabolized in several positions, although the main metabolite, with an fm of 0.5, is 4′-hydroxydiclofenac [12, 13].
Table 1.
In vivo intrinsic clearance estimates for phenytoin, tolbutamide (S)-ibuprofen and diclofenac from literature reportsa.

Recently it was reported that the addition of bovine albumin (BSA) to human hepatic microsomal incubations, presumably to aid solubility, results in a reduction of the Km for phenytoin hydroxylation in vitro to a value more comparable with the in vivo value [14]; both parameters were based on unbound concentrations. Therefore studies were undertaken to investigate this phenomenon as tolbutamide (S)-ibuprofen and diclofenac are also extensively bound to plasma proteins, with unbound fractions in plasma of 0.05 for the former two compounds [15, 16] and 0.004 for the latter [17, 18].
The aims of the present study were twofold; first to assess the utility of hepatic microsomes in predicting the in vivo CLint of four CYP2C9 substrates, and secondly to examine the role of exogenous albumin on kinetic parameters obtained from in vitro incubations.
Methods
Chemicals
[14C]-phenytoin (specific activity 53.1 mCi mmol−1, radiochemical purity >99%) was purchased from New Life Science Products (Stevenage, Herts, UK), [14C]-tolbutamide (specific activity 54.0 mCi mmol−1, radiochemical purity >99% was purchased from Amersham Life Sciences (Bucks, UK). Phenytoin and tolbutamide and their hydroxy metabolites were obtained from Sigma Chemical Co (Poole, Dorset, UK) (S)-ibuprofen and 3-hydroxy (S)-ibuprofen were gifts from Boots (Nottingham, UK), diclofenac and 4-hydroxydiclofenac were gifts from Novartis (Basel, Switzerland). BSA and other general laboratory reagents were also purchased from Sigma Chemical Co and BDH (Lutterworth, Leics, UK).
Source and preparation of human liver microsomes
Human liver samples (n = 9) were acquired from the International Institute for the Advancement of Medicine (Exeter, PA, USA) and (n = 6) from nontransplantable material from Addenbrookes Hospital (Cambridge, UK). All human liver samples were stored on arrival at −80° C until microsomes were prepared using the ultracentrifugation method described previously [19] with the exception of the homogenizing and resuspension buffer (0.25 m sucrose, 50 mm Tris, pH 7.4) and the storage buffer (0.1 m phosphate, pH 7.4). CYP and protein contents were determined in microsomes using established methods [20, 21].
Microsomal incubations
In all cases experiments were undertaken to identify the initial rate conditions with respect to time and microsomal protein concentration. All further experiments were within the appropriate linear conditions and were carried out in duplicate. In all cases microsomes (n = 15, 1 mg ml−1, except for tolbutamide which was 0.75 mg ml−1) were preincubated with substrate for 2 min in a shaking water bath at 37° C. Reactions were started by the addition of 100 μl of an NADPH regenerating system (1 mm NADP+, 7.5 mm isocitric acid, 1 U isocitrate dehydrogenase, 0.015 m magnesium chloride, 0.1 m phosphate buffer, pH 7.4). In order to minimize the effects of organic solvent on enzyme activity, the final concentration of solvent in the incubation was kept between 0.5 and 1% (v/v). Preliminary data indicates that the solvents used had only small effects on CYP2C9 activity.
Phenytoin
Microsomes were incubated with 14C and unlabelled phenytoin (both added in methanol) to yield final drug concentrations of 5, 30, 100 and 200 μm (methanol volume of 10 μl), the final incubation volume was 1 ml. Reactions were terminated after 120min by the addition of 5 ml of tert-butyl-methylether and samples were immediately tumble mixed for 1 h. The organic layer was transferred to clean tubes and evaporated to dryness under oxygen-free nitrogen. Samples were resuspended in 150 μl of h.p.l.c. mobile phase. In addition, incubations were also carried out as described in the presence of 2% BSA (n = 8).
Tolbutamide
Microsomes were incubated with tolbutamide (0.05, 0.10, 0.50 and 1.0 mm, added in 3.75 μl methanol), the incubation volume was 0.75 ml. Reactions were terminated after 30 min by the addition of 50 μl of concentrated hydrochloric acid, samples were extracted as described elsewhere [19]. In addition, incubations were also carried out as described in the presence of 2% BSA (n = 8).
(S)-Ibuprofen
Microsomes were incubated with (S)-ibuprofen (10–500 μm, added in 5 μl dimethylformamide), the incubation volume was 500 μl. Incubations were terminated after 30 min by the addition of 50 μl of concentrated hydrochloric acid. Flurbiprofen was subsequently added (25 μl of 250 μg ml−1, in methanol) as an internal standard and samples tumble mixed for 30 min with 5 ml chloroform. The aqueous layer was aspirated off and the organic layer evaporated to dryness under oxygen-free nitrogen. The residue was reconstituted in 200 μl of 0.05% phosphoric acid and acetonitrile (69:31, v:v).
Diclofenac
Microsomes were incubated with diclofenac (5, 30 and 100 μm, added in 10 μl of water), the incubation volume was 200 μl. Reactions were terminated after 20 min by the addition of 50 μl of acetonitrile. Samples were then centrifuged in a microcentrifuge for 10 min in order to precipitate the protein.
Binding studies with phenytoin and tolbutamide
Microsomes (liver G, 1 mg ml−1 for phenytoin and 0.75 mg ml−1 for tolbutamide) were incubated in a shaking water bath at 37° C with either 14C and unlabelled phenytoin (1–200 μm) or 14C and unlabelled tolbutamide (50–1000 μm) in 0.2 μm microfiltration tubes (Whatman, UK) for 30 min in the absence of an NADPH regenerating system. In addition the samples were incubated in the presence and absence of 2% BSA. After the incubation the samples were immediately centrifuged for 10 min in a microcentrifuge to separate the bound and unbound drug. Aliqouts of the filtrate were mixed with liquid scintillant and counted in an LKB liquid scintillation counter. Incubations were carried out in triplicate.
H.p.l.c. analysis
Phenytoin
Microsomal incubates were analysed as described previously [19] with an increased flow rate of 2 ml min−1 employing an on-line radioflow scintillation counter (Hewlett Packard, UK). The peak area of the hydroxyphenytoin, confirmed by coelution with spiked unlabelled metabolite and u.v. detection was measured. Results were calculated in molar equivalents accounting for a concentration independent extraction efficiency of 97.2±5.1% (1–200 μm, n = 40).
Tolbutamide
Microsomal extracts were analysed as described previously for rat hepatic microsomal tissue [19].
(S)-Ibuprofen
The method followed was a modification of that of Lockwood & Wagner [22]. 100 μl of the reconstituted samples were injected onto a Spherisorb 5ODS C8 column. Mobile phase comprising solvent A (0.05% phosphoric acid, containing 0.1% triethylamine, v:v) and solvent B (acetonitrile) was delivered (1.6 ml min−1) for 0–8 min at 31% solvent B. Between 8 and 16 min solvent B concentration was increased linearly to 65%, solvent B concentration was then reduced to 31% over 5 min. The eluent was monitored at 220 nm, retention times were as follows: 2-hydroxy metabolite, 5.7 min, 3-hydroxy metabolite, 6.7 min, flurbiprofen, 15.1 min and (S)-ibuprofen, 16.1 min. A standard curve was constructed in samples incubated in the absence of a regenerating system (which was added after the acid) using 3-hydroxy (S)-ibuprofen as the standard, the 2-hydroxy metabolite could not be obtained, thus the 3-hydroxy standard was used to quantify this metabolite, as previously has been adopted [23]. Results were quantified by the peak height ratio method with respect to the internal standard.
Diclofenac
The method employed was a modification of that described by Godbillon and coworkers [24]. 100 μl of the microsomal supernatant was injected onto a Hypersil 5ODS C18 column, employing a mobile phase (1 ml min−1) of methanol:acetonitrile:1% (v:v) acetic acid (55:7:38, v:v:v). The eluent was monitored at 282 nm, and a standard curve constructed in samples incubated in the absence of a regenerating system which was added after the organic solvent. The retention times of the 4′-hydroxy metabolite and diclofenac were 6.2 and 12.9 min, respectively.
Data analysis
In vitro kinetic data
In order to reduce the number of drug concentrations required to accurately determine Michaelis-Menten parameters by nonlinear regression, an alternative approach was adopted for phenytoin, diclofenac and tolbutamide. There is an abundance of data which confirms that the formation of the metabolites is monophasic, characterized by V max and Km for phenytoin [14, 25], tolbutamide [25–27] and diclofenac [28, 29]. Therefore the direct-linear plot has been employed which enables V max and Km to be estimated from rates measured at only two to four substrate concentrations [30]. For the tolbutamide and phenytoin incubations conducted in the presence of albumin the free substrate concentrations were used in the estimation of Km. An initial pilot study with tolbutamide, employed five microsomal samples and eight substrate concentrations. The data were analysed using nonlinear regression (as described below), the V max and Km values were statistically compared (Wilcoxon test) with the corresponding values obtained using the direct-linear plot with four substrate concentrations, there was no statistically significant difference between the two approaches (P < 0.05).
A larger substrate concentration range was employed for (S)-ibuprofen in view of the less well reported metabolite kinetics, and the discrepancy between livers which indicate monophasic or biphasic kinetics [23]. The data were then analysed using nonlinear regression software (Siphar, Cimed, Creteil, France), using both a one and two site model, the one site model was chosen based on visual inspection of the line of best fit, consideration of the randomness of the residuals, the standard error of the parameter estimates (<10%) and the Aikaike information criteria.
The individual CLint values obtained for the five metabolites were compared between the substrates using the Spearman Rank correlation analysis, to test for significant correlations between the compounds. The phenytoin and tolbutamide samples incubated in the presence of albumin were excluded from this analysis.
The V max and Km estimates obtained in the presence of 2% BSA for phenytoin and tolbutamide were statistically compared using the Wilcoxon test to the corresponding parameters determined in the absence of BSA.
Calculation of in vivo CLint from literature data
In order to assess the accuracy of microsomal predictions of pharmacokinetic behaviour it is necessary to estimate the observed in vivo CLint values. Therefore literature reports were examined to enable CLint to be calculated. However, several criteria had to be satisfied in order for a study to be included, these were; oral dosage (providing the amount absorbed was known), the dosage must be within the region of linear kinetics, the plasma protein binding should be known and preferably the blood:plasma concentration also reported. The venous equilibration model was assumed and eqn 1 used to estimate CLint:
| (1) |
where fm is the fraction of drug converted to a metabolite, D is the dose, AUC is the area under the plasma concentration-time curve and fub is the unbound fraction of drug in the blood. If the blood:plasma concentration ratio is unknown then it is possible to calculate a value for this parameter if the drug binds extensively to albumin, as is the case with tolbutamide (S)-ibuprofen and diclofenac. If drug is highly bound to plasma proteins the ratio of the concentration of drug in the blood cell to the unbound drug in plasma approaches 0, therefore the blood:plasma concentration ratio reduces to (1—the haematocrit), i.e. 0.55 [31].
Scaling microsomal parameters to in vivo CLint
The CLint values obtained for each of these substrates were scaled to in vivo units, employing a scaling factor based on the microsomal protein index, which reflects the inefficiency of the microsomal preparation procedure. There are only a handful of reported values for this scaling factor, and they range from 15 mg microsomal protein g−1 liver [32] to 77 mg g−1 [33]. This range is similar to that reported for rat microsomal protein recovery and it has been recommended that a literature average of around 45 mg g−1 be adopted [2, 34]. A recovery of 52.5 mg g−1 has been calculated based on the CYP contents of human hepatocytes (0.14 nmol CYP/106 cells) and microsomal tissue (0.32 nmol CYP mg−1 microsomal protein) and assuming a hepatocellularity of 120×106 cells g−1 liver [3]. Therefore, taking into account the range of human recovery reflecting that of rat, and the calculated recoveries for both species, a scaling factor of 50 mg g−1 liver has been used, together with a liver weight of 1500 g 70 kg−1 man.
Results
Microsomal incubations
The mean CYP content of the 15 microsomal samples employed in the present study was 0.27 nmol mg−1 protein (s.d.: 0.10). The metabolite formation kinetics for the five metabolites monitored are presented in Table 2 as the parameters V max, Km and CLint (defined as the V max/Kmratio). The V max values for each substrate displayed between four-and 10-fold interindividual variability, the Km values showed slightly lower variability between samples, with the exception of tolbutamide. For this drug there is around 12-fold variability, resulting from one sample having a Km(838 μm) considerably higher than the other livers (67–520 μm) although this is still within the substrate concentration range employed. The CLint values reflect these interindividual variations in V max and Km, with five-to 19-fold variations between samples. The range of mean CLint values for the four drugs exceeds three orders of magnitude, from 0.18 μl min−1 mg−1 protein (phenytoin) to 40.70 μl min−1 mg−1 protein (diclofenac). The individual CLint values for the 15 microsomal samples are shown in Figure 1 for the five pathways monitored. Statistically significant correlations were obtained between diclofenac and tolbutamide (P < 0.001), diclofenac and phenytoin (P < 0.01), tolbutamide and phenytoin (P < 0.05) and (S)-ibuprofen 2-hydroxylation and (S)-ibuprofen 3-hydroxylation (P < 0.05), thus confirming the involvement of CYP2C9 in diclofenac, phenytoin and tolbutamide metabolism. The lack of correlations between either of the (S)-ibuprofen metabolites with any of these substrates indicates that other isoforms may be involved in their formation. However, the V max values for both pathways were statistically significantly correlated with diclofenac (P < 0.01), and the 2-hydroxy pathway also correlated with phenytoin (P < 0.05). Recent evidence has shown correlations between the formation rates of the 2-hydroxy and 3-hydroxy metabolites and dextromethorphan O-demethylation, a CYP2D6 marker, and chlorzoxazone 6-hydroxylation, a CYP2E1 marker, in addition to the 6α-hydroxylation of the CYP2C8 probe taxol [23] indicating that other CYP isoforms, in particular 2C8, may contribute to (S)-ibuprofen metabolism as well as CYP2C9.
Table 2.
Metabolite formation kinetics for phenytoin, tolbutamide, (S)-ibuprofen and diclofenac metabolism in human hepatic microsomesa.
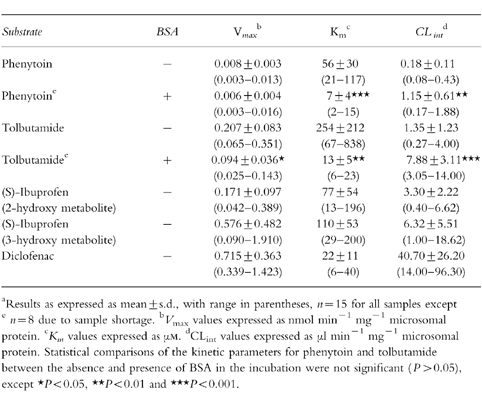
Figure 1.
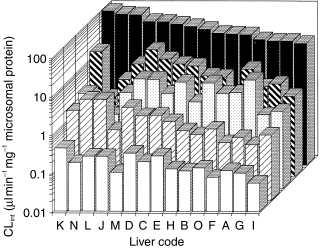
CLint values for individual livers (n = 15) for phenytoin (□), tolbutamide ( ) (S)-ibuprofen 2-hydroxy metabolite (
 ) (S)-ibuprofen 3-hydroxy metabolite (
 ) and diclofenac (▪).
In vivo Clint values
Table 1 presents a summary of the in vivo CLint data obtained for the four substrates studied, taken from literature reports. Both phenytoin and tolbutamide have been studied more extensively than the other two compounds, reflecting their long therapeutic usage and, in the former case, the need for therapeutic drug monitoring due to its nonlinear kinetics. Most ibuprofen studies have used the racemate, since this is the clinically administered form. However, two studies have investigated the (S)-isomer, the active form of this nonsteroidal anti-inflammatory drug. The mean CLint values range over three orders of magnitude, with tolbutamide having the lowest value and diclofenac the highest. The interindividual range of values for each substrate varies from two-fold, for both metabolites of (S)-ibuprofen to almost seven-fold for tolbutamide. The latter range is more in keeping with the range of microsomal CLint values.
Scaling microsomal data to in vivo
The microsomal CLint data reported in Table 2 were scaled to in vivo units of l min−1 70 kg−1 man, to enable direct comparison with the observed parameters. These scaled data, together with the predicted/observed ratio of the mean values are presented in Table 3. In general the mean predicted CLint values are poor, as demonstrated by the low predicted/observed CLint ratios of 0.05–0.31. The exception to this trend is shown with tolbutamide, for which a ratio of 0.72 was obtained. Figure 2 illustrates these predictions and demonstrates that, in general, the same rank order of metabolic stability is observed in vitro as in in vivo. Also a similar range of CLint values are obtained extending over three orders of magnitude. It is clear that the in vitro data are underpredicting, with the exception of tolbutamide.
Table 3.
Comparison of observed in vivo intrinsic clearances with predicted values from hepatic microsomes.
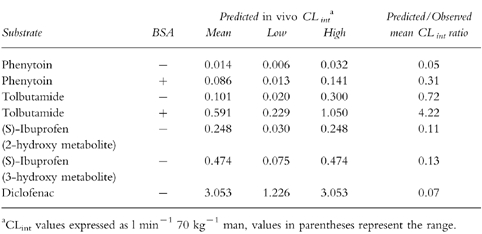
Figure 2.
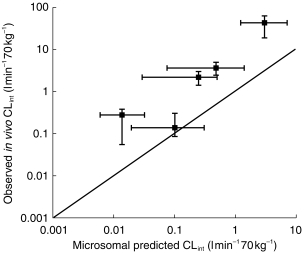
Comparison of observed in vivo CLint with CLint values predicted from microsomal studies. Each point represents the mean value together with the range for the observed and predicted CLint values. The solid line represents the line of unity.
There is a trend for the accuracy of the microsomal prediction to increase linearly with the in vitro Km value. Thus, the lowest predicted/observed CLint ratios (0.05 and 0.07) are achieved for the low Km substrates, diclofenac (22 μm) and phenytoin (56 μm), whereas the ratio for tolbutamide (0.71) with a Km of 254 μm, is much more accurate.
Phenytoin and tolbutamide binding studies in microsomes
Phenytoin binding in microsomes, in the absence of exogenous BSA, was concentration independent over the range 1–200 μm used for the microsomal studies, with a mean unbound fraction of 0.36±0.07. In the presence of 2% albumin this value decreased further to 0.25±0.06. Figure 3 presents these data, together with the corresponding tolbutamide binding data. This latter compound demonstrated concentration dependent binding in the presence of 2% BSA over the concentration range used in the microsomal studies, 50–1000 μm. However, in the absence of albumin there was no binding, the free fraction was 1.0±0.05.
Figure 3.
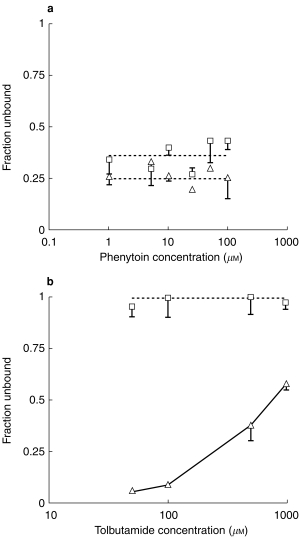
Microsomal binding of phenytoin (a) and tolbutamide (b) as a function of drug concentration in the absence (□) and presence (▵) of 2% BSA.
The metabolite formation kinetic parameters determined for these two drugs in the presence of 2% BSA are presented in Table 2. In the presence of 2% BSA there are statistically significant decreases in the Km values for both phenytoin and tolbutamide. In contrast, only the V max value for tolbutamide alters significantly with the addition of albumin, an approximate two-fold reduction. Interestingly both compounds show a statistically significant six-fold increase in CLint. Figure 4 presents a comparison of the reduction in Km, as defined by the ratio of Km values in the absence:presence of albumin, for tolbutamide and phenytoin in each microsomal preparation. Linear regression analysis of these data yields a correlation coefficient of 0.709, which is statistically significant (P < 0.05), thus there are similar decreases in Km for each microsomal sample with both drugs.
Figure 4.
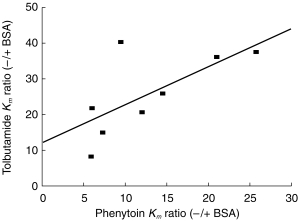
Relationship between change in Km for phenytoin and tolbutamide after the addition of albumin, expressed as the -/+ BSA ratio.
Figure 5 illustrates the degree of overlap of the in vitro CLint values for the 15 individual livers and the range of in vivo CLint values reported in the literature for both phenytoin and tolbutamide. Although the addition of BSA produces an increase in both sets of in vitro CLint values, there is a good degree of overlap between these parameters estimated from both in vitro systems and the corresponding in vivo parameters.
Figure 5.
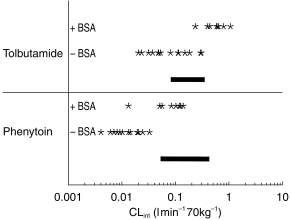
Range of observed in vivo CLint values (−) for phenytoin and tolbutamide together with the corresponding range of predicted CLint values from microsomes (*) in the absence and presence of BSA.
Discussion
To assess the utility of human microsomes in predicting in vivo CLint values, the metabolite formation kinetics of four CYP2C9 substrates have been determined in human microsomes. These substrates were selected based on their range of in vivo CLint values, spanning several orders of magnitude. The kinetic parameters determined in vitro display the expected range of activity: for V max of 0.008–0.715 nmol min−1 mg−1 protein, for Km of 7–254 μm and for CLint of 0.18 –40.70 μl min−1 mg−1 protein. The rank order of the latter parameter was consistent in both in vitro and in vivo systems. However, in absolute terms, scaling the in vitro CLint data to in vivo units using the microsomal protein index as the scaling factor provided predictions which were consistently lower than the reported in vivo data.
It has been proposed, based on animal investigations, that acceptable CLint predictions should fall within the precision limits of 50–200%, i.e. between a 50% underprediction to a 100% overprediction [2]. Application of these limits to the mean data would indicate that only the prediction for tolbutamide is accurate, 72% of the observed CLint. The other four other pathways are underpredicted, between 5 and 13% of the observed value, based on the mean values. Interestingly these data (phenytoin, diclofenac and both ibuprofen metabolites) appear to lie on a line parallel to the line of identity implying a consistent underprediction. One possible cause of consistent underprediction would be that the recovery of CYP2C9 during microsomal preparation differs markedly from that of other CYPs and hence this is not reflected in the total CYP measured spectrophotometrically. It is interesting that there is a linear trend between the accuracy of the predicted CLint value and the Km estimated in vitro whereas no such relationship exists for V max, implying that there are problems associated with the determination of the former parameter. Confirmation of this is provided by considering phenytoin, a drug which exhibits nonlinear kinetics in vivo consistent with enzyme saturation. Estimates of V maxin vivo range from 0.8–5.6 μmol min−1 70 kg−1, with a mean value of ≈1.4 μmol min−1 70 kg−1 [35–37]. Scaling the microsomal V max values using the microsomal protein recovery, yields a mean estimate of 0.6 μmol min−1 70 kg−1 with a range 0.2–1.0 μmol min−1 70 kg−1. Thus the mean V max estimate is 43% of the observed value. However, the CLint prediction is much lower, representing just 5% of the observed value, indicating that the major source of the underprediction is associated with the Km. Observed unbound Km values in vivo range between 0.06 and 11.8 with a mean of 3.4 μm [35–37] whereas the mean microsomal value is an order of magnitude larger, 56 μm. A recent study by Ludden and coworkers [14] has observed a similar discrepancy with phenytoin Kmin vitro. They estimated a similar Km value to ours (31 μm, n = 7), Doecke and coauthors [25] also estimated a Km value of 30 μm (n = 3). We have determined that there is an appreciable degree of phenytoin binding in standard microsomal incubations (i.e. in the absence of albumin), of ≈64% and this contradicts the assumption of Ludden et al. [14]. Correcting the mean Km for this binding yields an estimate of 20 μm, which is still substantially higher than the observed in vivo value, and incorporation of this value raises the mean CLint prediction to 0.03 l min−1 70 kg−1 (representing 11% of the observed value). It has been demonstrated that the addition of BSA to microsomal incubations resulted in unbound Km values more comparable to the in vivo situation [14]. Therefore we examined the effect of 2% BSA on the kinetic parameters for phenytoin and also on tolbutamide, since the CLint of this compound was well predicted, and it is also bound to albumin.
Albumin caused substantial decreases in the unbound Km values for both substrates, with the degree of interindividual variability being maintained. Although there was a slight decrease in phenytoin V max this was not statistically significant, however, the corresponding parameter for tolbutamide was reduced by more than half. The net effect of these changes is a six-fold increase in CLint for both compounds. Thus the unbound Km for phenytoin, 7 μm, is within the range reported for the plasma unbound Km noted above.
The consequences of the addition of BSA to the scaled CLint can be seen in Figure 5. For phenytoin there is a distinct improvement in the prediction of the observed CLint. Moreover, there is no appreciable improvement for the prediction of tolbutamide CLint using the unbound Km. In fact if only the mean data are considered, then the change from 0.1 to 0.59 l min−1 70 kg−1 results in an overestimation of the observed value (0.14 l min−1 70 kg−1). The mechanism by which BSA alters the kinetic parameters for metabolite formation is unclear. A possible explanation is that albumin acts by ‘cleaning up’ the microsomal incubation in some way, perhaps by binding some endogenous agent which binds to the enzyme. There is some indirect evidence for this since there is a direct relationship in the Km changes between individual livers for these substrates. Unfortunately it was not feasible to assess the effects of BSA on the other two substrates due to the particularly extensive albumin binding that both diclofenac and ibuprofen demonstrate.
A previous study with rat hepatic microsomes also demonstrated similar results with regard to predictions of in vivo CLint for phenytoin and tolbutamide, with the former being poorly predicted and the latter accurately predicted [19]. However, in that study, end-product inhibition was proposed as the reason for the poor microsomal prediction, this is less likely to be the case in the present study since the rate of hydroxyphenytoin formation is substantially lower in human microsomes, and hence there is much less metabolite accumulation.
Interindividual variability in CLint confounds in vitro-in vivo comparisons due to the inability to match healthy volunteer subjects with human tissue donors; thus the direct comparison of mean data is compromised. In order to address one side of this issue we have collated data concerning the in vivo pharmacokinetics of our substrates using various data sources, and for phenytoin and tolbutamide there are a reasonably large number of individuals. It is preferable that for comparisons of in vitro and in vivo human data that the latter data should be obtained from more than one source. With regard to the in vitro studies, we have employed a microsomal liver bank prepared from 15 individuals and this provided a 10-fold range of kinetic parameters. The advantages of considering the range of individual parameters obtained in in vitro-in vivo studies rather than the mean values are illustrated by Figures 2 and 5.
In summary, the present study illustrates the complexities involved in the quantitative prediction of CLint. Although hepatic extraction classification can be made based on the rank order of the in vitro data, there is a consistent underprediction of absolute CLint values. When the range of parameter values are incorporated into the analysis a better appreciation of the utility of the in vitro prediction from human microsomes is obtained. The addition of albumin to the microsomal incubation does affect the Km estimation of both tolbutamide and phenytoin. However, the advantages in the determination of CLint were not consistent, therefore based on the current available information it is concluded that the addition of albumin to microsomal incubations does not assist in in vitro-in vivo comparisons.
Acknowledgments
DJC was financially supported by a GlaxoWellcome postdoctoral fellowship. The assistance of Judith Hargreaves in a portion of this work is gratefully acknowledged.
References
- 1.Houston JB. Utility of in vitro1 drug metabolism data in predicting in vivo metabolic clearance. Biochem Pharmacol. 1994;47:1469–1479. doi: 10.1016/0006-2952(94)90520-7. [DOI] [PubMed] [Google Scholar]
- 2.Houston JB, Carlile DJ. Prediction of hepatic clearance from microsomes, hepatocytes and liver slices. Drug Met Rev. 1997;29:891–922. doi: 10.3109/03602539709002237. [DOI] [PubMed] [Google Scholar]
- 3.Iwatsubo T, Hirota N, Ooie T, et al. Prediction of in vivo drug metabolism in the human liver from in vitro metabolism data. Pharmacol Ther. 1997;73:147–171. doi: 10.1016/s0163-7258(96)00184-2. [DOI] [PubMed] [Google Scholar]
- 4.Miners JO, Birkett DJ. Cytochrome P4502C9: an enzyme of major importance in human drug metabolism. Br J Clin Pharmacol. 1998;45:525–538. doi: 10.1046/j.1365-2125.1998.00721.x. [DOI] [PMC free article] [PubMed] [Google Scholar]
- 5.Guengerich FP, Turvy CG. Comparison of levels of several human microsomal cytochrome P-450 enzymes and epoxide hydrolase in normal and disease states using immunochemical analysis of surgical liver samples. J Pharmacol Exp Ther. 1991;256:1189–1195. [PubMed] [Google Scholar]
- 6.Shimada T, Yamazaki H, Mimura M, Inui Y, Guengerich FP. Interindividual variations in human liver cytochrome P-450 enzymes involved in the oxidation of drugs, carcinogens and toxic chemicals: studies with liver microsomes of 30 Japanese and 30 Caucasians. J Pharmacol Exp Ther. 1994;270:414–423. [PubMed] [Google Scholar]
- 7.Forrester LM, Henderson CJ, Glancey MJ, et al. Relative expression of cytochrome P450 isoenzymes in human liver and associations with the metabolism of drugs and xenobiotics. Biochem J. 1992;281:359–368. doi: 10.1042/bj2810359. [DOI] [PMC free article] [PubMed] [Google Scholar]
- 8.Veronese ME, Miners JO, Rees DLP, Birkett DJ. Tolbutamide hydroxylation in humans: lack of bimodality in 106 healthy subjects. Pharmacogenenetics. 1993;3:86–93. doi: 10.1097/00008571-199304000-00004. [DOI] [PubMed] [Google Scholar]
- 9.Dickinson RG, Hooper WD, Patterson M, Eadie MJ, Maguire B. Extent of urinary excretion of p-hydroxyphenytoin in healthy subjects given phenytoin. Ther Drug Monit. 1985;7:283–289. doi: 10.1097/00007691-198507030-00008. [DOI] [PubMed] [Google Scholar]
- 10.Thomas RC, Ikeda GJ. The metabolic fate of tolbutamide in man and in the rat. J Med Chem. 1966;9:507–510. doi: 10.1021/jm00322a014. [DOI] [PubMed] [Google Scholar]
- 11.Rudy AC, Knight PM, Brater DC, Hall SD. Stereoselective metabolism of ibuprofen in humans: administration of R-, S- and racemic ibuprofen. J Pharmacol Exp Ther. 1991;259:1133–1139. [PubMed] [Google Scholar]
- 12.Riess W, Stierlen H, Geiger UP. Data on the pharmacokinetics and metabolism of diclofenac (Voltaren) in animals and man. In: Wagenhauser FJ, Berne, Stuttgart, et al., editors. Chronic Forms of Polyarthritis. Huber: Vienna; 1976. pp. 302–317. [Google Scholar]
- 13.Stierlin H, Faigle JW, Sallmann A, et al. Biotransformation of diclofenac sodium (Voltaren) in animals and in man I. Isolation and identification of principal metabolites. Xenobiotica. 1979;9:601–610. doi: 10.3109/00498257909042327. [DOI] [PubMed] [Google Scholar]
- 14.Ludden LK, Ludden TM, Collins JM, Pentikis HS, Strong JM. Effect of albumin on the estimation, in vitro, of phenytoin Vmax and Km values: Implications for clinical correlation. J Pharmacol Exp Ther. 1997;282:391–396. [PubMed] [Google Scholar]
- 15.Tassaneeyakul W, Veronese ME, Birkett DJ, et al. Co-regulation of phenytoin and tolbutamide metabolism in humans. Br J Clin Pharmacol. 1992;34:494–498. [PMC free article] [PubMed] [Google Scholar]
- 16.Evans AM, Nation RL, Sansom LN, Bochner F, Somogyi AA. Stereoselective plasma protein binding of ibuprofen enantiomers. Eur J Clin Pharmacol. 1989;36:283–290. doi: 10.1007/BF00558161. [DOI] [PubMed] [Google Scholar]
- 17.John VA. The pharmacokinetics and metabolism of diclofenac sodium (Voltarol) in animals and man. Rheumatol Rehab Suppl. 1979;2:22–37. [PubMed] [Google Scholar]
- 18.Chan KKH, Vyas KH, Brandt KD. In vitro protein binding of diclofenac sodium in plasma and synovial fluid. J Pharm Sci. 1987;76:105–108. doi: 10.1002/jps.2600760204. [DOI] [PubMed] [Google Scholar]
- 19.Ashforth EIL, Carlile DJ, Chenery R, Houston JB. Prediction of in vivo disposition from in vitro systems: Clearance of phenytoin and tolbutamide using rat hepatic microsomal and hepatocyte data. J Pharmacol Exp Ther. 1995;274:761–766. [PubMed] [Google Scholar]
- 20.Omura T, Sato R. The carbon monoxide binding pigment of liver microsomes. J Biol Chem. 1964;239:2370–2378. [PubMed] [Google Scholar]
- 21.Lowry OH, Rosebrough NJ, Farr AL, Randall RJ. Protein measurement with the folin phenol reagent. J Biol Chem. 1951;193:265–275. [PubMed] [Google Scholar]
- 22.Lockwood GF, Wagner JG. High-performance liquid chromatographic determination of ibuprofen and its major metabolites in biological fluids. J Chromatogr. 1982;232:335–343. doi: 10.1016/s0378-4347(00)84173-0. [DOI] [PubMed] [Google Scholar]
- 23.Hamman MA, Thompson GA, Hall SD. Regioselective and stereoselective metabolism of ibuprofen by human cytochrome P450, 2C. Biochem Pharmacol. 1997;54:33–41. doi: 10.1016/s0006-2952(97)00143-3. [DOI] [PubMed] [Google Scholar]
- 24.Godbillon J, Gauron S, Metayer JP. High perfomance liquid chromatographic determination of diclofenac and its monohydroxylated metabolites in biological fluids. J Chromatogr. 1985;338:151–159. doi: 10.1016/0378-4347(85)80079-7. [DOI] [PubMed] [Google Scholar]
- 25.Doecke CJ, Veronese ME, Pond SM, et al. Relationship between phenytoin and tolbutamide hydroxylations in human liver microsomes. Br J Clin Pharmacol. 1991;31:125–130. doi: 10.1111/j.1365-2125.1991.tb05499.x. [DOI] [PMC free article] [PubMed] [Google Scholar]
- 26.Miners JO, Smith KJ, Robson RA, McManus ME, Veronese ME, Birkett DJ. Tolbutamide hydroxylation by human liver microsomes. Kinetic characterisation and relationship to other cytochrome P-450 dependent xenobiotic oxidations. Biochem Pharmacol. 1988;37:1137–1144. doi: 10.1016/0006-2952(88)90522-9. [DOI] [PubMed] [Google Scholar]
- 27.Back DJ, Stevenson P, Tjia JF. Comparative effects of two antimycotic agents, ketoconazole and terbinafine on the metabolism of tolbutamide, ethinyloestradiol, cyclosporin and ethoxycoumarin by human liver microsomes in vitro. Br J Clin Pharmacol. 1989;28:166–170. doi: 10.1111/j.1365-2125.1989.tb05410.x. [DOI] [PMC free article] [PubMed] [Google Scholar]
- 28.Leeman T, Transon C, Dayer P. Cytochrome P 450TB, (CYP2C): a major monooxygenase catalyzing diclofenac 4′hydroxylation in human liver. Life Sci. 1992;52:29–34. doi: 10.1016/0024-3205(93)90285-b. [DOI] [PubMed] [Google Scholar]
- 29.Shen S, Marchick MR, Davis MR, Pohl LR. ISSX Proceedings. Gothenburg: 6th European ISSX Meeting; 1997. 5-Hydroxylation of diclofenac by human cytochrome P450 3A4: Possible role in idiosyncratic hepatotoxicity; 102 pp. [Google Scholar]
- 30.Eisenthal R, Cornish-Bowden A. The direct linear plot. A new graphical procedure for estimating enzyme kinetic parameters. Biochem J. 1974;139:715–720. doi: 10.1042/bj1390715. [DOI] [PMC free article] [PubMed] [Google Scholar]
- 31.Rowland M, Tozer N. Blood to plasma concentration ratio. In: Rowland M, Tozer TN, editors. Clinical Pharmacokinetics Concepts and Applications. 2. Philadelphia and London: Lea and Febiger; 1989. pp. 476–478. [Google Scholar]
- 32.Schmucker DL, Woodhouse KW, Wang RK, et al. Effects of age and gender on in vitro properties of human liver microsomal monooxygenases. Clin Pharmacol Ther. 1990;48:365–374. doi: 10.1038/clpt.1990.164. [DOI] [PubMed] [Google Scholar]
- 33.Baarnhielm C, Dahlback H, Skanberg I. In vivo pharmacokinetics of felodipine predicted from in vitro studies in rat, dog and man. Acta Pharmacol Toxicol. 1986;59:113–122. doi: 10.1111/j.1600-0773.1986.tb00142.x. [DOI] [PubMed] [Google Scholar]
- 34.Carlile DJ, Zomorodi K, Houston JB. Scaling factors to relate drug metabolic clearance in hepatic microsomes, isolated hepatocytes and the intact liver. Studies with induced livers involving diazepam. Drug Metab Disp. 1997;25:903–911. [PubMed] [Google Scholar]
- 35.Eadie MJ, Tyrer JH, Bochner F, Hooper WD. The elimination of phenytoin in man. Clin Exp Pharmacol Physiol. 1976;3:217–224. doi: 10.1111/j.1440-1681.1976.tb02667.x. [DOI] [PubMed] [Google Scholar]
- 36.Jusko WJ. Bioavailability and disposition kinetics of phenytoin in man. In: Kellaway P, Petersen I, editors. Quantitative Analytic Studies in Epilepsy. New York: Raven Press; 1976. pp. 115–136. [Google Scholar]
- 37.Winter ME, Tozer TN. Phenytoin. In: Evans WE, Schentag JJ, Jusko WJ, Vancouver WA, editors. Applied Pharmacokinetics: Principles of Theraputic Drug Monitoring. 2. Applied Therapeutics Inc; 1986. pp. 493–539. [Google Scholar]
- 38.Svendsen TL, Kristensen MB, Hansen JM, Skovsted L. The influence of disulfiram on the half life and metabolic clearance rate of diphenylhydantoin and tolbutamide in man. Eur J Clin Pharmacol. 1976;9:439–441. doi: 10.1007/BF00606562. [DOI] [PubMed] [Google Scholar]
- 39.Gugler R, Manion CV, Azarnoff DL. Phenytoin: Pharmacokinetics and bioavailability. Clin Pharmacol Ther. 1976;19:135–142. doi: 10.1002/cpt1976192135. [DOI] [PubMed] [Google Scholar]
- 40.Grasela TH, Sheiner LB, Rambeck B, et al. Steady-state pharmacokinetics of phenytoin from routinely collected patient data. Clin Pharmacokinet. 1983;8:355–364. doi: 10.2165/00003088-198308040-00006. [DOI] [PubMed] [Google Scholar]
- 41.Kurata D, Wilkinson GR. Erythrocyte uptake and plasma binding of diphenylhydantoin. Clin Pharmacol Ther. 1974;16:355–362. doi: 10.1002/cpt1974162355. [DOI] [PubMed] [Google Scholar]
- 42.Carulli N, De Ponz Leon M, Mauro E, Manenti F, Ferrari A. Alteration of drug metabolism in Gilbert’s syndrome. Gut. 1976;17:581–587. doi: 10.1136/gut.17.8.581. [DOI] [PMC free article] [PubMed] [Google Scholar]
- 43.Williams RL, Blaschke TF, Meffin PJ, Melmon KL, Rowland M. Influence of acute viral hepatitis on disposition and plasma binding of tolbutamide. Clin Pharmacol Ther. 1977;21:301–309. doi: 10.1002/cpt1977213301. [DOI] [PubMed] [Google Scholar]
- 44.Zilly W, Breimer DD, Richter E. Stimulation of drug metabolism by rifampicin in patients with cirrhosis or cholestasis measured by increased hexobarbital and tolbutamide clearance. Eur J Clin Pharmacol. 1977;11:287–293. doi: 10.1007/BF00607679. [DOI] [PubMed] [Google Scholar]
- 45.Wing LMH, Miners JO. Cotrimazole as an inhibitor of oxidative drug metabolism: effects of trimethoprim and sulphamethoxazole separately and combined on tolbutamide disposition. Br J Clin Pharmacol. 1985;20:482–485. doi: 10.1111/j.1365-2125.1985.tb05102.x. [DOI] [PMC free article] [PubMed] [Google Scholar]
- 46.Back DJ, Tjia J, Monig H, Ohnhaus EE, Park BK. Selective inhibition of drug oxidation after simultaneous administration of two probe drugs, antipyrine and tolbutamide. Eur J Clin Pharmacol. 1988;34:157–163. doi: 10.1007/BF00614553. [DOI] [PubMed] [Google Scholar]
- 47.Veronese ME, Miners JO, Randles GD, Birkett DJ. Validation of the tolbutamide metabolic ratio for population screening with use of sulphaphenazole to produce model phenotypic metabolizers. Clin Pharmacol Ther. 1990;47:403–411. doi: 10.1038/clpt.1990.46. [DOI] [PubMed] [Google Scholar]
- 48.Page MA, Boutagy JS, Shenfield GM. A screening test for slow metabolisers of tolbutamide. Br J Clin Pharmacol. 1991;31:649–654. doi: 10.1111/j.1365-2125.1991.tb05587.x. [DOI] [PMC free article] [PubMed] [Google Scholar]
- 49.Lee EJD, Williams K, Day R, Graham G, Champion D. Stereoselective disposition of ibuprofen enantiomers in man. Br J Clin Pharmacol. 1985;19:669–674. doi: 10.1111/j.1365-2125.1985.tb02694.x. [DOI] [PMC free article] [PubMed] [Google Scholar]
- 50.Willis JV, Kendall MJ, Flinn RM, Thornhill DP, Welling PG. The pharmacokinetics of diclofenac sodium following intravenous and oral adminstration. Eur J Clin Pharmacol. 1976;16:405–410. doi: 10.1007/BF00568201. [DOI] [PubMed] [Google Scholar]
- 51.Drenska A, Ognyanova V, Tomoy I, et al. Feloran (diclofenac sodium). Pharmacokinetics in experimental animals and humans after oral administration. Med Biol Inform. 1984;2:12–16. [Google Scholar]
- 52.Degen PH, Dieterle W, Schneider W, Theobald W, Sinterhauf U. Pharmacokinetics of diclofenac and five metabolites after single doses in healthy volunteers and after repeated doses in patients. Xenobiotica. 1988;18:1449–1455. doi: 10.3109/00498258809042267. [DOI] [PubMed] [Google Scholar]
- 53.Transon C, Leemann T, Vogt N, Dayer P. In vivo inhibition of cytochrome P450TB (CYP2C9) by (±)-fluvastatin. Clin Pharmacol Ther. 1995;58:412–417. doi: 10.1016/0009-9236(95)90054-3. [DOI] [PubMed] [Google Scholar]