

Abstract
Aims
1. To determine the population pharmacokinetics of gentamicin in 957 patients with varying renal function dosed once daily. 2. To see if current starting doses for once daily aminoglycoside dosing are appropriate. 3. To test whether calculating creatinine clearance using an adjusted Cockcroft and Gault method (CLCr,adjusted) was a better predictor of gentamicin clearance than the standard Cockcroft and Gault method (CLCr,unadjusted).
Methods
Nine hundred and fifty-seven patients were dose-individualized for gentamicin using SeBA-GEN, a Bayesian dosing method. This method returns estimates of the values of gentamicin CL and Vd from which the 24 h AUC can be estimated. The goal of therapy was to attain an AUC of 70–100 mg l−1 h depending on the severity of the infection. The population was divided into four groups of differing renal function. Linear regression analysis was performed to determine the relationship between Vd and various indices of weight, and gentamicin CL and either CLCr,adjusted or CLCr,unadjusted.
Results
The mean Vd (±s.d.) and CL (±s.d.) of gentamicin in our total population were 17.4 (±4.1) l and 4.0 (±1.8) l h−1, respectively. There was a decrease in Vd with reducing renal function when comparing patients with normal renal function and patients with poor renal function. The lower of total body weight (TBW) and lean body weight (LBW), termed dosing weight (DWT), was a slightly better predictor of Vd (r2 = 0.28) than either TBW (r2 = 0.21) or LBW (r2 = 0.21). CLCr,adjusted (r2 = 0.80) was a better predictor of gentamicin CL than CLCr,unadjusted(r2 = 0.57).
Conclusions
The mean population values of Vd and CL of gentamicin dosed once daily are similar to those described by others in relation to multiple daily dosing. Given that previous methods have been based on population values of Vd and CL from multiple daily dosing, the currently recommended starting doses for once daily aminoglycoside dosing would seem appropriate. The Vd reduced with decreasing renal function, with a maximum of 23% difference between patients with normal and poor renal function. The Cockcroft and Gault method of calculating creatinine clearance does not appear to perform well at low values of serum creatinine concentration. An adjustment of the Cockcroft and Gault method is proposed to allow for this.
Keywords: gentamicin, pharmacokinetics, renal function
Introduction
After 50 years, aminoglycoside antibiotics remain important for the treatment of serious infections [1]. There have been numerous publications advocating the use of once daily dosing of aminoglycosides over conventional dosing methods involving multiple daily doses. In addition to clinical studies, there are now at least nine meta-analyses comparing once vs conventional daily dosing [2–10]. These suggest that once daily aminoglycoside dosing is as effective as conventional therapy, with a trend towards less nephrotoxicity.
Methods of monitoring aminoglycosides after once daily dosing, include the methods of Nicolau et al. [11], Begg et al. [12], and Prins et al. [13]. The advantages and disadvantages of these methods have been reviewed recently [14], but there have been no formal comparative studies between the three methods. There has even been debate over the need to monitor serum aminoglycoside concentrations at all with once daily dosing [15]. We believe that in the early period after a change in a method of dosing, it is even more important to monitor, until trials confirm the requirements or not [16].
Bayesian methods have been advocated for dose prediction during aminoglycoside therapy, and have good predictive performance using minimal data points [17, 18]. A sequential Bayesian algorithm for the dose-individualization of once-daily dosing of the aminoglycosides gentamicin and tobramycin (SeBA-GEN) has been developed [18]. This method returns estimates of the values of gentamicin CL and Vd, from which the AUC can be estimated for a given dose and a new dose recommended for any target AUC.
Although it is well accepted that gentamicin clearance correlates well with creatinine clearance, in a recent comparison of SeBA-GEN vs ABBOTTBASE in 100 consecutive patients it was shown prospectively that creatinine clearance calculated from low values of serum creatinine using the Cockcroft and Gault method [19] using LBW as described by Pesola et al. [20] (See Appendix 1, equation 1 and 2) resulted in a poor prediction of gentamicin clearance [18]. An adjusted method of calculating creatinine clearance (see Appendix 1, equation 5) was devised to accommodate low values of serum creatinine. In this method, values of serum creatinine less than 0.06 mmol l−1 were set at 0.06 mmol l−1 because it was thought that low values of serum creatinine may reflect decreased production rather than enhanced clearance. When gentamicin clearance was regressed against this adjusted estimate of creatinine clearance (CLCr,adjusted), there was greater explained variance (r2 = 0.79) than when gentamicin clearance was regressed against the conventional unadjusted Cockcroft and Gault creatinine clearance (CLCr,unadjusted) (r2 = 0.51) [18]. This suggests that CLCr,adjustedwas a better predictor of gentamicin clearance and highlights the limitations of the Cockcroft and Gault formula in patients with low values of serum creatinine. Failure to adjust in this way may result in over-estimation of the patient’s predicted gentamicin clearance, with the potential for significant overdose on the first dose in some patients.
Although there is a large amount of data describing the pharmacokinetics of aminoglycosides in various populations following multiple daily dosing [21], there is little data describing the pharmacokinetics of gentamicin when given once daily. In addition, there have been few studies looking at the pharmacokinetics in patients with varying degrees of renal dysfunction in once daily aminoglycoside dosing. The method of Begg et al. [12] proposed starting doses for patients with varying degrees of renal function, aiming to achieve equivalent AUCs. These AUCs are based on those that would have been achieved with conventional dosing targeting peak concentrations of 6–10 mg l−1 and trough concentrations of less than 2 mg l−1. However, this method has not been validated.
Aims
The main aim of this study was to determine the population pharmacokinetics of gentamicin in our local population during once daily dosing and to establish whether the pharmacokinetics of gentamicin differed in patients with varying degrees of renal dysfunction. From these data the validity of the proposed starting doses as suggested by Begg et al. [12] for patients with normal and varying degrees of renal dysfunction were assessed. A secondary aim was to test retrospectively whether the method for adjustment of the Cockcroft and Gault equation as proposed by Duffull et al. [18] was a better predictor of gentamicin clearance than that of the Cockcroft and Gault method modified by Pesola to use LBW instead of TBW [19].
Methods
Patients
Patients who were dose-individualized for gentamicin using SeBA-GEN as part of routine clinical practice were included in the study. Patients were excluded if they had tetraplegia, because of the risk of respiratory failure with high peak concentrations. Our guidelines also excluded patients with endocarditis because the principles of therapy with aminoglycosides differ for this indication.
Once daily dosing
The goal of therapy was to achieve high peak serum concentrations (lt;10 mg l−1) while limiting the value of steady state AUC(0,24h) to between 70 and 100 mg l−1h [12]. These steady state AUC(0,24h) values represent the consequences of a dose of between 5 and 7 mg kg−1day−1 in patients with normal renal function who have a typical value of gentamicin clearance (4.0 l h−1) [21]. These doses are associated with peak concentrations of 20–30 mg l−1 in patients with a typical value of volume of distribution (0.25 l kg−1) [22]. The initial dose was chosen by the physician caring for the patient. Two blood samples were taken, the first at 0.5 h after the end of the infusion, and the second at a time between 6 and 20 h after the infusion, depending upon renal function. Blood sample monitoring was repeated every 2–3 days depending on the clinical condition of the patient. Serum gentamicin concentrations were measured using the Abbott TDx fluorescence polarization immunoassay method (limit of detection 0.25 mg l−1) by Canterbury Health Laboratories.
Individualization of once daily dosing
The patient demographic data and dosing information were entered into SeBA-GEN by the clinical pharmacist in the team responsible for the care of the patient, or by the clinical pharmacology staff. The dosing prediction, the demographic data, and pharmacokinetic data were saved into an individual file for each patient. Each file was identified by the patient’s national identity number.
Collection of data
The data files from January 1995 to June 1997 were imported into Microsoft Excel (5.0). The following demographic data were available: age (years), height (cm), gender, serum creatinine (mmol l−1), total body weight (TBW) (kg), lean body weight (LBW) (kg), patient name, and national hospital number. The values of clearance (gentamicin CL) and Vd were also recorded. The values of CLcr,unadjusted and CLCr,adjustedwere calculated as per equations 4 and 5 in Appendix 1.
The population was divided into four groups depending upon CLCr,adjusted:>4.0, 2.5–4.0, 1.3–2.4, and <1.3 l h−1. These were the subgroups determined by our dosing protocol [12]. In addition to providing a stratified subgroup analysis, the mean values of clearance from each subgroup can be used to determine the starting dose for each patient group for future dosing algorithms, and to check on the validity of currently recommended starting values.
Descriptive statistics were computed for the pharmacokinetic and demographic data (mean, s.d. and 95% confidence interval) using Graphpad Prism (Ver 2.0). Linear regression was performed to determine the relationship between Vd and either TBW, LBW, or DWT; and between gentamicin CL and either CLCr,unadjusted or CLCr,adjusted.
A data rounding technique was used to determine whether the serum creatinine concentration of 0.06 mmol l−1 that had been used prospectively in our previous study was the best ‘round up’ point for adjusting the Cockcroft and Gault method. This was assessed by performing repeated linear regression analyses between gentamicin CL and CLCr,unadjusted, where patients with values of serum creatinine of 0.02 were rounded to 0.03, then all values of 0.03 mmol l−1 to 0.04 mmol l−1, etc. until 0.12 mmol l−1. In other words, in the first linear regression all the data was included, while for the second regression all data were again used except all values of 0.02 mmol l−1 were rounded to 0.03 mmol l−1, and so on. The coefficient of determination (r2) values were compared between regressions.
Results
Demographics and population pharmacokinetics
Data from nine hundred and fifty-seven patients (506 males and 451 females) were available for analysis. The mean age (±s.d.) of our population was 60 (±20.3) (range 16–97). The mean TBW and LBW (±s.d.) were 68.4 (±15) (range 30–140) and 65.5 (±10.2) (range 37.8–88.7), respectively. The mean serum creatinine concentration was 0.08 mmol l−1, with 208 patients having values of serum creatinine concentration less than 0.06 mmol l−1. The population values of gentamicin CL and Vdare given in Table 1, and population frequency histograms are presented in Figure 1(a),(b).
Table 1.
Mean, s.d. and range of the pharmacokinetic parameters of gentamicin. Pharmacokinetic parameters (mean, 95% confidence interval) stratified for renal function.
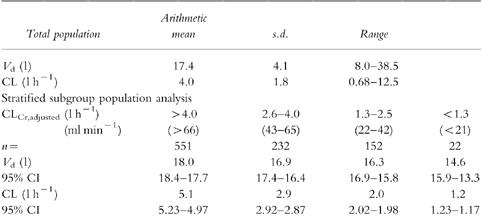
Figure 1.
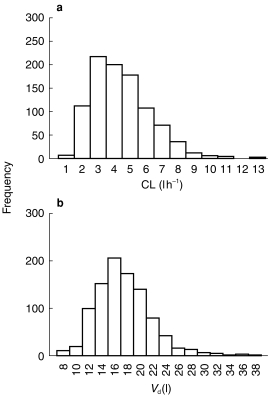
a) Frequency histogram of gentamicin CL for 957 patients. b) frequency histogram of Vd for 957 patients.
The mean Vd (±s.d.) and CL (±s.d.) of gentamicin in our total population were 17.4 (±4.1) l and 4.0 (±1.8) l h−1, respectively (Table 1). These are very similar to those published previously [21, 22]. The large variation around the value of clearance, was expected given the large variation in age and renal function of our population. Further, as expected, gentamicin clearance reduced with decreasing renal function. The mean values of clearance for each of the stratified subgroups can be used to calculate starting doses for the therapy of future patients (Tables 2 and 3).
Table 2.
Predicted starting doses using stratified values of clearance for a desired AUC.
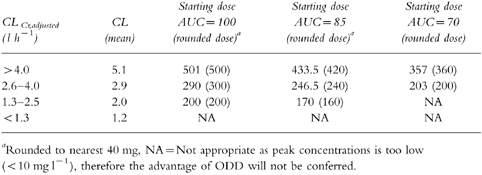
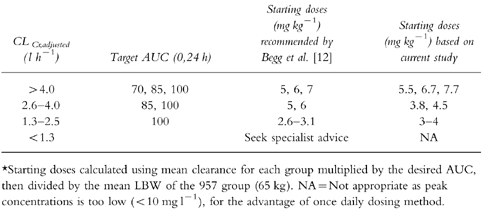
Table 3.
Comparison of starting doses recommended by Begg et al. [12] vs starting doses based on the current study on a weight adjusted basis.
A decrease in Vdwith reducing renal function was seen. This was observed with either CLCr,unadjusted or CLCr,adjusted. A mean difference of 23% was observed between patients with normal renal function (CLCr,adjusted >4.0 l h−1) compared with patients with poor renal function (CLCr,adjusted <1.26 l h−1) (Table 1).
Regression analysis
DWT (r2 = 0.28) was a slightly better predictor of Vd than either TBW (r2 = 0.21) or LBW (r2 = 0.21) (see Appendix 1). As expected, Vd increased with increasing indices of weight. (See Figure 2)
Figure 2.
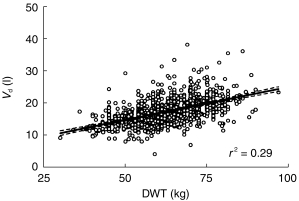
Vd (1) vs DWT (kg) where DWT is the lower of TBW or LBW. The solid line represents the line of best fit. The dashed lines represent the 95% confidence interval of the slope.
The regression analysis for gentamicin CL vs CLCr,adjusted and CLCr,unadjusted showed that CLCr,adjusted(r2 = 0.80) was a better predictor of gentamicin CL than was CLCr,unadjusted (r2 = 0.57) (see Figure 3). It is important to note that over 20% of the population had a serum creatinine concentration of less than 0.06 mmol l−1.
Figure 3.
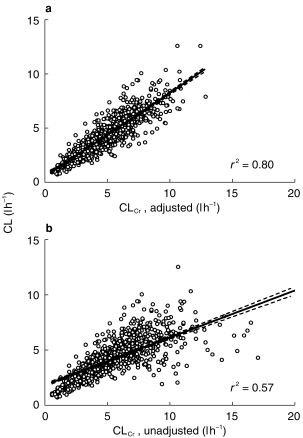
a) Gentamicin clearance vs CLCr,adjusted where values of serum creatinine less than 0.06 mmol l−1 are set at 0.06 mmol l−1 and DWT is used instead of LBW. b) Gentamicin clearance vs CLCr,adjusted using method of Cockcroft and Gault [19] but using DWT in stead of TBW. The solid line on both graphs represents the line of best fit. The dashed lines represent the 95% confidence interval of the slope.
The r2 of the repeated linear regressions of gentamicin CL vs CLCr,unadjusted where low values of serum creatinine were sequentially rounded, is shown in Figure 4, plotted against the ‘round up’ of serum creatinine. The curve suggests a clear point of inflexion around the ‘round up’ value of 0.06 mmol l−1.
Figure 4.
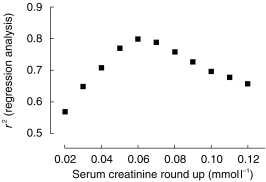
A plot of the squared correlation coefficient from the linear regression analysis of gentamicin CL and CLCr,unadjustedvs serum creatinine ‘round up’ where the patients with low values of serum creatinine were sequentially increased in the analysis.
The individual characteristics of patients with low serum creatinine concentrations were compared with those patients with ‘normal’ values of serum creatinine. These patients were mostly female (155) vs male (52), had a lower DWT (58.4 vs 64.1 kg (P < 0.005)), lower age (52 vs 63 (P < 0.006)), and a trend towards a larger Vd (0.30 vs 0.27 (P = 0.052)).
Discussion
The absolute values of gentamicin CL and Vd after once daily dosing appear to be similar to those after multiple daily dosing [21, 22].
This is the first time that a significant reduction in the Vd for aminoglycosides has been observed in patients with reduced renal function. This has been described for other drugs with low protein binding such as digoxin [23, 24]. The mechanism may relate to displacement of the drug from tissue binding sites by retained metabolic products, e.g. urea. In contrast, drugs with high protein binding, e.g. phenytoin, often have an increased volume of distribution in renal impairment [25–28], as the displacement from the plasma protein binding sites predominates. The largest mean difference (23%) in Vd seen between the group with the highest and lowest creatinine clearance raises the question of the clinical significance of this finding. Fortuitously a smaller Vd will result in higher peak concentrations for any given dose in patients with renal impairment. This would be expected to be beneficial in patients with poor renal function, where gentamicin clearance may be so low that it is difficult to achieve a high enough peak concentrations (lt;10 mg l−1) while maintaining an AUC of ≤100 mg l−1 h.
The starting doses calculated using the mean values of clearance of each subgroup based on renal function are similar to those recommended by Begg et al. [12] (see Tables 2 and 3). Comparing the initial doses of Begg et al. [12] with the new data it would appear that patients with good renal function (lt;4.0 l h−1) may have been slightly underdosed, while patients with poor renal function may have been slightly overdosed.
Gentamicin is a hydrophilic, polar drug that distributes mainly into the extracellular fluid volume. Therefore, Vd would be expected to have only relatively small changes with increasing weight as seen in Figure 2. The increase in Vd may be accounted for by the water content of adipose tissue, which has been reported to be around 15% [28], and this has been shown previously in obese patients receiving aminoglycoside [29]. Dosing weight (DWT) was a slightly better predictor of Vd than either TBW or LBW. This is probably because it corrects for both, obese and cachexic patients.
CLCr,adjusted was a better predictor of gentamicin clearance than CLCr,unadjusted (r2 = 0.80 vs 0.57) confirming our previous findings [18]. Figure 3b demonstrates that there are patients with very high predicted values of CLCr,unadjusted, but with low values of gentamicin clearance. This, and the data rounding analysis support the concept of rounding low values of serum creatinine to 0.06 mmol l−1 before using the Cockcroft and Gault equation, to give a better estimate of the patient’s gentamicin clearance. It is probable that low values of serum creatinine are due to reduced production and not enhanced clearance. This phenomenon may have implications for dosing other renally cleared drugs in patients with low values of serum creatinine, as has recently been suggested for carboplatin [26].
Adjusting low values of serum creatinine concentrations to 0.06 mmol l−1 does not work well when renal function is changing. For example, if a patient’s serum creatinine changes from 0.02 mmol l−1 to 0.04 mmol l−1through a genuine declining renal function, the 0.06 round up method will not allow for this. This could be accommodated by adjusting the value of 0.06 to 0.12 mmol l−1, representing a similar reduction in renal function, but this is awkward. An alternative approach would be to incorporate a correction factor (CF) into the Cockcroft and Gault equation to allow for patients with low values of serum creatinine, as follows:
 |
where
 |
where SCr1 is the baseline steady-state value of serum creatinine (taken prior to starting or at initiation of aminoglycoside therapy). The CF is only influential if SCr1is less than 0.06 mmol l−1, i.e. if SCr1≥0.06 mmol l−1 then CF is set at unity.
In conclusion the mean population values of Vd and C of gentamicin dosed once daily are similar to those described by others. This is the first time that Vd of gentamicin has been reported to decrease in patients with decreased renal function. The Cockcroft and Gault method of calculating creatinine clearance does not appear to perform well at low values of serum creatinine concentrations. Two methods of ‘correcting’ the Cockcroft and Gault method are proposed to account for this. We recommend the use of a correction factor rather than using the ‘0.06 round up’ rule, in patients with changing renal function.
Appendix
Equation 1
Cockcroft and Gault formula [19]
 |
where TBW is the total body weight of the patient.
Equation 2
Pesola adjustment [20]
 |
where LBW is a lean body weight using the equation of Devine [26] (see Equation 3)
Equation 3
Lean body weight (LBW) equation [27]
 |
Dosing weight (DWT)
Dosing weight (DWT) = min{LBW, TBW}
Dosing weight (DWT) is the lower of lean body weight (LBW) or total body weight (TBW), where LBW is calculated using the Devine [27] equation (see Equation 3)
Equation 4
CLCr,unadjusted
 |
CLCr,adjusted is the CLCr estimated using the standard Cockcroft and Gault formula [19] as adjusted by Pesola [20] however uses dosing weight (DWT) in the place of lean body weight (LBW) (see Equation 3)
Equation 5
ClCr,adjusted-Duffull et al. [19]
 |
Same as equation 4, where values of serum creatinine concentrations less than 0.06 mmol l−1 are set at 0.06 mmol l−1.
References
- 1.Begg EJ, Barclay ML. Aminoglycosides—50 years on. Br J Clin Pharmacol. 1995;39:597–603. [PMC free article] [PubMed] [Google Scholar]
- 2.Munckhof W, Grayson ML, Turnidge JD. A meta-analysis of studies on the safety and efficacy of aminoglyocisdes given either as once daily or as divided doses. J Antimicrob Chemother. 1996;37:645–663. doi: 10.1093/jac/37.4.645. [DOI] [PubMed] [Google Scholar]
- 3.Ali MZ, Goetz MB. A meta-analysis of the relative efficacy and toxicity of single daily dosing versus multiple daily dosing of aminoglycosides. Clin Infect Dis. 1997;24:796–809. doi: 10.1093/clinids/24.5.796. [DOI] [PubMed] [Google Scholar]
- 4.Bailey TC, Little JR, Littenburg B, Reichley RM, Dunagan WC. A meta-analysis of extended-interval dosing versus multiple daily dosing of aminoglycosides. Clin Infect Dis. 1997;24:786–795. doi: 10.1093/clinids/24.5.786. [DOI] [PubMed] [Google Scholar]
- 5.Barza M, Ioannidis JP, Cappelleri JC, Lau J. Single or multiple daily doses of aminoglycosides: a meta-analysis. Br Med J. 1996;312:338–344. doi: 10.1136/bmj.312.7027.338. [DOI] [PMC free article] [PubMed] [Google Scholar]
- 6.Hatala R, Dinh T, Cook DJ. Once-daily aminoglycoside dosing in immunocompetent adults: a meta-analysis. Ann Intern Med. 1996;124:717–725. doi: 10.7326/0003-4819-124-8-199604150-00003. [DOI] [PubMed] [Google Scholar]
- 7.Galloe AM, Graudal N, Christensen HR, Kampmann JP. Aminoglycosides: single or multiple daily doisng—a meta-analysis on efficacy and safety. Eur J Clin Pharmacol. 1995;48:39–43. doi: 10.1007/BF00202170. [DOI] [PubMed] [Google Scholar]
- 8.Hatala R, Dinh TT, Cook DJ. Single daily dosing of aminoglycosides in immunocompromised adults: a systematic review. Clin Infect Dis. 1997;24:810. doi: 10.1093/clinids/24.5.810. [DOI] [PubMed] [Google Scholar]
- 9.Freeman CD, Strayer AH. Mega-analysis of meta-analysis: an examination of meta-analysis with an emphasis on once-daily aminglycoside comparative trials. Pharmacotherapy. 1996;16:1093–1102. [PubMed] [Google Scholar]
- 10.Ferriols-Lisart F, Alos-Alminana M. Effectiveness and safety of once daily aminoglycosides: a meta-analysis. Am J Health-Syst Pharm. 1996;53:1141–1150. doi: 10.1093/ajhp/53.10.1141. [DOI] [PubMed] [Google Scholar]
- 11.Nicolau DP, Freeman CD, Belliveau PP, Nightingale CH, Ross JW, Quintiliani R. Experience with a once-daily aminoglycoside program administered to 2184 adult patients. Antimicrob Agents Chemother. 1995;39:650–655. doi: 10.1128/AAC.39.3.650. [DOI] [PMC free article] [PubMed] [Google Scholar]
- 12.Begg EJ, Barclay ML, Duffull SB. A suggested approach to once-daily aminoglycoside dosing. Br J Clin Pharmacol. 1995;39:605–609. [PMC free article] [PubMed] [Google Scholar]
- 13.Prins JM, Buller HR, Kuijper EJ, Tange RA, Speelman P. Once versus thrice daily gentamicin in patients with serious infections. Lancet. 1993;341:335–339. doi: 10.1016/0140-6736(93)90137-6. [DOI] [PubMed] [Google Scholar]
- 14.Morike K, Schwab M, Klotz U. Use of aminoglycosides in elderly patients—pharmacokinetic and clinical considerations. Drugs and Aging. 1997;10:259–277. doi: 10.2165/00002512-199710040-00003. [DOI] [PubMed] [Google Scholar]
- 15.Smaill F. Commentary: single daily dose of aminoglycoside is the preferred mode of administration. Br Med J. 1996;312:344–345. [Google Scholar]
- 16.Begg EJ, Duffull SB, Kirkpatrick CM. Exposure of aminoglycosides should be monitored during treatment. Br Med J. 1996;313:491. doi: 10.1136/bmj.313.7055.491. [DOI] [PMC free article] [PubMed] [Google Scholar]
- 17.Burton ME, Brater DC, Chen PS, Day RB, Huber PJ, Vasko MR. A bayesian feedback method of aminoglycoside dosing. Clin Pharmacol Ther. 1985;37:349–357. doi: 10.1038/clpt.1985.51. [DOI] [PubMed] [Google Scholar]
- 18.Duffull SB, Kirkpatrick CMJ, Begg EJ. Comparison of two Bayesian approaches to dose-individualisation for once-daily aminoglycoside regimens. Br J Clin Pharmacol. 1997;43:125–135. doi: 10.1046/j.1365-2125.1997.05341.x. [DOI] [PMC free article] [PubMed] [Google Scholar]
- 19.Cockcroft DW, Gault MH. Prediction of creatinine clearance from serum creatinine. Nephron. 1976;16:31–41. doi: 10.1159/000180580. [DOI] [PubMed] [Google Scholar]
- 20.Pesola GR, Akhavan I, Madu A, Shah NK, Carlon GC. Prediction equation estimates for creatinine clearance in the intensive care unit. Intensive Care Med. 1993;19:39–43. doi: 10.1007/BF01709276. [DOI] [PubMed] [Google Scholar]
- 21.Klotz U, Godel A. Once-daily dosing of gentamicin: experience with therapeutic drug monitoring and bayesian pharmacokinetics. Ther Drug Monit. 1994;16:534–535. [PubMed] [Google Scholar]
- 22.Dager WE. Aminoglycoside pharmacokinetics: Volume of distribution in specific adult patient subgroups. Ann Pharmacother. 1994;24:944–951. doi: 10.1177/106002809402800719. [DOI] [PubMed] [Google Scholar]
- 23.Reuning RH, Sams RA, Notari RE. Role of pharmacokinetics in dosage adjustment: apparent volume of distribution of digoxin. J Clin Pharmacol. 1973;13:127–141. doi: 10.1002/j.1552-4604.1973.tb00074.x. [DOI] [PubMed] [Google Scholar]
- 24.Koup JR, Jusko WJ, Elwood CM, Kohli RK. Digoxin pharmacokinetics: Role of renal failure in dosage regimen. Clin Pharmacol Ther. 1975;18:9–20. doi: 10.1002/cpt19751819. [DOI] [PubMed] [Google Scholar]
- 25.Winter ME. Basic clinical pharmacokinetics. 3. Vancouver: Applied Therapeutics Inc; 1994. [Google Scholar]
- 26.Duffull SB, Begg EJ, Robinson BA, Deely JJ. A sequential bayesian algorithm for dose individualisation of carboplatin. Cancer Chemother Pharmacol. 1997;39:317–326. doi: 10.1007/s002800050578. [DOI] [PubMed] [Google Scholar]
- 27.Devine BJ. Gentamicin therapy. Drug Intell Clin Pharm. 1974;8:650–655. [Google Scholar]
- 28.Morse WI, Soeldner SJ. The composition of adipose tissue and the nonadipose body of obese and nonobese man. Metabolism. 1963;12:99–107. [Google Scholar]
- 29.Bauer LA, Drew Edwards WA, Patchen Dellinger E, Simonowitz DA. Influence of weight on aminoglycoside pharmacokinetics in normal weight and morbidly obese patients. Eur J Clin Pharmacol. 1983;24:643–647. doi: 10.1007/BF00542215. [DOI] [PubMed] [Google Scholar]