Abstract
Background and purpose:
Glucokinase (GK) is the rate-limiting enzyme of hepatic glucose metabolism and acts as a sensor for glucose-stimulated insulin release in β-cells. Here we examine whether the lowering of blood glucose levels in the rat by small molecule glucokinase activators (GKAs) can be predicted from in vitro enzyme potencies and plasma compound exposure.
Experimental approach:
We developed an insulin resistant and hyperinsulinemic animal model, the high fat fed female Zucker (fa/fa) rat (HFFZ), and measured the acute in vivo glucose-lowering efficacy of a number of GKAs in an oral glucose tolerance test.
Key results:
Four GKAs (at 1 to 30 mg kg−1), with different in vitro enzyme potencies, dose-dependently improved oral glucose tolerance in HFFZ rats (10–40% decrease glucose area under the curve (AUC) from vehicle control). The extent of glucose lowering, or the pharmacodynamic (PD) effect, of a GKA was directly related to the total compound concentration in the plasma; the pharmacokinetic (PK) measurement. This PK-PD relationship was extended across a series of GKAs by accounting for differences in protein binding and in the in vitro potency.
Conclusions and implications:
When the unbound GKA compound level is greater than the in vitro enzyme potency there was significant blood glucose lowering in vivo. This latter relationship was upheld in non-diabetic Wistar rats orally dosed with a GKA. The robust and predictive nature of the PK-PD relationship for GKAs may prove of value in testing these agents in early human clinical studies.
Keywords: glucokinase, diabetes, glucose, glucokinase activators, liver, pancreas, 3Rs
Introduction
In type II diabetes, the progressive nature of the deterioration in metabolic control of blood glucose levels is due to failure of the pancreas to secrete sufficient amounts of insulin to overcome peripheral insulin resistance and failure to normalize hepatic glucose balance owing to incomplete suppression of hepatic glucose production (Zimmet et al., 2003; Basu et al., 2004; Xu, 2004; Leighton et al., 2005). However, even when combinations of current anti-hyperglycaemic drugs (e.g. sulphonylureas, peroxisome proliferator-activated receptor-γ agonists) are used to treat type II diabetics, these treatments are often inadequate (Zimmet et al., 2003). Consequently, there is an unmet need for therapeutic agents that deliver superior glycaemic control.
Glucokinase (GK) catalyses the conversion of glucose to glucose-6 phosphate and is expressed in pancreatic β-cells and liver cells. This enzyme catalyses a key regulatory step in the liver to control formation of glycogen (Agius et al., 1996) and acts as a sensor for glucose-stimulated insulin release in β-cells (Meglasson and Matschinsky, 1986). Heterozygous loss-of-function mutations in the GK gene in man lead to a form of diabetes mellitus, known as maturity-onset diabetes of the young, type II (Velho et al., 1996; Matschinsky and Magnusen, 2004). There are rare activating mutations in the human GK gene that cause significant hyperinsulinaemia associated with significant blood glucose lowering (Cuesta-Muñoz et al., 2004). A case has emerged for a significant decrease in the GK-catalysed reaction being primarily responsible for the inappropriate lack of pancreatic insulin secretion and abnormal hepatic glucose balance in human type II diabetes (Basu et al., 2004; Leighton et al., 2005). Thus, most clinical data are consistent with the view that activating GK will cause pronounced blood glucose lowering in type II diabetes in humans.
The difference in the kinetics, from hexokinase (I–III), means that GK (hexokinse IV) has positive cooperativity for glucose, lower affinity for glucose (concentration of substrate at 50% maximal velocity (S0.5) of about 8 mM) and lack of product inhibition by glucose-6 phosphate. Recently, small molecule activators of GK have been described (Grimsby et al., 2003; Brocklehurst et al., 2004; Kamata et al., 2004; Efanov et al., 2005). All GK activators (GKAs), reported to date, decrease S0.5 in vitro (10–13), but some GKAs (Grimsby et al., 2003; Kamata et al., 2004; Efanov et al., 2005) also increase the enzyme maximal catalytic activity (Vmax). Acute oral administration of GKAs to non-diabetic rodents or rodent models of diabetes significantly lower blood glucose levels and/or improve glucose tolerance at doses of between 10 and 50 mg kg−1 (Grimsby et al., 2003; Efanov et al., 2005). However, there are no reports of a systematic study of the relationship between in vitro activation of GK by small molecules, and their blood glucose-lowering efficacy in vivo.
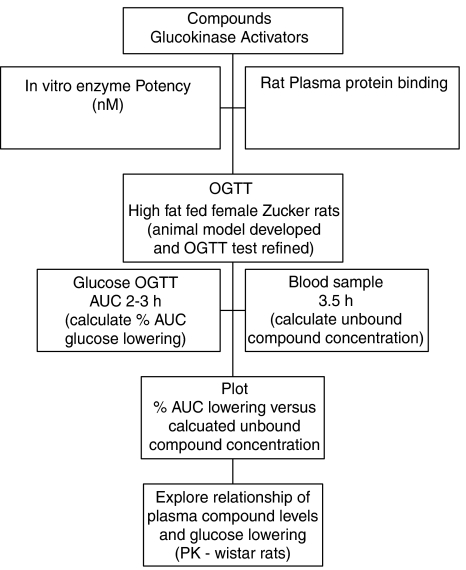
We developed an insulin-resistant and hyperinsulinaemic animal model, the high-fat fed female Zucker (fa/fa) rat (HFFZ), and measured the in vivo glucose-lowering efficacy of a number of GKAs (see Table 1) in an oral glucose tolerance test (OGTT) (McKerrecher et al., 2005). All these experiments made full use of reduction, replacement and refinement (3Rs) strategies to minimize the number of animals used and maximize the output from results (Stokes et al., 2002). The overall aim of these experiments was to understand the relationship between the in vitro properties of GKA compounds (e.g. potency) and plasma compound exposure and in vivo efficacy, such that a practical and predictive model for in vivo glucose lowering could be derived (see Figure 1 for plan of work). This information could be used to predict the required exposures for GKAs to give meaningful glucose-lowering efficacy in humans.
Table 1.
Glucokinase activators' potency (nM), percentage rat plasma unbound and chemical structures
Figure 1.
Schematic flow diagram of plan of work.
Methods
Nomenclature of novel glucokinase activator compounds
GKA20, 6-[(3,5-diisopropoxybenzoyl)amino]nicotinic acid; GKA30, 6-({3-isopropoxy-5-[(1S)-2-methoxy-1-methylethoxy]benzoyl}amino)nicotinic acid; GKA31, 6-({3-isopropoxy-5-[(1S)-1-methyl-2-phenylethoxy]benzoyl}amino)nicotinic acid; and GKA50, 6-({3-[(1S)-2-methoxy-1-methylethoxy]-5-[(1S)-1-methyl-2-phenylethoxy]benzoyl}amino)nicotinic acid (see Table 1 for chemical structures).
Experimental animals and dietary treatment
All procedures were in accordance with the Animals (Scientific Procedures) Act 1986. Female obese Zucker (fa/fa) rats (∼300 g) and female Wistar rats (225–300 g) were supplied from AstraZeneca Biological Animal Breeding Unit and were acclimatized in communal cages at 20±1°C with a 12 h light–dark cycle (lights on 0600 hours) for 7 days and had access to a standard maintenance diet (SDS Rat and Mouse No. 1; SDS Special Diets, Witham, UK).
Development of animal model
A total of 36 female obese Zucker (fa/fa) rats, at 7 weeks of age, were divided into three groups. Each group was fed one of the following diets: maintenance (SDS Rat and Mouse No. 1, 2.61 kcal g−1 of ration or 9.2% kcal of fat in ration); breeding (SDS Rat and Mouse No. 3, 2.7 kcal g−1 of ration or 14.4% kcal of fat in ration) and high saturated (Rodent Diet D12451, 4.73 kcal/g ration or 44.9% kcal of fat in ration). The breeding and high saturated fat diets have a higher fat content than the routinely used maintenance diet. The former diets were tested for their ability to decrease whole-body insulin sensitivity. Body weights and blood glucose levels were monitored routinely. A weekly OGTT was carried out in each group.
Glucose and compound levels in Wistar rats
Female Wistar rats were divided into four groups (n=6) before being given a single acute oral administration of GKA50 at 3, 10 or 30 mg kg−1 or vehicle (hydroxypropyl methylcellulose Tween (HPMC)). Blood glucose levels were determined at 60 min after dosing with an Accu-chek glucometer (Roche, Mannheim, Germany) from tail-bled samples (made with a needle stick). Blood was sampled from a superficial blood vessel in the tails of the rat 90 min after dosing, and plasma was immediately separated by centrifugation at 3000 g for 15 min and stored at −20°C until analysed. As intravenous blood sampling raises blood glucose levels, the blood sample for compound determination was taken after all blood glucose measurements were made (see also OGTT below).
In vitro enzyme activity determination for GKAs
Recombinant human pancreatic GK activity was measured spectrophotometrically (340 nm, room temperature, Multiskan Ascent) in an assay mixture containing 25 mmol l−1 KCl, 25 mmol l−1 HEPES (pH 7.1), 5 mmol l−1 β-mercaptoethanol, 1 mmol l−1 NADP, 1 mmol l−1 ATP, 2.5 mmol l−1 MgCl2, 2 U ml−1 glucose 6-phosphate dehydrogenase and 60 nmol l−1 GK, as described previously (Brocklehurst et al., 2004). The enzyme potency was determined from the rate of formation of NADPH at a constant concentration of glucose (5 mM), and the concentration of compound that caused half-maximal activation determined the potency of the compound. Potency values for some GKA compounds have been reported from the rate of formation of NADPH at a glucose concentration of 10 mM (McKerrecher et al., 2006). Compound potencies are broadly similar for activation of recombinant human and rat glucokinase.
Measurements of plasma protein binding and compound levels
The plasma protein binding of compounds was measured using equilibrium dialysis technique (Oravcova et al., 1996). Compound was dialysed at a concentration of 20 μM for 18 h at 37°C with rat albumin and isotonic phosphate buffer (pH 7.4). A Spectrum/Por 20-cell equilibrium dialyser was used together with Teflon, semi-micro-dialysis cells and Spectrum/Por2 membranes discs with a molecular weight cutoff of 12–14 000 Da, 47 mm (PerBio Science UK, Ltd, Tattenhall, Cheshire, UK). Plasma and buffer samples were removed following dialysis and analysed using high-performance liquid chromatography and UV and mass spectrometry detection to give the percentage free level in plasma. Compound protein binding was similar across Wistar and Zucker rats. Planetary Milled compounds (15 min, 500 r.p.m.), 5 Zirconium balls, in a pulsette 7 mill (Glen Creston Ltd, Stanmore, Middlesex, UK) were suspended in 0.5% HPMC and dosed to Wistar rats at doses between 1 and 10 mg kg−1. Samples were obtained from tail vein, using a 22-guage needle at the required time point or taking a blood sample via cardiac puncture at termination of the animal. Samples were stored in Starstedt Multivette (ethylenediaminetetraacetic acid) and kept at 4°C before centrifugation at 3000 r.p.m. within 15 min of sampling. The plasma was stored at −20°C. Rat plasma was analysed using protein precipitation followed by high-performance liquid chromatography with tandem mass spectrometry detection. The concentrations of test samples were determined from the ratio of test sample to the peak height of the internal standard. The concentration of the test sample was calculated with reference to a standard curve relating to the ratio to the concentration prepared by using known concentrations of test sample added to samples of control rat plasma with a known concentration of internal standard compound.
Oral glucose tolerance test
OGTTs were carried out on female Zucker obese (fa/fa) rats. At 10 weeks of age, the rats were fed a high-fat diet (45% kcal fat). On the third week on the high-fat diet, the rats were fasted at 0600 hours. A test compound or a vehicle (HPMC), as described above, was given orally at 0800 hours or 120 min before oral administration of a glucose solution (2 g kg−1). Blood glucose levels were measured using an Accu-chek glucometer from tail-bled samples. These levels were measured before compound administration, time zero (before glucose administration at 1000 hours) and at 20, 40 and 60 min after glucose administration. The total area-under-the-curve (AUC) for 60 min was calculated from time zero, the time when glucose was administered. Per cent inhibition is determined as the percentage decrease in AUC in compound-administered rats compared with the vehicle control group. At termination, 3.5 h after compound administration, a cardiac blood sample was taken to determine the blood level compound concentrations.
Early on, conventional study powering (80% power, 95% confidence limits), with the parameter magnitude and variance seen in these studies indicated n=8 (for both control (vehicle) and test (compound) groups) was necessary to detect a 15% significant decrease in AUC values. As multiple compounds were tested in a single experiment and tested against a control group, the number in the control group is normally increased by 2 per additional test group (to compensate for the number of times the data set is interrogated against the control data set). We used historical control group results and give a weighting of two-thirds to this historical statistic and one-third weighting to concurrent control group (n=4). This method results in a reduction in animal numbers of over 45%; a further benefit of using this large population is that variance sigma is significantly reduced. This impacts on the total number of animals that have to be used in each test group to maintain 80% powering at the 15% effect level (n=5).
Insulin measurements
Plasma insulin was determined by radioimmunoassay using a specific kit (Mercodia, Uppsala, Sweden).
Statistics
All results are presented as mean values±s.e.m. for the indicated number of experiments.
AUC is calculated using a cumulative triangulation calculation with data frequency of 0, 0.33, 0.66 and 1 h.
AUC is calculated as follows;
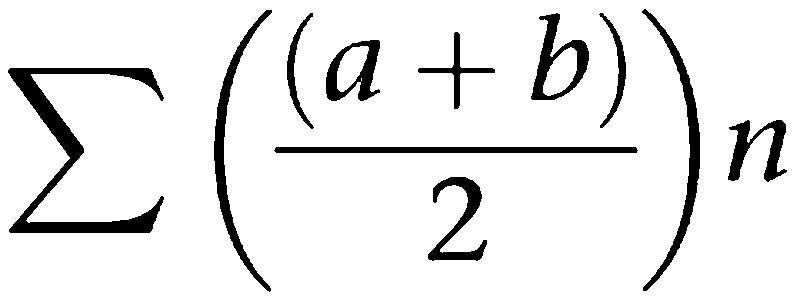 |
n=number of measurements taken.
Statistical significance was evaluated using one-sided Student's, unequal variance t-test.
Results
Properties of GKAs
The potency of GKA20 and GKA30 was, on average, about 27 times less than that of GKA31 and GKA50; however, GKA20 and GKA30 had much reduced rat plasma protein binding (Table 1). Thus, these compounds were selected as they represented different balances of in vitro potency, exposure and percentage unbound in the blood.
Glucose tolerance in obese female Zucker (fa/fa) rats fed various diets
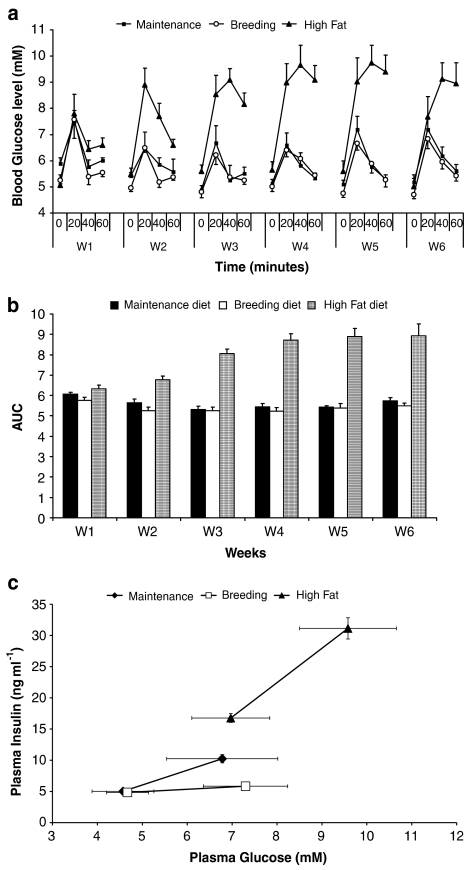
We have developed a rat model of impaired glucose tolerance by feeding 7-week-old female obese Zucker (fa/fa) rats diet high in fat content. The body weight gain of rats fed a high-fat diet was significantly increased (average gain was about 25 g) up to week 3 of the study compared to rats fed maintenance or breeding diets (results not shown). Thereafter, the body weight gain reached a plateau in the high-fat fed rats. Weekly OGTTs were not different in female obese Zucker rats fed either maintenance or breeding diets (Figure 2a). However, 2 weeks (but not 1 week) after feeding a high-fat diet, there was a marked increase in the OGTT AUC values, which reached a plateau at week 3 (Figure 2b).
Figure 2.
Effect of chronic feeding of various diets on OGTT and plasma insulin levels in female Zucker (fa/fa) rats. (a) Weekly (W) OGTTs were performed in HFFZ rats fed maintenance, breeding and high-fat diets. (b) Changes in blood glucose concentrations and the weekly (W) calculated AUC values are reported. Results are means±s.e. for at least five individual experiments. (c) Comparison of plasma insulin and blood glucose levels before and 20 min after an OGTT in female Zucker fa/fa rats fed on maintenance, breeding or high-fat diet (i.e. after being on diets for 6 weeks).
After 6 weeks on the respective diets, the animals were split into two equal groups, of which one group had insulin measured before and 20 min after an oral glucose load (Figure 2c), and the other group had a 60-min OGTT (Figure 2a, W6). Basal insulin values (ng ml−1), measured before commencement of the OGTT, were significantly increased in the high-fat fed rats (16.77±0.29, P<0.001) compared with values from rats on maintenance (5.02±0.08) or breeding (4.84±0.04) diets (Figure 2c). Peak insulin values (ng ml−1), measured at the 20-min time point, were significantly increased in rats fed diets high in fat content (31.14±0.69, P<0.001) and maintenance diet (10.25±0.27, P<0.001), compared with values from rats on the breeding diet (5.84±0.2) (Figure 2c).
GKA compounds effects on OGTT
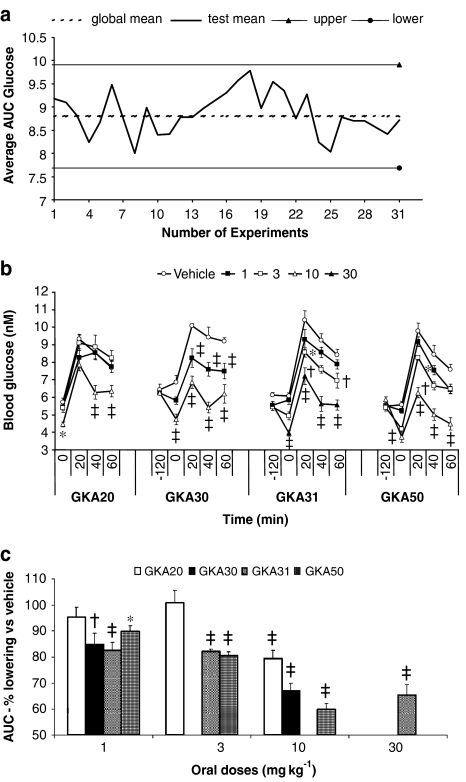
GKA compounds (Table 1) were tested for glucose-lowering efficacy in the HFFZ rat. Compounds were orally administered, at various doses, followed 120 min later by an oral glucose challenge (2 g kg−1). The area under the glucose excursion curve (AUC) was used to measure efficacy of GKA compounds. Retrospective analysis of vehicle-treated rats showed that OGTT AUC values did not significantly deviate over an extended time period (Figure 3a). This meant that historical results were used to calculate a global mean value for each individual test and so the number in the vehicle-treated group was reduced (see Methods for more detailed discussion).
Figure 3.
Effect of acute oral administration of GKAs on changes in blood glucose levels and global control data in HFFZ rats. (a) Deviations in total control AUC results obtained from independent OGTT experiments and the deviations observed around the global control means (± 1 s.d.). Individual experiments where a global mean value was calculated and compound efficacy was determined are indicated as the number of experiments run. (b) Single acute oral doses (1, 3, 10 or 30 mg kg−1) of GKA20, GKA30, GKA31 and GKA50 or vehicle were administered to high-fat-fed obese female Zucker (fa/fa) rats. Significant differences compared with vehicle control rats: *P<0.05, †P<0.01 and ‡P< 0.001. Results are means±s.e. for at least five individual experiments. (c) The effects of GKAs on percentage decrease of glucose AUC from vehicle control. Significant percentage differences compared with vehicle control rats: *P<0.05, †P<0.01 and ‡P<0.001.
GKA compounds had a significant impact on plasma glucose levels 120 min (basal) after compound administration to HFFZ rats (Figure 3b). Significant basal glucose lowering was observed for GKA20 (10 mg kg−1), GKA30 (1 and 10 mg kg−1), GKA31 (3 and 30 mg kg−1) and GKA50 (3 and 10 mg kg−1) (Figure 3b).
Significant percentage glucose lowering (as measured by change in AUC values from control AUC values) was observed during the OGTT at 10 mg kg−1 for GKA20 and at 1 and 10 mg kg−1 for GKA30 (Figure 3c). The more potent compounds (GKA31 and GKA50), which bound more tightly to rat albumin, gave significant glucose lowering at 1, 3 and 10 mg kg−1 for both GKA31 and GKA50 (Figure 3c).
Exposure and efficacy relationship for GKA compounds
The percentage AUC glucose-lowering effect (% effect) of the GKA compounds (compared with vehicle control values) was calculated and reported as the pharmacodynamic (PD) measurement. Three and a half hours after compound administration, a blood sample was taken and the total plasma compound concentration was measured. This single compound value (for each compound) was considered the measurement of plasma exposure.
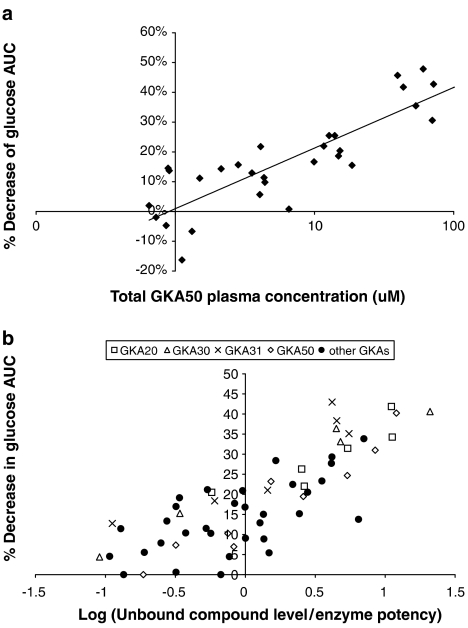
The relationship between total plasma compound levels and efficacy of GKA50, obtained from several OGTT experiments, is shown in Figure 4a. Although this relationship is useful, a greater understanding between the efficacy of a range of GKAs, which had different profiles (i.e. in vitro enzyme potencies, plasma exposures and % unbound), was obtained if the total compound concentration for each GKA compound was corrected for plasma protein binding and this value expressed as a multiple of the in vitro enzyme potency (subsequently plotted on a log scale) (Figure 4b). The OGTT was devised to have 80% power for detecting a 15% change in biological effect (i.e. >15% AUC lowering). This shows that a biologically significant glucose-lowering effect occurred when the log multiple was >0. In other words, the unbound concentration for any compound was greater than its corresponding in vitro enzyme potency. There was a clear link between multiples and glucose-lowering efficacy (% AUC values) for a large number of GKA compounds (Figure 4b).
Figure 4.
Relationship between unbound concentrations of a GKA and blood glucose-lowering efficacy in HFFZ rats. (a) The total plasma concentration of GKA50 was plotted against the percentage decrease in glucose AUC during an OGTT, in HFFZ rats. (b) The log of unbound concentrations (at a single time point) for a large number of GKAs divided by the compounds' enzyme potencies was plotted against the percentage decrease in glucose AUC during an OGTT in HFFZ rats.
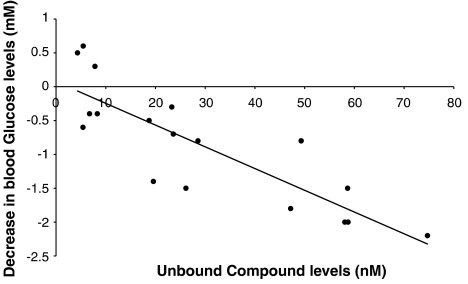
There was a strong correlation (−0.845) between the unbound concentration of GKA50 (at 90 min) and the decrease (at 60 min) in blood glucose levels (from vehicle controls) in Wistar rats given single acute doses of GKA50 (Figure 5).
Figure 5.
Relationship between unbound concentrations of GKA50 and decrease in blood glucose levels in Wistar rats. The total plasma concentration for GKA50 was measured in Wistar rat 90 min after oral administration of GKA50 at 3, 10 or 30 mg kg−1. The decrease in blood glucose is the difference between vehicle and compound treated blood glucose levels in Wistar rats 60 min minus blood glucose levels 60 min after the administration of GKA50.
Discussion
Several GKAs have been described (Grimsby et al., 2003; Brocklehurst et al., 2004; Kamata et al., 2004; Efanov et al., 2005) and the utility of GKAs in type II diabetes has recently been reviewed (Leighton et al., 2005; Matchinsky, 2005; Sarabu and Grimsby, 2005). These chemically distinct compounds have potencies (EC50) in the sub-micromolar range.
Acute oral administration of GKAs to non-diabetic rodents or rodent models of diabetes significantly lowers blood glucose levels and/or improves glucose tolerance at doses of between 10 and 50 mg kg−1 (Grimsby et al., 2003; Efanov et al., 2005). However, there is no report of a systematic study of the relationship between in vitro enzymatic activation of GK by small molecule activators and their blood glucose-lowering efficacy in vivo. This relationship for GKAs is important to be able to predict the temporal relationship for blood glucose-lowering profile versus compound exposure and, hence, doses required for blood glucose-lowering efficacy.
Most of the effects of GKA compound on blood glucose levels have been obtained in mice (Grimsby et al., 2003). However, mice are suboptimal for obtaining sufficient blood samples for simultaneous pharmacokinetic (PK) analysis, whereas rats are more suitable. Traditionally, obese male Zucker (fa/fa) rats are viewed as the more insulin-resistant animal model; however, there are some examples of female Zucker rats, which are obese, being used as an insulin-resistant model (Xu et al., 1998; Obeid et al., 2000; Pan et al., 2001; Etgen et al., 2002). The female Zucker rats used in this study did not exhibit marked insulin resistance as illustrated by good glucose tolerance on a maintenance diet, concomitant with low plasma insulin concentrations (Figure 2).
Rodents can be fed high-fat diets to cause marked insulin resistance and impaired glucose tolerance; however, there are no reports in the literature of female Zucker rats being fed high-fat diets for the purpose of creating an insulin-resistant model. Therefore, we generated a hyperglycaemic, hyperinsulinaemic model with the female Zucker (fa/fa) rat by feeding them a high-fat diet (45% kcal fat; Figure 2a–c). Interestingly, there is a higher basal blood glucose level (hyperglycaemic) in female Zucker rats fed the high-fat diet (Figure 2c). Also, compared with the female Zucker rats fed a maintenance diet (at equivalent blood glucose levels of about 7 mM), the plasma insulin levels are markedly higher for the high-fat fed rats (see the Results section and Figure 2c). Thus, high-fat feeding of female Zucker (fa/fa) rats has induced a marked insulin-resistant state. Feeding female Zucker rats with a diet with a modest increase in fat content (14.4% kcal fat) did not significantly affect whole-body insulin sensitivity. The rats fed a high-fat diet reached a stable insulin-resistant state by about 3 weeks of feeding the high fat and there was a significant increase in basal and glucose-stimulated plasma insulin levels (see the Results section). A major finding, from a 3Rs (reduction, replacement and refinement) perspective, is that consistent in vivo experiments allow the possibility of using historical control results to reduce the overall numbers of animals used within an in vivo test, without compromising the power to detect significant biological effects.
Four GKA compounds, with a range of properties, were tested for in vivo blood glucose-lowering efficacy, with oral OGTT, in HFFZ rats (Figure 3). GKA20 and GKA30 exhibit weak enzyme potency but had higher plasma unbound levels, whereas GKA31 or GKA50 were potent activators but had very low plasma unbound levels (Table 1). There was a dose-dependent decrease in the basal blood glucose levels 2 h after oral administration of the GKAs and before administration of the glucose solution (Figure 3b). How these series of GKA compounds have been optimized, including reporting of in vivo glucose-lowering efficacy for GKA50, has already been described (McKerrecher et al., 2006). Despite the varying profiles for the GKAs, in vivo glucose-lowering efficacy was achieved with lower doses (<10 mg kg−1) for all the GKAs than previously reported for other GKA compounds in the literature (Grimsby et al., 2003; Efanov et al., 2005). The unbound exposure of the GKA compounds was calculated from rat protein binding data and plotted as a multiple of the enzyme potency (Figure 4b). This defined the lower limits of free concentrations of compounds that were required for blood glucose-lowering efficacy. Therefore, when the unbound GKA compound level was greater than the in vitro enzyme potency, then a significant decrease in OGTT AUC was observed (Figure 4b). This finding was tested in Wistar rats given GKA50 (at 3, 10 or 30 mg kg−1) or vehicle. The decrease in blood glucose levels, at 60 min, showed a strong correlation with the unbound GKA50 concentration (measured at 90 min). Significant biological blood glucose lowering (i.e. greater than 1 mM) was observed at unbound concentrations of GKA50 greater than the in vitro enzyme potency (33 nM) (Figure 5). Importantly, the unbound concentration of GKA that was effective for glucose lowering was similar, no matter what the strain of rat (Obese Zucker or Wistar) or the biological test (OGTT versus blood glucose profile). Once this PK–PD relationship was defined, it meant, from the 3Rs perspective, that smaller numbers of animals were used for in vivo efficacy measurements of GKAs based on strict selection criteria for the compound put forward for test (i.e. for compound potency and plasma exposure levels).
In rats and humans, GK catalyses the conversion of glucose to glucose-6 phosphate and is expressed in pancreatic β-cells and liver cells. This enzyme catalyses a key regulatory step in the liver to control formation of glycogen (Agius et al., 1996) and acts as a sensor for glucose-stimulated insulin release in β-cells (Meglasson and Matschinsky, 1986). We know that GKAs activate human and rat GK isoforms in vitro and the % unbound GKA compound concentration can be determined. There is little reason why GKAs should not be predictive for blood glucose lowering in humans, unless GK plays a minor role in regulating carbohydrate metabolism in humans (non-diabetic and type II diabetic). There is clear evidence that GK plays a major role in regulating carbohydrate metabolism in man. Heterozygous loss-of-function mutations in GK gene in man lead to a form of diabetes mellitus, known as maturity-onset diabetes of the young, type II (Velho et al., 1996; Matschinsky and Magnusen, 2004). There are rare activating mutations in the human GK gene that cause significant hyperinsulinaemia associated with significant blood glucose lowering (Cuesta-Muñoz et al., 2004).
In summary, a number of pyridine acid GKA compounds with a range of in vitro enzyme potencies had significant blood glucose-lowering efficacy after oral glucose administration in HFFZ rats. These pyridine acid GKA compounds demonstrated a robust PK–PD relationship that appears to be valid across the series of compounds. GKAs represent candidate drugs for the treatment of type II diabetes. Therefore, the ability to predict compound concentrations necessary to deliver significant glucose lowering may be valuable for human clinical studies with GKAs.
Acknowledgments
We acknowledge the contribution of Nicola Colclough and colleagues in Physical Chemistry in generating some of the results reported in this communication and colleagues in the Chemistry Department for synthesis of compounds.
Abbreviations
- AUC
area under the curve
- GK
glucokinase
- GKA
glucokinase activators
- HFFZ
high-fat-fed female Zucker (fa/fa) rat
- HPMC
hydroxypropyl methylcellulose Tween
- OGTT
oral glucose tolerance test
- PD
pharmacodynamic
- PK
pharmacokinetic
- 3Rs
reduction, refinement and replacement
Conflict of interest
The authors state no conflict of interest.
References
- Agius L, Peak M, Newgard CB, Gomez-Foix AM, Guinovart JJ. Evidence for a role of glucose induced translocation of glucokinase in the control of hepaic glycogen synthesis. J Biol Chem. 1996;271:30479–30486. doi: 10.1074/jbc.271.48.30479. [DOI] [PubMed] [Google Scholar]
- Basu R, Basu A, Johnson CM, Schwenk WF, Rizza RA. Insulin dose–response curves for stimulation of splanchnic glucose uptake and suppression of endogenous glucose production differ in nondiabetic humans and are abnormal in people with type 2 diabetes. Diabetes. 2004;53:2042–2050. doi: 10.2337/diabetes.53.8.2042. [DOI] [PubMed] [Google Scholar]
- Brocklehurst KJ, Payne VA, Davies RA, Carroll D, Vertigan HL, Wightman HJ, et al. Stimulation of hepatocyte glucose metabolism by novel small molecule glucokinase activators. Diabetes. 2004;53:535–541. doi: 10.2337/diabetes.53.3.535. [DOI] [PubMed] [Google Scholar]
- Cuesta-Muñoz AL, Huopio H, Otonkoski T, Gomez-Zumaquero JM, Näntö-Salonen K, Rahier J, et al. Severe persistent hyperinsulinemic hypoglycemia due to a de novo glucokinase mutation. Diabetes. 2004;53:2164–2168. doi: 10.2337/diabetes.53.8.2164. [DOI] [PubMed] [Google Scholar]
- Efanov AM, Barrett DG, Brenner MB, Briggs SL, Delaunois A, Durbin JD, et al. A novel glucokinase activator modulates pancreatic islet and hepatocyte function. Endocrinology. 2005;146:3696–3701. doi: 10.1210/en.2005-0377. [DOI] [PubMed] [Google Scholar]
- Etgen GJ, Oldham BA, Johnson WT, Broderick CL, Montrose CR, Brozinick JT, et al. A Tailored therapy for the metabolic syndrome. The dual peroxisomal proliferator-activated receptor-α/γ agonist LY465608 ameliorates insulin resistance and diabetic hyperglycaemia while improving cardiovascular risk factors in preclinical models. Diabetes. 2002;51:1083–1087. doi: 10.2337/diabetes.51.4.1083. [DOI] [PubMed] [Google Scholar]
- Grimsby J, Sarabu R, Corbett WL, Haynes NE, Bizzarro FT, Coffey JW, et al. Allosteric activation of glucokinase: potential role in diabetes therapy. Science. 2003;301:370–373. doi: 10.1126/science.1084073. [DOI] [PubMed] [Google Scholar]
- Kamata K, Mitsuya M, Nishimura T, Eiki JI, Nagata Y. Structural basis for allosteric activation of the monomeric enzyme human glucokinase. Structure. 2004;12:429–438. doi: 10.1016/j.str.2004.02.005. [DOI] [PubMed] [Google Scholar]
- Leighton B, Atkinson A, Coghlan MP. Small molecule glucokinase activators as novel anti-diabetic agents. Biochem Soc Trans. 2005;33:371–374. doi: 10.1042/BST0330371. [DOI] [PubMed] [Google Scholar]
- Matchinsky FM. Glucokinase, glucose homeostasis, and diabetes mellitus. Curr Diab Rep. 2005;5:171–176. doi: 10.1007/s11892-005-0005-4. [DOI] [PubMed] [Google Scholar]
- Matschinsky FM, Magnusen MA. Glucokinase and glycemic disease: from basics to novel therapeutics. Front Diabetes. 2004;16:42–64. [Google Scholar]
- McKerrecher D, Allen JV, Bowker SS, Boyd S, Caulkett PWR, Currie GS, et al. Discovery, synthesis and biological evaluation of novel glucokinase activators. Bioorganic Med Chem Lett. 2005;15:2103–2106. doi: 10.1016/j.bmcl.2005.01.087. [DOI] [PubMed] [Google Scholar]
- McKerrecher D, Allen JV, Donald CS, Fenwick ML, Grange E, Johnson KM, et al. Design of a potent, soluble glucokinase activator with excellent in vivo efficacy. Bioorganic Med Chem Lett. 2006;16:2705–2709. doi: 10.1016/j.bmcl.2006.02.022. [DOI] [PubMed] [Google Scholar]
- Meglasson MD, Matschinsky FM. Pancreatic islet glucose metabolism and regulation of insulin secretion. Diabetes Metab Res Rev. 1986;2:163–214. doi: 10.1002/dmr.5610020301. [DOI] [PubMed] [Google Scholar]
- Obeid OA, Powell-Tuck J, Emery PW. The postprandial rates of glycogen and lipid synthesis of lean and obese female Zucker rats. Int J Obes Relat Metab Disord. 2000;24:508–513. doi: 10.1038/sj.ijo.0801189. [DOI] [PubMed] [Google Scholar]
- Oravcova J, Böhs B, Linder W. Drug protein binding studies new trends in analytical and experimental methodology. J Chromatogr B. 1996;677:1–28. doi: 10.1016/0378-4347(95)00425-4. [DOI] [PubMed] [Google Scholar]
- Pan SJ, Hancock J, Ding Z, Fogt D, Lee M, Ivy JL. Effects of clembuterol on insulin resistance in conscious obese Zucker rats. Am J Physiol. 2001;280:E554–E561. doi: 10.1152/ajpendo.2001.280.4.E554. [DOI] [PubMed] [Google Scholar]
- Sarabu R, Grimsby J. Targetting glucokinase activation for the treatment of type 2 diabetes – a status review. Curr Opin Drug Discov Dev. 2005;8:631–637. [PubMed] [Google Scholar]
- Stokes WS, Schechtman LM, Hill RN. The Interagency Coordinating Committee on the Validation of Alternative Methods (ICCVAM): a review of the ICCVAM test method evaluation process and current international collaborations with the European Centre for the Validation of Alternative Methods (ECVAM) Alternative Lab Animal. 2002;30 Suppl 2:23–32. doi: 10.1177/026119290203002S04. [DOI] [PubMed] [Google Scholar]
- Velho G, Falk K, Pereseghin G, Hwang JH, Rothman DL, Pueyo ME, et al. Impaired hepatic glycogen synthesis in glucokinase-deficient (MODY-2) subjects. J Clin Invest. 1996;98:1755–1761. doi: 10.1172/JCI118974. [DOI] [PMC free article] [PubMed] [Google Scholar]
- Xu BX, Berkich DA, Crist GH, Lanoue KF. A1 adenosine receptor antagonism improves glucose tolerance in Zucker rats. Am J Physiol. 1998;274:E271–E279. doi: 10.1152/ajpendo.1998.274.2.E271. [DOI] [PubMed] [Google Scholar]
- Xu J. Current and emerging therapies for type 2 diabetes. IDrugs. 2004;7:249–256. [PubMed] [Google Scholar]
- Zimmet P, Shaw J, Alberti GMM. Preventing type 2 diabetes and the dysmetabolic syndrome in the real world: a realistic view. Diabet Med. 2003;20:693–702. doi: 10.1046/j.1464-5491.2003.01052.x. [DOI] [PubMed] [Google Scholar]


