

Abstract
Aims
Thioctic acid (TA), glibenclamide and acarbose are widely used to either alone or concomitantly treat patients suffering from noninsulin-dependent diabetes (NIDDM). This study systematically investigated drug–drug interactions between TA and glibenclamide and TA and acarbose.
Methods
Fourteen male and 10 female healthy volunteers participated a randomized, open three period cross over trial (treatments A–C) followed by a fourth period (treatment D). A baseline profile for plasma insulin and glucose concentrations, variables which served as pharmacodynamic measures, was assessed before entering the trial. Treatments were A=600 mg TA orally, B=3.5 mg glibenclamide orally, C=600 mg TA+3.5 mg glibenclamide, D=600 mg TA+50 mg acarbose. Time courses of R(+)-TA and S(−)-TA as well as glibenclamide concentrations were measured with specific analytical methods.
Results
There was no clinically relevant change of TA enantiomer pharmacokinetics by glibenclamide or acarbose. Also, glibenclamide pharmacokinetics were not altered by TA to a clinically meaningful extent. Plasma insulin and glucose concentrations did not indicate an interaction between TA and glibenclamide or TA and acarbose. Glibenclamide had the expected effect on insulin and glucose levels independent of comedication. There were only minor and short lasting adverse events with the majority being (expected) hypoglycaemic symptoms occurring during the treatments with glibenclamide.
Conclusions
Coadministration of single doses of TA and glibenclamide or TA and acarbose does not appear to cause drug–drug interactions.
Keywords: acarbose, α-lipoic acid, enantiomers, glibenclamide, glucose, healthy volunteers, insulin, interaction, thioctic acid
Introduction
The physiological form of thioctic acid (synonymous with α-lipoic acid) is widely distributed among plants, microorganisms and animals. Thioctic acid (TA) is a racemate containing R(+)-TA and S(−)-TA. There are a number of mechanisms of action which may be instrumental in the treatment of tissue damage caused by hyperglycaemia: both enantiomers show activity as radical scavengers and block the glycosylation of proteins [1, 2]. Thioctic acid is able to enhance insulin-stimulated glucose disposal in noninsulin-dependent diabetes mellitus [3]. Thioctic acid is used for the treatment of paresthesias and neuropathic pain caused by diabetic polyneuropathy. Recent controlled trials have confirmed that long-term administration of a daily dose of 600 mg thioctic acid can improve symptoms of peripheral and autonomic neuropathy in diabetes mellitus [4, 5]. TA has been studied using an enantioselective h.p.l.c. method [6]. The absolute bioavailability from solid oral dosage forms is 25% for the R(+)- and 20% for the S(−)-enantiomer. Terminal plasma elimination half-life is 0.35 h and very similar for both enantiomers. Most of the compound absorbed is metabolized and is excreted in urine after β-oxidation and methylation.
Glibenclamide is another widely used antidiabetic of the substituted sulphonylurea type. Glibenclamide is a member of the second generation of hypoglycaemic sulphonylureas with a considerably higher activity than older compounds. Both, pancreas beta cell function and insulin action in the periphery are improved, thus reducing elevated glucose plasma concentrations [7]. Glibenclamide kinetics show a rapid and complete absorption from the gastrointestinal tract. tmax occurs 1.4 to 3.5 h after ingestion by fasted subjects. Its plasma elimination half-life is 1.5 μp to 5 h whereas its hypoglycaemic activity can be demonstrated for a much longer time [7, 8].
Acarbose is a further drug used for the treatment of hyperglycaemia. It consists of an oligosaccharide which reversibly inhibits intestinal α-glucosidase enzymes thus slowing the formation and absorption of monosaccharides. This mechanism of action appears to reduce postprandial peak concentrations and leads to more constant plasma concentrations of plasma glucose [9]. Orally administered acarbose is barely absorbed and has a systemic availability of 0.5 up to 1.7%. After i.v. administration, it is excreted unchanged via the kidneys [9, 10].
All drugs characterized above are widely used to either alone or concomitantly treat patients suffering from noninsulin dependent diabetes (NIDDM). It can be anticipated that oral TA and glibenclamide or oral TA and acarbose will be used concomitantly to treat NIDDM patients. Therefore, the possibility of drug–drug interactions must be accounted for, particularly hypoglycaemia. The present trial was carried out in order to systematically investigate such potential interactions. We tested the potential interaction of TA and glibenclamide with regard to pharmacokinetics and bioavailability as well as the impact of acarbose on pharmacokinetics and bioavailability of TA. In addition, pharmacodynamic effects during concomitant administration were investigated by monitoring plasma glucose and insulin concentrations.
Methods
Subjects
Fourteen male and 10 female nonsmoking subjects participated in the trial (Caucasian, mean age 27.7 years, range 23–41 years; mean Broca index 0.91, range 0.8–1.09). Body weight was defined within ±20% of normal weight (Broca index 0.8–1.2). Before inclusion the subjects underwent a medical examination comprising physical status, blood chemistry, urinalysis and electrocardiography. A pregnancy test was carried out in female subjects. They were not allowed to use hormonal contraception 2 months prior to inclusion and during the trial. No drugs were allowed for 2 weeks before and during the trial.
The trial was approved by the Ethics Committee of the Medical Faculty of the University of Göttingen. Written informed consent was obtained from each participant.
Protocol
The trial was designed as a randomized, open three period cross over (for treatments A–C) followed by a fourth period (treatment D). Treatments were as follows:
treatment A 600 mg thioctic acid (Thioctacid®, 600 mg tablet, ASTA Medica)
treatment B 3.5 mg glibenclamide (Euglucon®, 3.5 mg tablet, Hoechst AG)
treatment C 600 mg thioctic acid+3.5 mg glibenclamide
treatment D 600 mg thioctic acid+50 mg acarbose (Glucobay®, 50 mg tablet, Bayer AG)
Treatment D was always carried out as the final treatment period in all volunteers. The rationale for this sequence was the multiple dose titration of acarbose. In order to improve tolerability of acarbose, doses were increased stepwise up to the interaction test. Acarbose treatment started with 50 mg in the evening for 2 days, followed by 50 mg twice daily for 2 days and 50 mg three times daily for another 2 days followed by the interaction test which was carried out on the next day. Wash out periods lasted a minimum of 14 days between the treatments. Following the concomitant treatment of TA and acarbose, only plasma concentrations of TA were measured as acarbose has a very low oral bioavailability of <2% [9].
Due to the glucose lowering effect of the medication a continuous infusion of glucose was given for safety reasons. In order to have identical conditions, glucose was infused during each treatment period. For comparison purposes, a baseline was evaluated for glucose and insulin plasma concentrations without concomitant treatment except for the continuous glucose infusion.
Because of the fact that thioctic acid interacts with food [11], all treatments were administered under fasting conditions between 09.00 h and 10.00 h. The medication was administered 2 h after the start of an infusion of 10% glucose solution (infusion rate 250 ml h−1). This infusion lasted for a total of 8 h after intake of medication. Subjects were required to fast from 10 h before the start of blood collection on the respective test day until the 4 h blood sample. Subsequently, they were served a standardized lunch after the 4 h blood sample. In case of symptoms of hypoglycaemia prior to lunch additional i.v. glucose was allowed.
Blood sampling for TA concentrations was performed before and 10, 20, 30, 40, 50 min, 1, 1.25, 1.5, 2, 2.5, 3, 3.5, 4, 5, 6, and 8 h following application (Figures 1a,b). Blood sampling for glibenclamide concentrations was performed before and 20, and 40 min, and 1, 1.5, 2, 2.5, 3, 4, 5, 6, 8, 10, 12, 14, 16, and 24 h following application (Figure 2).
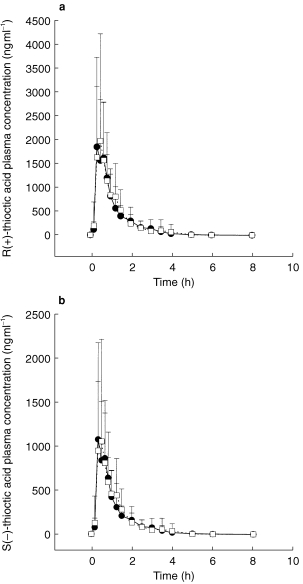
Figure 1.
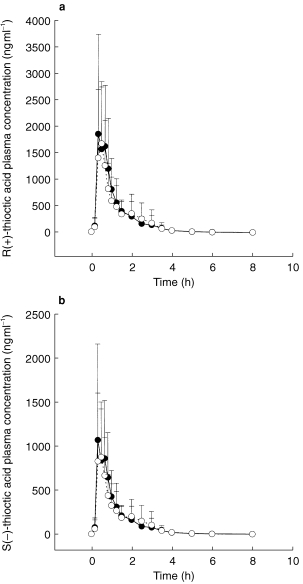
Plasma concentration-time course of R(+)-TA (a) and S(−)-TA (b) following TA administration alone (•) coadministered with glibenclamide (○) (mean±s.d.).
Figure 2.
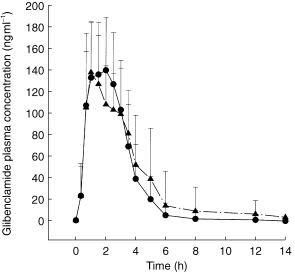
Glibenclamide plasma concentrations following glibenclamide administration alone (•) and glibenclamide+TA (▴) (mean±s.d.).
Plasma concentrations of insulin and glucose were taken as pharmacodynamic variables. Therefore, a baseline profile (without drug treatment, however, under the same conditions as during the test days) was assessed before the volunteers entered the trial. Plasma samples for glucose and insulin were drawn before the start of the glucose infusion, 0 (=predose sample on treatment days), 0.5, 1, 1.5, 2, 2.5, 3, 4, 5, 6, 7, and 8 h after drug administration (Figures 4a,b).
Figure 4.
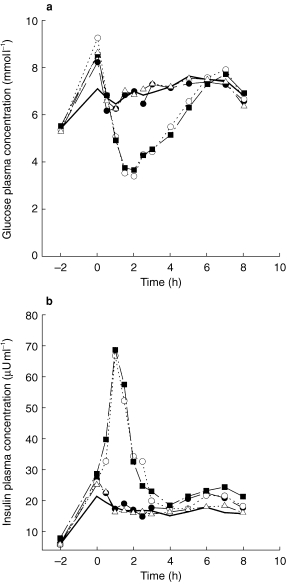
a) Plasma glucose concentration-time course (mean±s.d.) during the respective treatments A (thioctic acid, •), B (glibenclamide, ○), C (TA+glibenclamide, ▪) and D (TA+acarbose, ▵). It should be noted that a number of volunteers needed extra glucose >2 h after glibenclamide dosing (see Methods). b) Plasma insulin concentration-time course (mean±s.d.) during the respective treatments A (thioctic acid, •), B (glibenclamide, ○), C (TA+glibenclamide, ▪) and D (TA+acarbose, ▵), — baseline.
All plasma samples were stored at −20° C until analysis.
Analytical methods
The clinical chemistry screening was carried out by the Department of Clinical Chemistry, University of Göttingen.
The following assays were carried out using standard tests: Plasma glucose was determined by means of Gluc-DH method (37° C, 340 nm) using the autoanalyser Vitalab Selectra (E. Merck, Darmstadt, Germany). The intra-assay CV was 1.6%, the interassay CV<3.2%. Plasma insulin concentrations were measured with a microenzyme assay (MEIA, Imx, Abbott, Wiesbaden, Germany). The normal range of insulin for this assay is 2–25 μU ml−1. The interassay CV was ≤4.4%.
Plasma concentrations of the TA enantiomers were measured by an enantiospecific reversed-phase h.p.l.c. method with fluorescence detection as recently described in great detail [12].
Plasma concentrations of glibenclamide were measured using a selective and sensitive h.p.l.c. method with u.v. detection [13]. The method shows linearity (coefficient of correlation ≥0.9945) over a concentration range of 20 ng ml−1 (intra-assay CV 14.5%) up to 500 ng ml−1 (intra-assay CV 3.66%). The lower limit of quantification was set at 20 ng ml−1.
Pharmacokinetic parameters
The following pharmacokinetic parameters were calculated for R(+)-TA, S(−)-TA and glibenclamide. AUC(0,tlast) is the area under the plasma concentration-time curve from zero up to the last measured point, and AUC(0,∞) is the area under the plasma concentration-time curve extrapolated to infinity. The extrapolated part did not exeed 20% of the total AUC. Cmax is the maximum plasma concentration, tmax the time to reach Cmax and t1/2,z the terminal plasma elimination half-life.
Statistics
Statistical analysis of pharmacokinetic data was performed descriptively. AUC, Cmax and t1/2,z values were logarithmically transformed and geometric means were used to describe mean values. tmax values were summarized as medians.
Lack of pharmacokinetic interaction was investigated by comparing the pharmacokinetics of R(+)- and S(−)-TA after concomitant administration of TA and glibenclamide (treatment C) compared with TA alone (treatment A); the pharmacokinetics of glibenclamide after concomitant administration of thioctic acid (treatment C) and glibenclamide alone (treatment B). Accordingly, the results after concomitant administration of TA and acarbose (treatment D) were compared with those following the intake of thioctic acid alone (treatment A) [14]. Parametric point and interval estimates of the ratios C/A, C/B and A/D were calculated for AUC(0,∞), Cmax and t1/2,z. 90% confidence intervals (CI) served as interval estimates and were determined by the two one-sided t-tests procedure. Lack of interaction was discussed using the limits of 80% and 125% for the 90% CI of AUC ratios and 70% and 143% for the 90% CI of Cmax and t1/2,z ratios [14].
Due to symptoms of hypoglycaemia, 15 out of the 24 volunteers needed additional i.v. glucose beyond 2 h post dose. Therefore, the calculations for glucose and insulin were based on the interval of 0–2 h after administration of the respective medication, however, extra doses of glucose could not be separated for the calculation of the mean glucose time curves. Parametric point and interval estimates were calculated for AUC(0,2 h), Cmax (0,2 h), and Cmin (0,2 h). 90% CI served as interval estimates and were determined by the two one-sided t-tests procedure. Based on the limits of 80% and 125% for the 90% CI of AUC ratios and 70% and 143% for 90% CI of Cmax or Cmin ratios lack of interaction was assessed [14].
Results
Pharmacokinetic results
Mean plasma concentration-time profiles of TA enantiomers from treatments A (TA alone) and C (TA+glibenclamide) are shown in Figure 1a and b. During both treatments TA concentrations increased rapidly after drug administration. The mean plasma concentration-time profiles of TA are almost superimposable. Beyond 8 h post dose, plasma concentrations of either enantiomer were no longer quantifiable. Table 1 shows the pharmacokinetic parameters and the point estimates and 90% CI for R(+)- and S(−)-TA and Table 2 the pharmacokinetic parameters and the point estimates and 90% CI for glibenclamide from treatments A, B, C and D, respectively. There is no clinically relevant change of pharmacokinetics of TA enantiomers caused by glibenclamide even though some parameters exceed the limits of the preset 90% CI. This is the case for the lower limit of AUC, Cmax and t1/2,z of R(+)-TA. tmax of TA is similar for both treatments. Similar findings can be demonstrated for the S(−)-TA enantiomer.
Table 1.
Pharmacokinetic variables of R(+)- and S(−)-TA (geometric mean (CV%) with the exception of tmax which is given as median with minimum and maximum) for the respective treatments TA (A), TA+glibenclamide (C) or TA+acarbose (D) as well as 90% confidence intervals (90% CI), point estimates, and intraindividual variabilities (CVANOVA; parametric analysis, two one-sided t-tests) for R(+)- and S(−)-TA from treatment C vs A and D vs A.
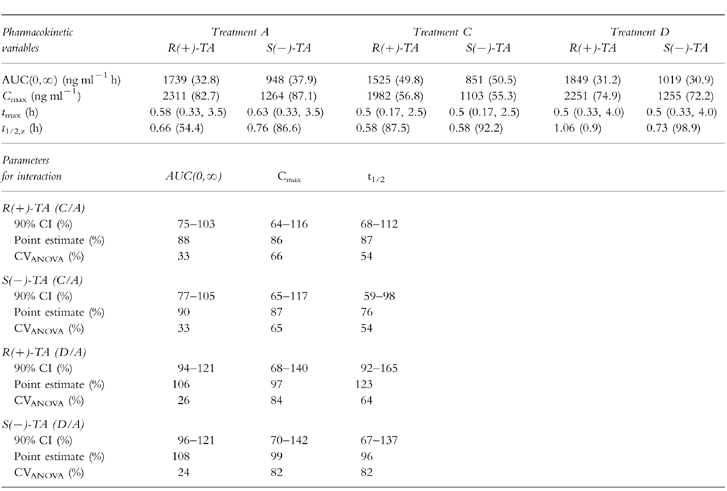
Table 2.
Pharmacokinetic variables of glibenclamide (geometric mean (CV%) with the exception of tmax which is given as median with minimum and maximum) for the respective treatments glibenclamide alone (B) and thioctic acid+glibenclamide (C) as well as 90% confidence intervals (90% CI), point estimates, and intraindividual variabilities (CVANOVA; parametric analysis, two one-sided t-tests) for glibenclamide from treatment B/C.
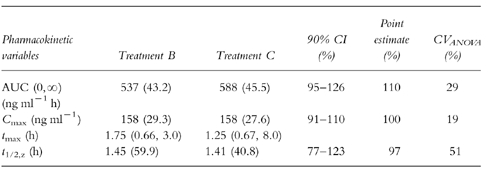
Also, glibenclamide pharmacokinetics were not altered by TA to a meaningful extent. This finding is demonstrated in Figure 2 and Table 2. Cmax is almost identical, whereas AUC just exceeds the upper CI limit. t1/2 is within the limits. tmax differs by 25 min. This finding can be explained by the exceptionally late tmax of two volunteers (individual data not shown).
Mean plasma concentration-time profiles of TA enantiomers during acarbose comedication, shown in Figure 3a,b were almost superimposable. The 90% CI of the pharmacokinetic variables of R(+)-TA were within the preset acceptance limits for AUC, but were not met for Cmax, whereas for t1/2,z only the upper limit was exceeded (Table 1). tmax differed by less than 10 min (Table 1). For S(−)-TA the results were similar.
Figure 3.
Plasma concentration-time course of R(+)-TA (a) and S(−)-TA (b) following TA administration alone (•) and coadministered with acarbose (□) (mean±s.d.).
The results for the pharmacodynamic interaction of thioctic acid and glibenclamide were within the preset limits for AUC and Cmax (data for AUC(0,2 h), Cmax (0,2 h) and Cmin (0,2 h) not shown). The same holds true for insulin concentration confidence intervals (data not shown). Considering the combined administration of TA and acarbose, there was no indication for pharmacodynamic interaction as all confidence intervals for glucose and insulin were within the preset limits (data not shown). Time courses of glucose and insulin plasma concentrations were comparable (Figure 4a,b). Glucose concentrations increased after the start of the glucose infusion within the physiological range and remained stable under baseline conditions (Figure 4a). As expected, glucose concentrations decreased after intake of glibenclamide (treatments B and C) whereas glucose concentrations in the remaining treatment groups were comparable with the baseline. Insulin plasma curves showed a similar time course with a moderate increase of insulin levels after the start of the accompanying glucose infusion and a strong increase following glibenclamide intake. This increase of insulin concentrations lasted for approximately 2 h (Figure 4b).
Adverse events
There were only minor and short lasting adverse events (given in WHO preferred terms). During baseline treatment the volunteers reported headache (5/24 subjects), nausea (1/24) and tremor (1/24). During treatment A (TA) headache (2/24), nausea (1/24), tremor (1/24), dizziness (2/24), and sweating (1/24) were reported. Following administration of glibenclamide (treatment B), the adverse events were headache (2/24), nausea (1/24), tremor (8/24), dizziness (3/24), hot flushes (2/24), nervousness (4/24), palpitation (2/24) and sweating (8/24 subjects). The coadministration of TA and glibenclamide (treatment C) lead to headache (6/24), nausea (3/24), tremor (5/24), dizziness (3/24), hot flushes (1/24), nervousness (2/24), palpitation (3/24) and sweating (9/24 subjects). With the combination of TA and acarbose (treatment D) headache (1/24), tremor (1/24) and dizziness (1/24) were the only adverse events.
Discussion
The assessment of possible drug–drug interactions between TA and glibenclamide and TA and acarbose was guided by the fact that the investigated compounds have a proven therapeutic potential and therefore are being used concomitantly in patients with NIDDM. Interactions have not been systematically assessed so far, particularly with respect to hypoglycemic actions. This study provides the first systematic insight in the interaction of these specific drugs. Even though it would be preferable that interactions of oral antidiabetics were tested during long-term medication in order to take accumulation phenomena into account, it should be noted that trials with healthy subjects on long-term glibenclamide treatment would be difficult to realize for safety reasons. On the other hand, interaction studies such as this one are difficult to handle in a population of elderly patients. Considering the wide spread (and most likely concomitant) use of these compounds for many years, no specific interactions have been reported.
Comparing the pharmacokinetic parameters of TA enantiomers alone with earlier pharmacokinetic data [6] show a very similar order of magnitude. Coadministration of glibenclamide or acarbose did not change TA pharmacokinetics to a clinically relevant extent.
The pharmacokinetic variables of glibenclamide from this study are very similar to the data from the literature [7, 8]. They indicate that TA coadministration does not alter glibenclamide’s pharmacokinetics. The wider confidence intervals of both TA enantiomers are in agreement with the previously demonstrated comparatively high pharmacokinetic variability of this compound [15]. Acarbose plasma kinetics were not assessed in this trial as it is barely absorbed [9].
For the pharmacodynamic variables, glucose and insulin, the effects of monotherapy are not different from those under coadministration: TA and acarbose do not affect glucose and insulin concentrations in healthy volunteers other than the baseline glucose infusion. Glibenclamide has the expected effect on insulin and glucose levels independent from concomitant TA treatment.
Adverse events remained qualitatively and quantitatively within the expected range. There was no hint for serious side-effects under the various drug combinations. It should be noted that the majority of adverse events were most likely linked to the lowering of blood glucose levels by glibenclamide and occurred most often in the treatment groups receiving glibenclamide.
Taken together—with the given above mentioned limitations-coadministration of thioctic acid and glibenclamide or thioctic acid and acarbose does not appear to cause pharmacokinetic or pharmacodynamic interactions.
Acknowledgments
The authors would like to thank the following individuals for their many helpful technical contributions during the course of the study: Mrs B. Krieger, Mrs C. Hagemann, Mr M. Pani and Mr H. Necker, ASTA Medica AG, Frankfurt, Germany.
References
- 1.Suzuki JY, Tsuchyia M, Packer L. Lipoic acid and dihydrolipoic acid are novel antioxidants which react with reactive oxygen species. Free Rad Res Commun. 1991;15:255–263. doi: 10.3109/10715769109105221. [DOI] [PubMed] [Google Scholar]
- 2.Suzuki JY, Tsuchyia M, Packer L. Lipoate prevents glucose-induced protein modifications. Free Rad Res Commun. 1992;17:211–217. doi: 10.3109/10715769209068167. [DOI] [PubMed] [Google Scholar]
- 3.Jacob S, Clancy DE, Schiemann AL, et al. Verbesserung der Glukoseverwertung bei Patienten mit Typ-II-Diabetes mellitus unter α-Liponsäure (Thioctsäure) Diabetes Stoffw. 1996;5(Suppl 3):64–70. [Google Scholar]
- 4.Ziegler D, Hanefeld M, Ruhnau KJ, et al. and the ALADIN study group. Treatment of symptomatic diabetic peripheral neuropathy with the antioxidant α-lipoic acid. Diabetologia. 1995;38:1425–1433. doi: 10.1007/BF00400603. [DOI] [PubMed] [Google Scholar]
- 5.Ziegler D, Schatz H, Conrad F, Gries FA, Ulrich H, Reichel G. Effects of treatment with the antioxidant α-lipoic acid on cardiac autonomic neuropathy in NIDDM patinets. A 4-month randmized controlled multicenter trial (DEKAN study) Diabetes Care. 1997;20:369–373. doi: 10.2337/diacare.20.3.369. [DOI] [PubMed] [Google Scholar]
- 6.Hermann R, Niebch G, Borbe HO, et al. Enantioselective pharmacokinetics and bioavailability of different racemic α-lipoic acid formulations in healthy volunteers. Eur J Pharmaceut Sci. 1996;4:167–174. [Google Scholar]
- 7.Davis SN, Granner DK. Insulin, oral hypoglycemic agents, and the pharmacology of the endocrine pancreas. In: Hardman JG, et al., editors. Goodman and Gilman’s the Pharmacological Basis of Therapeutics. New York: McGraw-Hill; 1996. pp. 1487–1518. [Google Scholar]
- 8.Marchetti P, Giannarelli R, di Carlo A, Navalesi R. Pharmacokinetic optimization of oral hypoglycemic therapy. Clin Pharmacokinet. 1991;21:308–317. doi: 10.2165/00003088-199121040-00006. [DOI] [PubMed] [Google Scholar]
- 9.Clissold SP, Edward C. Acarbose. A preliminary review of its pharmacodynamic and pharmacokinetic properties and therapeutic potential. Drugs. 1988;35:214–243. doi: 10.2165/00003495-198835030-00003. [DOI] [PubMed] [Google Scholar]
- 10.Ahr HJ, Boberg M, Krause HP, et al. Pharmacokinetics of acarbose. Part I. Absorption, concentration in plasma, metabolism and excretion after single administration of [14C]acarbose to rats, dogs and man. Arzneim Forsch/Drug Res. 1989;39:1254–1260. [PubMed] [Google Scholar]
- 11.Gleiter CH, Schug BS, Hermann R, Elze M, Blume HH, Gundert-Remy U. Influence of food intake on the bioavailability of thioctic acid enantiomers. Eur J Clin Pharmacol. 1996;50:513–514. doi: 10.1007/s002280050151. [DOI] [PubMed] [Google Scholar]
- 12.Niebch G, Büchele B, Blome J, et al. Enantioselective high-performance liquid chromatography assay of (+) R- and (−) S-α-lipoic acid in human plasma. Chirality. 1997;9:32–36. doi: 10.1002/(SICI)1520-636X(1997)9:1<32::AID-CHIR7>3.0.CO;2-I. [DOI] [PubMed] [Google Scholar]
- 13.Blume H, Stenzhorn G, Ali SL. Zur Bioverfügbarkeit und pharmakodynamischen Aktivität handelsüblicher Glibenclamid-Fertigarzneimittel, 1. Mitt. Pharmazeut Zeitung. 1985;130:1064. [Google Scholar]
- 14.Steinijans VW, Hartmann R, Huber R, Radtke HW. Lack of pharmacokinetic interaction as an equivalence problem. Int J Clin Pharmacol Ther Toxicol. 1991;29:232–328. [PubMed] [Google Scholar]
- 15.Schug BS, Fieger-Büschges H, et al. Single and multiple dose administration of α-lipoic acid in a replicate study design (Abstract) Eur J Clin Pharmacol. 1996;50:553. [Google Scholar]