

Abstract
Aims
To gauge the effect of disease state and disease progression on the glucuronidation and sulphation of paracetamol (APAP) among HIV-positive patients and patients with AIDS.
Methods
The extent of APAP glucuronidation and APAP sulphation was assessed using a spot urine sample collected 4 h after the oral administration of 500 mg of APAP to 108 patients with AIDS or HIV infection. The molar concentrations of APAP and its glucuronide and sulphate metabolites were determined using a validated h.p.l.c. method and glucuronidation and sulphation indices were constructed using APAP metabolite/APAP molar concentration ratios.
Results
No effect of disease state, AIDS vs asymptomatic HIV positive vs control, on APAP glucuronidation or sulphation was observed. The patient population was studied over time and disease progression also did not significantly alter the calculated glucuronidation and sulphation indices. The effect of the concomitant administration of other therapeutic agents was assessed and in the cross sectional portion of the study dapsone appeared to significantly decrease APAP sulphation as did lamivudine. In the longitudinal portion of the study the latter effect was not observed but zidovudine was seen to increase APAP glucuronidation. The data also indicates that APAP glucuronidation may be reduced in patients who are >10% below their ideal body weight.
Keywords: acquired immunodeficiency syndrome, HIV infections, paracetamol
Introduction
Clinically observed differences in drug disposition and effect are often the result of interindividual variations in drug metabolism. These variations can produce clinically important effects [1]. For example, HIV-positive patients identified as having a slow n-acetyltransferase 2 (NAT2) metabolic phenotype are prone to hypersensitivity to the drug sulphamethoxazole [2] while individuals possessing a poor cytochrome P450 (CYP) isoform CYP 2D6 phenotype react poorly to a number of psychotropic drugs [3].
The genetic bases for the differentiation of humans into fast or slow NAT2 metabolic phenotypes [4] and efficient or poor CYP2D6 metabolic phenotypes [5] have been identified, as have the sources of a number of other polymorphic enzymatic pathways [6]. Assays utilizing allele-specific amplification and restriction fragment length polymorphism analysis are now routinely used to assign metabolic genotypes [4]. In addition, probe drugs can be used for in vivo phenotypic assessments [7, 8]. For example, dextromethorphan has been used to probe CYP2D6 activity [7] and caffeine is an ideal probe for NAT2 [9]. In healthy individuals, there is a concordance between genetic and probe drug determined metabolic phenotypes for CYP2D6 and NAT2 [10, 11].
However, the level of expressed metabolic activity can be affected by environmental factors such as the concomitant intake of multiple medications and/or other xenobiotics [12] as well as nutritional status and diet [13, 14]. A recent study of NAT2 activity in a group of 105 HIV-positive patients and AIDS patients has also demonstrated that disease state can affect enzymatic activity [15]. The fact that a discordance between NAT2 genotype and expressed NAT2 phenotype was observed in a cohort of HIV-positive and AIDS patients should not be surprising since this population requires multiple medications to treat a myriad of illnesses, many of which have an impact on nutrition.
Paracetamol (APAP) is another agent whose metabolism and disposition may be altered in HIV-positive and AIDS patients. The primary metabolic disposition of APAP occurs through glucuronidation and sulphation by UDP glucuronosyl-transferase and sulphotransferase, respectively [16]. Zidovudine (AZT) is also cleared primarily by glucuronidation, and Shriner & Goetz [17] have reported severe APAP-induced hepatotoxicity in an AIDS patient who was also receiving AZT. A competition for glucuronic acid cofactor was suggested as a potential cause of reduced APAP clearance and, thereby, increased hepatotoxicity. However, it has been shown in vitro [18, 19] that different isoforms of UDP glucuronosyltransferase are responsible for the glucuronidation of AZT and APAP, and Burger et al. [20] found no changes in the pharmacokinetics of either drug when coadministered. Metabolic drug interactions would therefore be unexpected.
Another possibility is an alteration in the activities of the UDP glucuronosyl-transferases due to environmental or disease factors. Indeed, APAP has been used as a general probe of environmental effects (smoking) within a healthy population [21]. An effect of disease status on APAP metabolism has also been suggested by Esteban et al. [22], who report that the excretion of APAP glucuronide, expressed as percentage of APAP dose, was decreased, and that of the APAP sulphate conjugate increased in 19 AIDS patients relative to 9 asymptomatic HIV-positive patients or 32 controls.
Here we present the results of a study of APAP metabolism in a population of 105 HIV-infected individuals and includes a longitudinal component.
Methods
Study protocol and subjects
The study protocol was approved by the Ethics Committee of the Montreal General Hospital (MGH). Patients were recruited from the hospital’s Immune Deficiency Treatment Centre on the basis of a previous CD4+cell count between 150 and 250 mm−3, or if CD4+cells accounted for less than 20% of T-lymphocytes. The 108 study participants signed an informed consent before participating. The patients’ medical records were examined thoroughly and their history and physical exam compiled on a case report form; all medications and supplements taken by the patient at the time of testing were carefully recorded. Control subjects were recruited from among laboratory personnel, family and acquaintances, and signed informed consent before participating. A questionnaire was used to collect details of medication, alcohol, tobacco and caffeine intake in controls and patients. Ideal body weight was calculated from height according to Devine [23].
Patients’ medical charts were scrutinized and changes in their medical conditions and CDC stratum were recorded. Disease progression was defined as having occurred in patients who were diagnosed with a new HIV-related or AIDS defining condition between metabolic assessments or whose previously diagnosed condition had become active at the time of the second (or third) test.
Metabolism studies
The glucuronidation and sulphation capacities of the subjects were assessed using APAP as the probe. Spot urine samples were collected 4 h after ingestion of one 500 mg APAP tablet (Atasol Forte®, Frank W. Horner Inc., Montreal, QC, Canada) and the urine samples were stored at −20° C until analysed. No analyte showed appreciable degradation at −20° C over 6 months [24]. The molar urinary APAP, APAP glucuronide and APAP sulphate concentrations were determined by a validated HPLC assay [24] which provided a limit of quantification for APAP of 5 μg ml−1. LOQ for the metabolites was not determined due to their high urinary concentration. The molar ratio of each metabolite to parent constituted the metabolic index.
In order to validate the use of a 4 h spot urine sample, six subjects performed the test from three to eight times. In addition, during one of the determinations, three of the repeat controls collected extra samples at 2, 3, 5 and 6 h after ingesting the tablet. These three subjects were also tested in triplicate within 1 week, during which 0–8 h urine samples were collected.
Data analysis
Data are presented as mean±s.d. The distributions of glucuronidation and sulphation ratios were found to be significantly non-normally distributed (P<0.001 by Kolmogorov-Smirnov test), so nonparametric analyses were used whenever possible. A square-root transformation was found to remove most of the skewness and to bring the distributions sufficiently close to normality (by Q-Q plot) to justify the use of multivariate regression and analysis of variance (anova) when appropriate. One way anova among subgroups was followed, where significant differences were found, by the Tukey-Kramer multiple comparison test provided that Bartlett’s test for homogeneity of variances was not significant. Failure of Bartlett’s test led to the nonparametric Kruskal–Wallis test followed by Dunn’s multiple comparisons test. Two-group comparisons employed Student’s t-test or the Mann–Whitney (nonparametric) test. One-way anova was used to assess the dependence of APAP conjugation on AIDS classification; this was followed by specific contrasts to compare controls with HIV-positives, asymptomatic with symptomatic, and non-AIDS with AIDS patients.
Multivariate regression analysis was applied to determine if concomitant medications had an impact on APAP conjugation. Each of the 15 most commonly taken medications was coded as 1 if the patient were taking that medication and 0 otherwise. A similar process was applied to alcohol, caffeine and tobacco use in which the level of consumption was graded:, e.g. Patients who had never smoked were graded –1, former smokers, light smokers (<10 cigarettes per day) and heavy smokers were graded 0, 1 and 2, respectively.
For longitudinal analysis, changes in the medication during the interval were coded to distinguish among four situations with respect to each medication: never being on the medication during the study, going onto the medication during the interval, discontinuing medication during the interval, and remaining on the medication for the entire time of the study. This four-way classification was used to perform two kinds of tests: one to determine, for each medication, whether patients in any of the four groups experienced significant changes in glucuronidation or sulphation ratios during the interval, and another to determine whether the amount of change in the ratios varied significantly among the four groups.
Results
Subject characteristics
Of the 108 patients studied, 11 were female and all but 14 were Caucasian. Ages ranged from 26 to 74 years (43±10 years). All patients recruited into the study met the initial CD4+criteria of a cell count between 150 and 250 CD4+mm−3. During the 4–8 week period between recruitment and initial phenotyping there were a number of significant fluctuations in individual CD4+cell counts, so at the initiation of the study the CD4+cell counts ranged from 0 to 1029 mm−3 (215±140; mean±s.d.). Liver function tests were normal, with only eight patients exceeding grade 1 elevations in bilirubin (n=4) or aminotransferase (n=4). Forty-six subjects were tested more than once, the mean time between the first and second determinations being 12.6 months.
At the time of the first determination 24 patients were asymptomatic (Centers for Disease Control [25] disease stratum A) and 41 had AIDS (CDC stratum C). The remaining 43 patients, having been diagnosed with an HIV-related but not AIDS-defining disease, were classified as CDC stratum B.
Of the 36 study participants recruited to serve as controls, 14 were female, and all but 6 were Caucasian; ages ranged from 19 to 68 (37±11 years). Four subjects were measured at least three times, up to 60 days apart.
Probe validation
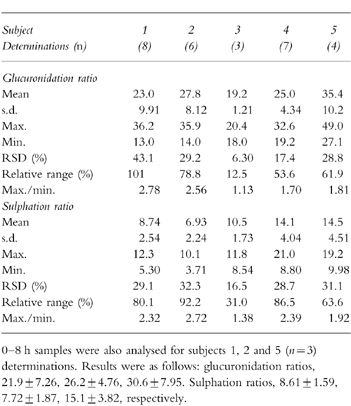
Previous studies of the intersubject variability of APAP conjugation [21] were based on the analysis of a 0–8 h urine sample. In order to validate the use of a 4 h spot sample, three control subjects participated in the test several times as indicated in Table 1. Glucuronidation and sulphation ratios in the 4 h and 0–8 h samples did not differ significantly, Table 1.
Table 1.
Variability within control subjects in their 4 h post-dose glucuronidation and sulphation indices.
In order to assess the impact of urine collection time on the metabolic ratios, i.e. compliance to the study protocol, during the same experiments where 4 h samples were collected, the subjects also provided samples at 2, 3, 5 and 6 h postdose. No significant differences were observed in the calculated glucuronidation and sulphation ratios determined in the 3 h, 4 h, 5 h and 6 h samples, Figure 1. The results indicate that a variation of ±1 h in the time of sampling should not have affected the determination of the metabolic ratios.
Figure 1.
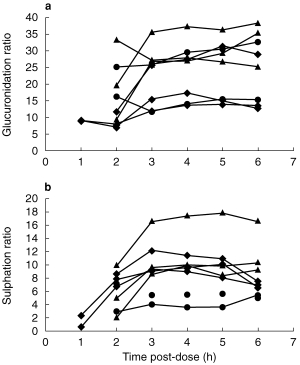
Variation in spot urine paracetamol molar glucuronidation (a) and sulphation (b) ratios over time.
In order to assess interday variations in the glucuronidation and sulphation ratios, 5 control subjects were evaluated on 3–8 nonconsecutive days. The relative range (range/mean) and maximum and minimum interday values of the two metabolic ratios are presented in Table 1. The results indicate that up to a 3-fold interday variation in an individual’s glucuronidation or sulphation ratio should not be considered as meaningful.
Cross-sectional study : disease state
The distribution of glucuronidation and sulphation ratios from 108 patients and 36 control subjects are presented in Figure 2. The frequency of controls was normalized to 108. No significant differences between the seropositive and controls populations were found in either ratio,Table 2. However, both mean conjugation ratios were lower among seropositive subjects than among controls, and these differences approached significance in the case of sulphation (P=0.055).
Figure 2.
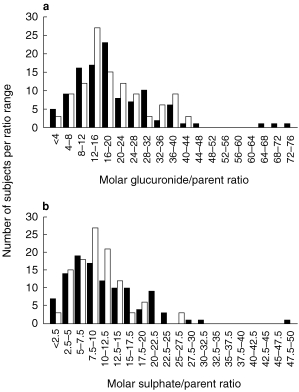
Variation in paracetamol molar glucuronidation (a) and sulphation (b) ratios among 108 HIV positive patients (▪) vs. 36 controls (□, normalized data).
Table 2.
Summary of glucuronidation and sulphation ratios from 108 HIV-positive patients, also subdivided into non-AIDS (n=67) and AIDS (n=41), and 36 control subjects.
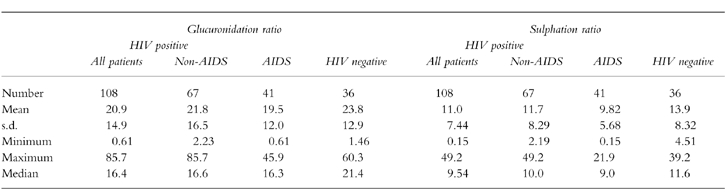
No significant differences in either ratio were observed when patients with AIDS were compared with seropositive, non-AIDS patients or controls,Table 2. No significant correlation between sulphation ratios and CDC disease stratum was observed.
Cross sectional study : concomitant medications
The impact of concomitant medication on the two metabolic indices was investigated through regression analyses. The medication—metabolic index pairs whose regression lines had slopes significantly different from zero were further tested for significance using analysis of variance. This univariate approach, supplemented by a multivariate stepwise regression, selected, from among all medications, essentially the same subset of significant predictors of metabolic indices. This combined approach led to testing the effect of dapsone, lamivudine, pentamidine and zidovudine on one or both conjugation pathways.
None of those drugs had any significant effect on the glucuronidation of APAP although a trend toward increased glucuronidation was suggested with pentamidine administration. The mean sulphation index was significantly lower among patients taking dapsone than among controls (5.23 vs 13.9, P<0.05) as well as between patients on dapsone and patients not on the drug (5.23 vs 11.4, P<0.05). The sulphation ratio among lamivudine users was significantly lower than among controls (8.44 vs 13.9, P<0.05) as well as patients not on the drug (8.44 vs 11.9, P<0.05). Sulphation was not significantly affected by the administration of either zidovudine or pentamidine.
Neither smoking nor caffeine nor alcohol consumption was found to have any significant impact on either conjugation pathway. The coadministration of other glucuronidated substrates was also investigated. Subjects were assigned values indicating total use of such substrates (e.g. patients receiving both oxazepam and zidovudine were assigned 2; patients on no such substrates were assigned 0). The glucuronidation-substrate values were then compared with the glucuronidation indices and no statistically significant correlation was observed (r=0.108, P=0.198).
Nutritional status
Nutritional status was assessed in terms of percentage difference from ideal body weight (IBW). Regression analysis of percentage difference from IBW vs glucuronidation index showed the slope to be significantly different from zero (r=0.246, P=0.006). The mean glucuronidation index among patients who were underweight by 10% (18.0) was compared with that of patients with normal weight and those who were overweight by at least 20% (21.1 and 28.2, respectively). A nonsignificant trend towards reduced glucuronidation was observed (P=0.07). There was no apparent correlation between nutritional status and sulphation index.
Longitudinal study
Repeat determinations of the metabolic indices were performed with 46 patients including four who were tested three times. Based upon the results from the longitudinal study of control subjects, only changes in the metabolic indices which were greater than ±threefold were considered real and will thus be referred to as substantial changes.
Substantial decreases in the glucuronidation index were seen in eight patients (7.2±4.5 fold decrease) and decreased sulphation indices were observed in seven patients (5.1±2.2 fold decrease). Six of the seven patients with reduced sulphation indices also had substantially reduced glucuronidation indices. Increases in conjugation capacity were also observed in two patients, one showed 3.7-and 3.1-fold increases in the glucuronidation and sulphation indices, respectively; and the other displayed a 4.1-fold increase in sulphation index.
In two of the four patients assessed on three occasions, no substantial changes in the metabolic indices were observed. In another such patient, no substantial change in the glucuronidation index was observed at the second assessment but a 3.4-fold decrease was seen at the third assessment. The fourth patient had a 4.6-fold decrease in the glucuronidation index between the first and second testing and a 3.7-fold increase when tested for the third time.
An approach similar to that used in the analysis of the cross sectional data was used in an effort to explain the observed longitudinal changes. Changes in disease state, medication and body weight were examined.
Longitudinal study : disease state
HIV-related disease progression between the first and second assessments was observed in 24 of the 46 patients. In all but eight of these patients, no substantial changes occurred in either index. Glucuronidation was decreased in four patients, two of whom also showed decreased sulphation. Sulphation alone was decreased in two patients while one patient showed increases in both indices. Glucuronidation alone was increased in the eighth patient.
Among the 22 patients who had shown no disease progression, three exhibited a decrease in both metabolic indices, one had increased and two had decreased glucuronidation ratios.
Longitudinal study : concomitant medications
Dapsone, seen to significantly decrease the sulphation index in the cross sectional portion of the study, was in use by only two of the patients tested more than once. These patients ceased taking the drug between the first and second assessments and their sulphation indices increased, but not substantially (1.4-and 2.9-fold). There was no significant difference in the two measurements (P=0.13).
Fifteen patients began lamivudine therapy between the first and second metabolic assessments and another seven stopped taking the drug. There was no substantial change in the sulphation index in 15 of those patients. The index was decreased in six patients relative to when they were not on the drug and increased in one. The patients had a lower mean sulphation index while taking lamivudine than when they were not on the drug (8.23 vs 11.6) but this difference did not reach significance, P=0.08. This result is inconsistent with the data from the cross sectional portion of the study. No substantial changes were seen in either metabolic index in the seven patients who were on lamivudine for both tests.
Seventeen patients either began or ceased taking zidovudine between the first and second metabolic assessments. Two of the patients displayed a substantial increase in their glucuronidation index when they were on the drug relative to when they were not while zidovudine administration had the opposite effect in one patient. The mean glucuronidation index of the patients when they were not taking zidovudine was 15.8 compared with 24.4 while they were on the drug (difference significant, P=0.03). The pharmacological and clinical significance of this difference is not clear considering that only 3 of 17 patients had substantial changes (>3-fold) and that all of the changes were not in the same direction. The 13 patients who were taking zidovudine during both assessments showed a significant decrease in glucuronidation index (first occasion mean 16.6, second occasion mean 10.6, P=0.01) but not sulphation index.
Longitudinal study : nutritional status
There was very little longitudinal data with which to assess the effect of nutritional status on the metabolic indices. Only two patients had any important weight loss (>10%). One showed a decrease in her glucuronidation index and the other showed an increase while no changes were observed in the sulphation indices. These two patients were assessed a third time, at which point they had regained the weight and their glucuronidation indices returned to their initial values.
Discussion
This study was designed to determine the relative glucuronidation and sulphation activities in HIV positive patients and patients with AIDS. The initial selection criteria was a CD4+cell count of 150–250 mm−3 (or <20% of lymphocytes) at which point HIV disease progression is likely to occur. Many of the individuals would be likely to develop AIDS defining events and are thus a population in which the activities of UDP-glucuronosyltransferases (UDP-GT) and sulphotransferases (ST) may be affected by the administration of multiple medications or by HIV disease activity such as the onset of new opportunistic infections or tumours.
The method chosen to assess the activities of UDP-GT and ST was the glucuronidation and sulphation of APAP. The approach was based on the work of Bock et al. [21] which used a 0–8 h cumulative urine collection. The 0–8 h cumulative urine collection was replaced by a 4 h spot urine sample on the basis of no significant difference from indices determined from the analysis of cumulative 0–8 h or 4 h spot urine samples in controls. These results are consistent with the previous data of Miller et al. [26] which suggested that the conjugated to free APAP ratio should not significantly differ between samples collected hourly between 3 and 7 h postdose from that found in an 8 h cumulative sample.
The histograms from the cross sectional study of APAP glucuronidation and sulphation in the seropositive and control populations, presented in Figure 2, show very similar unimodal distributions for the two populations with only slight differences in mode and rather more outliers among the seropositive subjects. The mean glucuronidation and sulphation indices for the controls, seropositive non-AIDS and AIDS groups ranged from 19.5 to 23.8 and 9.8–11.7, respectively. These ratios are slightly higher and lower, respectively, than those previously reported by Bock et al. [21] who measured ratios of 18 for glucuronidation and 12 for sulphation among nonsmoking controls.
Cross sectionally there were no significant differences among the three groups relative to the metabolic indices, although there may have been a trend toward a lower sulphation index among seropositive subjects (11.0) vs controls (13.9), P=0.055 (Table 2). The distribution of the sulphation indices was further analysed by separating the seropositive patients according to their CDC status. No significant differences were seen between any of the resulting four groups.
These observations differ from the results recently presented by Esteban et al. [22] which involved 32 controls, 9 asymptomatic HIV positive patients and 19 AIDS patients. The data from that study indicated a significant decrease in the excretion of APAP glucuronide and an increase in APAP sulphate excretion in patients with AIDS compared with asymptomatic HIV positive patients or controls. The study, which included no longitudinal component, was based on total excretion of the metabolites over 24 h and not on metabolite/parent ratios.
The data from the longitudinal study also differ from the observations of Esteban et al. [22] and are consistent with the view that disease state does not affect the glucuronidation or sulphation of APAP. In this study, disease progression was defined as having occurred in patients who were diagnosed with a new HIV-related or AIDS defining condition between metabolic assessments or whose previously diagnosed condition had become active at the time of the second (or third) test. Using these criteria, HIV-related disease progression was observed in 24 of 46 patients. Substantial increases and decreases (>threefold changes) in the metabolic indices were observed in both the progressing and nonprogressing cohorts.
Previous investigations have identified a number of environmental factors which affect APAP metabolism. These include: tobacco use [27, 28], gender [27, 28], oral contraceptive use [27, 28], race [28] and alcohol consumption [28]. In this study, neither smoking nor consumption of caffeine or alcohol was found to have any significant impact on either conjugation pathway.
Concomitant drug administration has also been shown to have an effect on APAP metabolism and phenytoin and rifampicin have been shown to induce APAP glucuronidation [21]. The data from the cross sectional portion of this study suggests that dapsone may depress APAP sulphation although there were no results from the longitudinal section to confirm this. Since dapsone is glucuronidated, coadministration of this drug might have been expected to competitively decrease APAP glucuronidation, although no other glucuronidated concomitant medication, nor the sum of such medications, had such an effect. Why dapsone should interfere with APAP sulphation is not clear nor has this potential interaction been reported elsewhere.
The literature offers conflicting views on the potential effect of zidovudine on APAP glucuronidation. Recent reports suggest that coadministration of zidovudine might potentiate APAP-induced hepatotoxicity [17]. However, Burger et al. [20] have shown neither drug to affect the pharmacokinetics of the other. The data from the cross sectional segment of this study is consistent with the latter finding as no significant difference was detected in either metabolic index between patients taking zidovudine and those not taking it.
In the longitudinal portion of the study, zidovudine was associated with a statistically significant increase in the glucuronidation index. This was determined in a cohort of 17 patients who were tested both while taking and not taking the drug. However, the absolute change in this index was only considered substantial (i.e.>threefold) in three of those patients and it was a positive change for two and a negative change for the other. Thus, it is unclear if the statistically derived significance has any clinical or pharmacological relevance. Further longitudinal studies will be required to answer this question.
Protein-calorie malnutrition was identified as another factor which may reduce APAP glucuronidation and sulphation in rats [29]. In this study, nutritional status was assessed on the basis of percentage difference from ideal body weight (IBW). The mean glucuronidation index of patients who were under their IBW by at least 10% was lower than the mean indices of patients whose weight was normal or those who were overweight, and this trend approached significance (P=0.07). However, body weight is far from ideal as a measure of a patient’s nutritional status. Lean body mass measurements would be required to determine if AIDS-related wasting or other defects in intermediary metabolism were present.
Conclusion
In this study, the presence of HIV infection or the progression of this infection to AIDS has not been shown to alter the ability of a patient to transform APAP into its glucuronide and sulphate metabolites relative to controls. Environmental factors and concomitant administration of other therapeutic agents have also been shown to have no significant effect on these metabolic pathways with the possible exception of dapsone and lamivudine which were found to depress APAP sulphation and zidovudine which may increase APAP glucuronidation. The study has also demonstrated that a 4 h spot urine sample and the construction of metabolic indices are useful tools in this complex patient population.
Acknowledgments
The authors are indebted to the Canadian Foundation for AIDS Research (CANFAR) for financial assistance.
References
- 1.Eichelbaum M, Kroemer HK, Mikus G. Genetically determined differences in drug metabolism as a risk factor in drug toxicity. Toxicol Lett. 1992;64–65:115–122. doi: 10.1016/0378-4274(92)90180-r. [DOI] [PubMed] [Google Scholar]
- 2.Deloménie C, Grant DM, Mathelier-Fusade P, et al. N-acetylation genotype and risk of severe reactions to sulphonamides in AIDS patients [letter] Br J Clin Pharmacol. 1994;38:581–582. doi: 10.1111/j.1365-2125.1994.tb04401.x. [DOI] [PMC free article] [PubMed] [Google Scholar]
- 3.Kohler D, Hartter S, Fuchs K, Sieghart W, Hiemke C. CYP2D6 genotype and phenotyping by determination of dextromethorphan and metabolites in serum of healthy controls and of patients under psychotropic medication. Pharmacogenetics. 1997;7:453–461. doi: 10.1097/00008571-199712000-00003. [DOI] [PubMed] [Google Scholar]
- 4.Doll MA, Fretland AJ, Deitz AC, Hein DW. Determination of human NAT2 acetylator genotype by restriction fragment-length polymorphism and allele-specific amplification. Anal Biochem. 1995;231:413–420. doi: 10.1006/abio.1995.9978. [DOI] [PubMed] [Google Scholar]
- 5.Evans WE, Relling MV, Rahman A, et al. Genetic basis for a lower prevalence of deficient CYP2D6 oxidative drug metabolism phenotypes in black Americans. J Clin Invest. 1993;91:2150–2154. doi: 10.1172/JCI116441. [DOI] [PMC free article] [PubMed] [Google Scholar]
- 6.Stubbins MJ, Harries LW, Smith G, Tarbit MH, Wolf CR. Genetic analysis of the human cytochrome P450 CYP2C9 locus. Pharmacogenetics. 1996;6:429–439. doi: 10.1097/00008571-199610000-00007. [DOI] [PubMed] [Google Scholar]
- 7.Evans WE, Relling MV, Petros WP, et al. Dextromethorphan and caffeine as probes for simultaneous determination of debrisoquin-oxidation and N-acetylation phenotypes in children. Clin Pharmacol Ther. 1989;45:568–573. doi: 10.1038/clpt.1989.74. [DOI] [PubMed] [Google Scholar]
- 8.Kalow W, Tang BK. The use of caffeine for enzyme assays: a critical appraisal. Clin Pharmacol Ther. 1993;53:503–514. doi: 10.1038/clpt.1993.63. [DOI] [PubMed] [Google Scholar]
- 9.Tang BK, Kadar D, Qian L, et al. Caffeine as a metabolic probe: validation of its use for acetylator phenotyping. Clin Pharmacol Ther. 1991;49:648–657. doi: 10.1038/clpt.1991.82. [DOI] [PubMed] [Google Scholar]
- 10.Funck-Brentano C, Thomas G, Jacqz-Aigrain E, et al. Polymorphism of dextromethorphan metabolism: relationships between phenotype, genotype and response to the administration of encainide in humans. J Pharmacol Exp Therapeutics. 1992;263:780–786. [PubMed] [Google Scholar]
- 11.Cascorbi I, Drakoulis N, Brockmoller J, et al. Arylamine N-acetyltransferase (NAT2) mutations and their allelic linkage in unrelated Caucasian individuals: correlation with phenotypic activity. Am J Hum Genet. 1995;57:581–592. [PMC free article] [PubMed] [Google Scholar]
- 12.Rajaonarison JF, Lacarelle B, Catalin J, Placidi M, Rahmani R. 3′-azido-3′–deoxythymidine drug interactions. Screening for inhibitors in human liver microsomes. Drug Metab Disp. 1992;20:578–584. [PubMed] [Google Scholar]
- 13.Rikans LE. Drugs and nutrition in old age. Life Sci. 1986;39:1027–1036. doi: 10.1016/0024-3205(86)90193-1. [DOI] [PubMed] [Google Scholar]
- 14.Hathcock JN. Metabolic mechanisms of drug–nutrient interactions. Fed Proc. 1985;44:124–129. [PubMed] [Google Scholar]
- 15.O’Neil W, Gilfix BM, DiGirolamo A, Tsoukas CM, Wainer IW. N-acetylation among HIV-positive patients and patients with AIDS. when is fast, fast and slow, slow? Clin Pharmacol Ther. 1997;62:261–271. doi: 10.1016/S0009-9236(97)90028-X. [DOI] [PubMed] [Google Scholar]
- 16.Cummings AJ, King ML, Martin BK. A kinetic study of drug elimination: the excretion of paracetamol and its metabolites in man. Br J Pharmacol. 1967;29:150–157. doi: 10.1111/j.1476-5381.1967.tb01948.x. [DOI] [PMC free article] [PubMed] [Google Scholar]
- 17.Shriner K, Goetz MB. Severe hepatotoxicity in a patient receiving both acetaminophen and zidovudine [see comments] Am J Med. 1992;93:94–96. doi: 10.1016/0002-9343(92)90687-7. [DOI] [PubMed] [Google Scholar]
- 18.Kamali F, Rawlins MD. Influence of probenecid and paracetamol (acetaminophen) on zidovudine glucuronidation in human liver in vitro. Biopharm Drug Disp. 1992;13:403–409. doi: 10.1002/bdd.2510130603. [DOI] [PubMed] [Google Scholar]
- 19.Ameer B, James MO, Saleh J. Kinetic and inhibitor studies of acetaminophen and zidovudine glucuronidation in rat liver microsomes. Drug Chem Toxicol. 1992;15:161–175. doi: 10.3109/01480549209032297. [DOI] [PubMed] [Google Scholar]
- 20.Burger DM, Meenhorst PL, Underberg WJ, et al. Short-term, combined use of paracetamol and zidovudine does not alter the pharmacokinetics of either drug. Neth J Med. 1994;44:161–165. doi: 10.1016/0300-2977(95)90002-0. [DOI] [PubMed] [Google Scholar]
- 21.Bock KW, Wiltfang J, Blume R, Ullrich D, Bircher J. Paracetamol as a test drug to determine glucuronide formation in man. Effects of inducers and of smoking. Eur J Clin Pharmacol. 1987;31:677–683. doi: 10.1007/BF00541295. [DOI] [PubMed] [Google Scholar]
- 22.Esteban A, Perez-Mateo M, Boix V, et al. Abnormalities in the metabolism of acetaminophen in patients infected with the human immunodeficiency virus (HIV) Meth Find Exp Clin Pharmacol. 1997;19:129–132. [PubMed] [Google Scholar]
- 23.Devine BJ. Gentamycin therapy. Drug Intell Clin Pharm. 1974;8:650–655. [Google Scholar]
- 24.Di Girolamo A, O’Neil WM, Wainer IW. A validated method for the determination of paracetamol and its glucuronide and sulfate metabolites in the urine of HIV+/AIDS patients using wavelength-switching UV detection. J Pharmaceut Biomed Anal. 1998;17:1191–1197. doi: 10.1016/s0731-7085(98)00084-3. [DOI] [PubMed] [Google Scholar]
- 25.Prevention CfDCa. 1993 revised classification system for HIV infection and expanded surveillance case definition for AIDS among adolescents and adults. MMWR. 1992;41:1–19. [PubMed] [Google Scholar]
- 26.Miller RP, Roberts RJ, Fischer LJ. Acetaminophen elimination kinetics in neonates, children, and adults. Clin Pharmacol Ther. 1976;19:284–294. doi: 10.1002/cpt1976193284. [DOI] [PubMed] [Google Scholar]
- 27.Bock KW, Schrenk D, Forster A, et al. The influence of environmental and genetic factors on CYP2D6, CYP1A2 and UDP-glucuronosyltransferases in man using sparteine, caffeine, and paracetamol as probes. Pharmacogenetics. 1994;4:209–218. doi: 10.1097/00008571-199408000-00005. [DOI] [PubMed] [Google Scholar]
- 28.Mucklow JC, Fraser HS, Bulpitt CJ, et al. Environmental factors affecting paracetamol metabolism in London factory and office workers. Br J Clin Pharmacol. 1980;10:67–74. doi: 10.1111/j.1365-2125.1980.tb00503.x. [DOI] [PMC free article] [PubMed] [Google Scholar]
- 29.Price VF, Miller MG, Jollow DJ. Mechanisms of fasting-induced potentiation of acetaminophen hepatotoxicity in the rat. Biochem Pharmacol. 1987;36:427–433. doi: 10.1016/0006-2952(87)90346-7. [DOI] [PubMed] [Google Scholar]