

Abstract
Aims
To identify the human cytochrome P450 enzyme(s) involved in the in vitro metabolism of rosiglitazone, a potential oral antidiabetic agent for the treatment of type 2 diabetes-mellitus.
Method
The specific P450 enzymes involved in the metabolism of rosiglitazone were determined by a combination of three approaches; multiple regression analysis of the rates of metabolism of rosiglitazone in human liver microsomes against selective P450 substrates, the effect of selective chemical inhibitors on rosiglitazone metabolism and the capability of expressed P450 enzymes to mediate the major metabolic routes of rosiglitazone metabolism.
Result
The major products of metabolism following incubation of rosiglitazone with human liver microsomes were para-hydroxy and N-desmethyl rosiglitazone. The rate of formation varied over 38-fold in the 47 human livers investigated and correlated with paclitaxel 6α-hydroxylation (P<0.001). Formation of these metabolites was inhibited significantly (>50%) by 13-cis retinoic acid, a CYP2C8 inhibitor, but not by furafylline, quinidine or ketoconazole. In addition, both metabolites were produced by microsomes derived from a cell line transfected with human CYP2C8 cDNA. There was some evidence for CYP2C9 playing a minor role in the metabolism of rosiglitazone. Sulphaphenazole caused limited inhibition (<30%) of both pathways in human liver microsomes and microsomes from cells transfected with CYP2C9 cDNA were able to mediate the metabolism of rosiglitazone, in particular the N-demethylation pathway, albeit at a much slower rate than CYP2C8. Rosiglitazone caused moderate inhibition of paclitaxel 6α-hydroxylase activity (CYP2C8; IC50=18 μm), weak inhibition of tolbutamide hydroxylase activity (CYP2C9; IC50 =50 μm), but caused no marked inhibition of the other cytochrome P450 activities investigated (CYP1A2, 2A6, 2C9, 2C19, 2D6, 2E1, 3A and 4A).
Conclusion
CYP2C8 is primarily responsible for the hydroxylation and N-demethylation of rosiglitazone in human liver; with minor contributions from CYP2C9.
Keywords: CYP2C8, human liver microsomes, rosiglitazone
Introduction
Rosiglitazone, a novel oral thiazolidinedione compound that acts as an insulin sensitiser in order to improve glycaemic control, has been developed for the treatment of type 2 diabetes mellitus (non-insulin dependent diabetes mellitus) [1]. Type 2 diabetes is a common progressive disease affecting 1–4% of the population with increasing incidence in middle to old age. This drug is extensively metabolized, with virtually no rosiglitazone being excreted unchanged, following an oral or intravenous dose to man. In these studies, the primary routes of phase I metabolism of rosiglitazone were identified as N-demethylation and pyridine ring hydroxylation (Figure 1) [SB data on file], typical cytochrome P450 mediated reactions.
Figure 1.

Metabolic pathways of rosiglitazone in vitro. *Indicates the position of [14C] radiolabel. Major pathways (solid arrow) and minor pathway (broken arrow).
The oxidative biotransformation of a large number of therapeutic agents are mediated by cytochrome P450* mono-oxygenases. The specific P450 enzyme(s) involved in the biotransformation of a drug can be the defining characteristic of its pharmacokinetic behaviour, particularly if a polymorphic or otherwise highly variably expressed enzymes are involved. Additionally, the incidence of drug interactions may be increased when there is competition between two or more drugs for oxidation by the same P450 enzyme [2]. Consequently, the assessment of the human P450 enyzme(s) involved in the metabolism of a given drug can be useful in understanding the disposition and behaviour of the compound in vivo and may have clinical implications. This report describes an in vitro investigation into the metabolism of rosiglitazone with the aim of identifying the human P450 enzyme(s) responsible for its biotransformation. This was assessed by: (i) studying the metabolism of rosiglitazone in microsomes from human liver and cells transfected with specific human P450 cDNAs, (ii) determining the effects of chemical inhibitors, selective for individual P450 enzymes, and (iii) by correlation analyses with specific P450 activities determined in a bank of human livers.
Methods
Chemicals
[14C]-Rosiglitazone, maleate salt (radiochemical purity 98.5%, specific activity 120 μCi mg−1), nonradiolabelled rosiglitazone (maleate salt) and authentic reference standards, SB 244675 (ortho-hydroxy rosiglitazone), SB 237216 (N-desmethyl rosiglitazone) and SB-243914 (N-desmethyl-ortho-hydroxy rosiglitazone) (±) bufuralol (S)-mephenytoin and [3–14C-methyl]caffeine were synthesized in the laboratories of SmithKline Beecham Pharmaceuticals. Sulphaphenazole, furafylline, 1′-hydroxy bufuralol, hydroxy tolbutamide and 4-hydroxy mephenytoin were obtained from Ultrafine Chemicals, Salford, UK. Tolbutamide, coumarin, 7-hydroxy coumarin, caffeine, lauric acid, paclitaxel (Taxol™), 13-cis- retinoic acid (isotretinoin), ketoconazole, and quinidine sulphate were obtained from Sigma Chemical Co. Ltd, Dorset, UK. [Mebmt-β-3H]-Cyclosporine A, [4–14C]mephenytoin, [1–14C]lauric acid, [3H]-paclitaxel and [ring-U-14C]-tolbutamide were purchased from Amersham International plc, Amersham, Bucks, UK. All other reagents were purchased from commercial sources and were of the purest grade available.
Human liver tissue and preparation of human liver microsomes
Samples of human liver (coded H27 to H33, H35, H37, H99 to H108, H110 to H127, H307 to H317) were obtained from either Vitron Inc., Tucson, Arizona, USA, the International Institute for the Advancement of Medicine, Pennsylvannia, USA or the Anatomic Gift Foundation, Columbia, USA. All samples were from healthy donors and in all cases, the cause of death was not due to any known biochemical deficiency in the liver. Liver samples were stored at circa−80° C until use. Human liver microsomal fractions were prepared by differential ultracentrifugation. After homogenization in 0.25 m Sucrose/50 mm Tris-HCl buffer, pH 7.4, the microsomal fraction was isolated from the supernatant of a 20 min, 10 000 gav. spin by ultracentrifugation at 105 000 gav. for 60 min. The microsomal pellet was resuspended in the Sucrose/Tris-HCl buffer and recentrifuged at 105 000 gav. for 60 min. The final pellet was resuspended in 50 mm potassium phosphate buffer, pH 7.4, to obtain a suspension containing the equivalent of 1 g liver ml−1 and stored at circa−80° C until required. Microsomal protein concentrations were determined by the method of Smith et al. [3] using the Pierce BCA (bicinchoninic acid) Protein Assay Reagent.
Microsomes derived from human lymphoblastoid cells transfected with human P450 cDNA: CYP1A1, 1A2, 2A6, 2B6, 2C9, 2D6-Val, 2E1, 3A4 and control and microsomes derived from baculovirus infected insect cells (BTI-TN-5B1–4) transfected with human P450 cDNA (supersomes™) over-expressing CYP2C8 and CYP2C9-Arg144, were purchased from the Gentest Corporation, MA, USA. The protein content for the expression systems was determined by the Gentest Corporation.
Rosiglitazone metabolism in human liver microsomes
[14C]-Rosiglitazone (at a final concentration equivalent to the mean Km, 10 μm, added in methanol, final solvent concentration not exceeding 0.5% (v/v)), was incubated with an NADPH generating system (final concentration 0.5 mm NADP, 5 mm glucose-6-phosphate and 1 U ml−1 glucose-6-phosphate dehydrogenase in 2% (w/v) sodium hydrogen carbonate) with microsomal protein (approximately 0.4 mg ml−1 incubation) in 50 mm potassium phosphate buffer, pH 7.4 to give a final incubation volume of 250 μl. Incubations were initiated by the addition of a NADPH generating system after a 5 min preincubation period and were continued at 37° C for 5 min in a shaking water bath. These initial velocity conditions were linear with respect to both protein and time of incubation. The reaction was terminated by adding a volume of 50 μl 10% (w/v) trichloroacetic acid. The extraction efficiency following protein precipitation was >89%. After centrifugation, the supernatants were analysed by h.p.l.c.
H.p.l.c. of incubates was performed using a Merck-Hitachi L6200 or a Hewlett Packard 1090 m system and a Novapak® C18 column (5 μm, 3.9 mm×15 cm, from Waters) maintained at a temperature of approximately 40° C with a flow rate of 1.0 ml min−1. Elution was obtained with 0.05 m ammonium acetate, pH 8.0 (solvent A) with a gradient of acetonitrile (solvent B). The elution conditions were a linear gradient of 5% solvent B to 10% B over 10 min, followed by an isocratic gradient of 20% solvent B until 30 min and finally isocratic 100% B until 40 min. A Ramona-5 (Lablogic Inc.) was used for radiodetection and a Applied Biosystems 785 A programmable absorbance detector or a Hewlett Packard 1040 A diode array detector for u.v. absorbance at 254 nm. The radioactive peaks of interest on the chromatogram were integrated and an area under each peak expressed as a percentage of the total integrated area using LabChrom software (v 2.04 or 2.10) or Laura software (v 1.1 and 1.2). Rates of formation of rosiglitazone metabolites were evaluated from the fractional conversion of rosiglitazone apparent from the radiochromatogram. Authentic rosiglitazone and reference standards were used to establish retention times. The identity of metabolites was established using LC/MS and confirmed following comparison to mass spectral and NMR analysis of rat and dog in vivo samples [4].
Rosiglitazone metabolism in microsomes from cells transfected with human P450 cDNAs
[14C]-Rosiglitazone (final concentration 10 μm), was incubated as described earlier with microsomes derived from human lymphoblastoid cells transfected with human cDNA expressing one of the following P450 s: CYP1A1, 1A2, 2A6, 2B6, 2C9, 2D6, 2E1, 3A4 and untransfected cells (final concentration of 2 mg ml−1 microsomal protein) and also microsomes derived from baculovirus infected insect cells transfected with human P450 cDNA (supersomes™) over-expressing CYP2C8 and CYP2C9-Arg144 (final concentration of 0.4 mg ml−1 microsomal protein).
Kinetics of rosiglitazone metabolism
Enzyme kinetic analysis of rosiglitazone metabolism, at concentrations from 0.25 to 500 μm, was investigated in duplicate in microsomes from three human livers (H29, H30 and H99) and CYP2C8 and CYP2C9-Arg144 supersomes™. Rosiglitazone was incubated with approximately 0.4 mg ml−1 microsomal protein for 5 min. Estimates for the apparent V max and Km values for the formation of para-hydroxy and N-desmethyl rosiglitazone were determined by non-linear regression.
Correlation experiments
Comparative rates of rosiglitazone metabolism in microsomes from 47 human livers were investigated by incubating 10 μm rosiglitazone with 0.3–1 mg ml−1 microsomal protein for 5 min. The rates of rosiglitazone para-hydroxylation and N-demethylation were then correlated with the rates of specific cytochrome P450 activities determined in a number of human livers (n=47).
Inhibition experiments
The effect of chemical inhibitors, selective for individual cytochrome P450 enzymes on the metabolism of rosiglitazone was investigated. The inhibitors furafylline (10 μm), 13-cis retinoic acid (142 μm), sulphaphenazole (10 μm), quinidine (1 μm) and ketoconazole (1 μm) were added to incubates containing rosiglitazone (10 μm) to investigate the involvement of CYP1A2 [5, 6], CYP2C8 [7], CYP2C9 [8], CYP2D6 [9] and CYP3A [8, 10], respectively. Furafylline, sulphaphenazole and ketoconazole (in methanol) and retinoic acid (in acetone) were added to incubates giving a final solvent concentration of 2% (v/v). Quinidine was dissolved in 50 mm phosphate buffer, pH 7.4. Inhibited activities were compared with activities of appropriate control incubations and IC50 values determined. Furafylline was preincubated with microsomes and an NADPH generating system for 10 min, before adding rosiglitazone to initiate the reaction. In all other assays, reactions were initiated by the addition of the NADPH generating system following a 5 min preincubation. The effect of inhibitors on rosiglitazone metabolism was investigated in microsomes from up to six human livers and all incubations were performed in duplicate.
The inhibitory potential of rosiglitazone was investigated by performing assays for specific cytochrome P450 activities in the absence and presence of rosiglitazone (final concentration 100 or 250 μm, added in 0.5% (v/v) methanol and 50 mm phosphate buffer, pH 7.4) using microsomes from three human livers. All incubations were performed in duplicate. Assays for specific cytochrome P450 activities were performed as described below.
Determination of cytochrome P450 activities
Caffeine N3-demethylase, coumarin 7-hydroxylase, paclitaxel 6α-hydroxylase, tolbutamide hydroxylase (S)-mephenytoin 4-hydroxylase, bufuralol 1′-hydroxylase, lauric acid ω-1 hydroxylase, cyclosporin oxidase and lauric acid ω-hydroxylase were used as probe activities for CYP1A2 [11], CYP2A6 [12, 13], CYP2C8 [14], CYP2C9 [15, 16], CYP2C19 [17], CYP2D6 [18], CYP2E1 [19], CYP3A [20] and CYP4A [19, 21], respectively.
All microsomal assays were carried out under similar conditions at approximately 37° C in potassium phosphate buffer, pH 7.4, or 500 mm Tris-HCl buffer, pH 7.4, for the lauric acid assay, using a NADPH generating system. Assays of caffeine N3-demethylation at 500 μm [22], tolbutamide hydroxylation at 100 μm [6, 23] (S)-mephenytoin 4-hydroxylation at 100 μm [6, 24], bufuralol 1′-hydroxylation at 10 μm [6], cyclosporin oxidation at 1 μm [25] and lauric acid hydroxylation at 20 μm [19], were carried out as reported by these authors.
Coumarin 7-hydroxylase was determined by h.p.l.c. with fluorescence detection and quantified by external standardization with authentic 7-hydroxycoumarin. A 1 μm concentration of coumarin was used. Incubations were terminated after 3 min by addition of 50 μl of 10% (w/v) trichloroacetic acid. After centrifugation, to pellet the protein, 125 μl of the supernatant was analysed by h.p.l.c. on a Hewlett Packard 1090 m linked to a Hewlett Packard 1046 A fluorescence detector set at an excitation wavelength of 330 nm and an emission wavelength of 455 nm. A Supelcosil LC-ABZ, 5 μm, 15 cm×4.6 mm column was maintained at ambient temperature and eluted at a flow rate of 1 ml min−1 with an isocratic mixture of 75% solvent A (0.1 m ammonium acetate, pH 5)/25% solvent B (acetonitrile) for 10 min. Under these conditions the retention time of 7-hydroxycoumarin was approximately 6 min
Paclitaxel 6α-hydroxylase was determined by h.p.l.c. using [3H]-paclitaxel and a radiometric assay for quantification. A 10 μm concentration of paclitaxel was used. Incubations containing approximately 0.4 mg ml−1 microsomal protein were terminated after 20 min by the addition of 2.5 ml ethyl acetate. After 10 min mixing and 5 min centrifugation the organic layer was evaporated to dryness under nitrogen then resuspended in acetonitrile:water (50:50 v/v). Samples were analysed on a Merck–Hitachi L7100 h.p.l.c. system linked to a Reeve radio-detector equipped with a 500 μl homogenous flow cell. A Highcrom Hypersil H5-ODS, 12.5 cm×4.6 mm column was maintained at ambient temperature and eluted at a flow rate of 1.0 ml min−1 with an isocratic mixture of 65% solvent A (acetonitrile): 35% solvent B (water) for 5 min, followed by a linear gradient to 65% solvent B by 15 min, held at these conditions for a further 5 min. Under these conditions the retention time of 6α-hydroxy paclitaxel was 14.5 min. The identification of 6α-hydroxy paclitaxel was confirmed using mass spectrometry [26].
Analysis of results
All graphical analysis of data was performed using Grafit v 3.0 [27]. The Michaelis-Menten parameters were determined from a nonlinear least squares regression analysis. These kinetic parameters and the inhibitory constant (IC50) were calculated, using weighted (1/y) data. The inhibition of enzyme activities were also expressed as percentage of control enzyme activities (mean±s.d.), where appropriate.
Tests for statistical significance were performed using SAS/INSIGHT® Version 6 [28]. A multiple linear regression analysis was utilized to select a model to identify the cytochrome P450 enzyme(s) which correlated with hydroxy rosiglitazone and N-desmethyl rosiglitazone. A multiple regression model was initially fitted using all known explanatory variables (cytochrome P450 enzyme activities). Type III F-or, equivalently, t-statistics were calculated for the exclusion of each explanatory variable from the model. The cytochrome P450 enzyme activity corresponding to the lowest value of the statistic was omitted if its P value was greater than the 5% significance level and the change in the adjusted r2 value indicated that little explanatory power would be lost by its exclusion. The F- or t-statistics were then calculated for the new model and the above steps were repeated until no other cytochrome P450 enzyme activity could be omitted.
Results
Rosiglitazone metabolism in human liver microsomes
The major pathways of metabolism following incubation of rosiglitazone with human liver microsomes and an NADPH generating system were identified as pyridine ring hydroxylation and N-demethylation of rosiglitazone (Figure 1). No metabolites were produced in the absence of the NADPH generating system thus indicating the involvement of the P450 enzyme system.
The two major metabolites, para-hydroxy and N-desmethyl rosiglitazone were detected in all 47 human livers investigated, with the minor metabolite, ortho-hydroxy rosiglitazone being quantifiable in only 28 of the livers. Metabolism of rosiglitazone (at 10 μm concentration) varied in the human liver microsomes investigated with the para-hydroxylation and N-demethylation pathways ranging from 1 to 38 nmol h−1 mg−1 protein and 0.8–31 nmol h−1 mg−1 protein, respectively (Figure 2).
Figure 2.

Correlations of paclitaxel 6α-hydroxylation with (a) rosiglitazone para-hydroxylation and (b) rosiglitazone N-demethylation, in human liver microsomes (n=47).
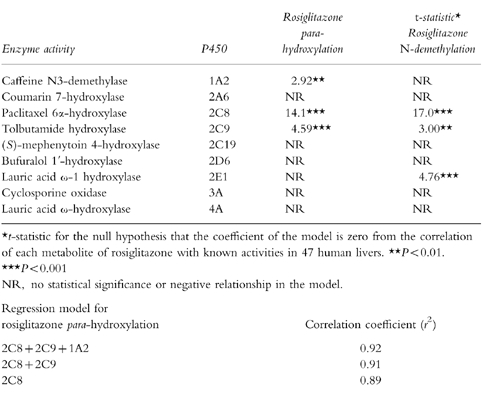
A multiple linear regression analysis (t-statistics) of rosiglitazone metabolism in 47 human livers are shown in Table 1. Statistically significant correlations were observed between rates of rosiglitazone hydroxylation and N-demethylation with paclitaxel 6α-hydroxylase (CYP2C8; P<0.001, Figure 2) and to a slightly lesser extent with tolbutamide hydroxylase (CYP2C9; P<0.001 and P<0.001, respectively). In addition, rates of rosiglitazone para-hydroxylation and N-demethylation correlated with each other (P<0.001). Rosiglitazone hydroxylation and N-demethylation did not correlate with CYP2A6, CYP2C19, CYP2D6 or CYP3A activities, however, weaker associations between CYP1A2 and rosiglitazone para-hydroxylase activities (P<0.01) and CYP2E1 and rosiglitazone N-demethylase activities (P<0.001) were observed. The formation of ortho-hydroxy rosiglitazone (<1.8 nmol h−1 mg−1 protein) was low and inconsistent under the conditions used and it was not possible to perform multiple regression analysis on these results.
Table 1.
Multiple linear regression analysis of rosiglitazone metabolism in 47 human livers.
Rosiglitazone metabolism in microsomes from cells transfected with human P450 cDNAs
Identical pathways of metabolism to those found in hepatic microsomal incubations were observed following incubation of rosiglitazone with CYP2C8 and CYP2C9-Arg144 supersomes™, although metabolites were more extensively produced by the CYP2C8 expression system than CYP2C9. An additional metabolite, previously undetected in vitro, was observed in trace amounts following incubation with CYP2C8 supersomes™. This peak co-chromatographed with the authentic standard N-desmethyl-ortho-hydroxy rosiglitazone, which has previously been characterized by LC/MS and NMR [SB data on file].
Metabolism of rosiglitazone varied significantly in the nine heterologous expression systems investigated. However, it is well known that individual human β-lymphoblastoid and baculovirus expression systems do not express P450 s equally, therefore all rates were scaled by an appropriate ‘relative activity factor’ for direct comparison with that in human liver microsomes. This scaling factor was derived by determining the catalytic activity of each P450 model substrate in the bank of human liver microsomes and cDNA expression systems tested as described by Venkatakrishnan et al. and Crespi [29, 30]. The adjusted rates of rosiglitazone para-hydroxylation and N-demethylation by CYP2C8 supersomes™ were 7 and 10 nmol h−1 mg−1 protein, respectively, compared with 0.3 and 3 by nmol h−1 mg−1 protein, respectively, by CYP2C9-Arg144 supersomes™ (Figure 3). Rosiglitazone was not metabolized by the heterologous expressions systems CYP1A1, CYP2A6, CYP2B6 and CYP2D6. However, there were minor contributions from CYP1A2, CYP2E1 and CYP3A4 (rates <0.6 nmol h−1 mg−1 protein).
Figure 3.

Rosiglitazone metabolism in human P450 expression systems (microsomes derived from human lymphoblastoid cells or *baculovirus infected insect cells). ortho-hydroxylation is shown in clear bars, para-hydroxylation in hatched bars and N-demethylation in solid bars. Expression system rates are corrected by a relative activity factor for comparison with the mean values (n=47) in human liver microsomes (HM).
Kinetic analysis of rosiglitazone metabolism
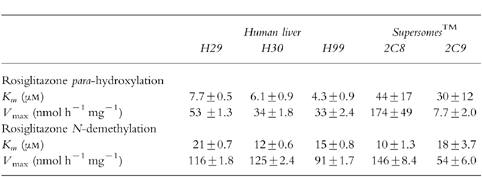
The kinetic data for para-hydroxylation and N-demethylation of rosiglitazone was most consistent with simple enzyme kinetics (Figure 4). The estimated Michaelis-Menten parameters for the para-hydroxylation and N-demethylation of rosiglitazone in microsomes from three human livers and CYP2C8 and CYP2C9-Arg144 supersomes™ investigated, are shown in Table 2. In the human livers investigated the Km ranged from approximately 4–20 μm, with a mean of 10 μm. The V max ranged from approximately 30–130 nmol h−1 mg−1 protein, with a mean of 75 nmol h−1 mg−1 protein.
Figure 4.

Michaelis-Menten plots of the enzyme kinetics of (a) rosiglitazone para-hydroxylation and (b) rosiglitazone N-demethylation, in human liver microsomes (H29) and CYP2C8 supersomes™.
Table 2.
Michaelis-Menton parameters (±s.e. mean) estimated for para-hydroxylation and N-demethylation of rosiglitazone in human liver microsomes (n=3) and CYP2C8 and CYP2C9-Arg144 supersomes™.
Inhibition experiments
The effect of selective and semiselective inhibitors on the hydroxylation and N-demethylation of rosiglitazone in human liver microsomes is illustrated in Figure 5. 13-cis-Retinoic acid (142 μm) had the most potent inhibitory effect on all the metabolic pathways, greater than 50% inhibition being observed at 10 μm rosiglitazone. Sulphaphenazole (10 μm) demonstrated limited inhibitory effect on rosiglitazone N-demethylation (≈30%) and to a lesser degree on rosiglitazone para-hydroxylation (≈20%). Quinidine had no effect on the metabolism of rosiglitazone, with furafylline and ketoconazole causing <15% inhibition on any one metabolic route.
Figure 5.

The effect of various selective P450 inhibitors on rosiglitazone para-hydroxylation (hatched bars) and rosiglitazone N-demethylation (solid bars) in human liver microsomes. Values are illustrated as mean percentage inhibition±s.d. (error bars) in human liver microsomes (n=3 with 13-cis retinoic acid, quinidine, ketoconazole); (n=4 with furafylline); (n=6 with sulphaphenazole).
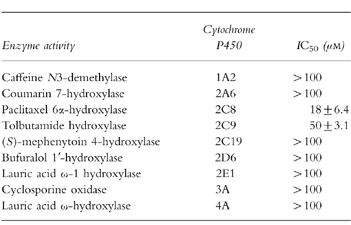
The inhibitory potential of rosiglitazone on specific cytochrome P450 activities was also investigated (Table 3). Rosiglitazone caused moderate inhibition on paclitaxel 6α-hydroxylase activity (CYP2C8) with a mean IC50 of 18 μm and weak inhibition on tolbutamide hydroxylase activity (CYP2C9) with a mean IC50 of 50 μm. Rosiglitazone at a concentration of 100 μm had no significant inhibitory effect on any of the other hepatic P450 activities investigated. Thus, the IC50 values for rosiglitazone inhibition of caffeine N3-demethylase (CYP1A2), coumarin 7-hydroxylase (CYP2A6) (S)-mephenytoin 4-hydroxylase (CYP2C19), bufuralol 1′-hydroxylase (CYP2D6), lauric acid ω-1 hydroxylase (CYP2E1), cyclosporin oxidase (CYP3A) and lauric acid ω-hydroxylase (CYP4A) were estimated to be >100 μm.
Table 3.
Inhibitory potential of rosiglitazone on specific cytochrome P450 activities in human liver microsomes (mean±s.d., n=3).
Discussion
This study has demonstrated that para-hydroxylation of the pyridine ring and N-demethylation are the major pathways of metabolism for rosiglitazone in human liver microsomes. These oxidative pathways were also major routes of phase I metabolism in vivo in rat and dog [4] and in man [SB data on file]. Metabolism of rosiglitazone in human microsomal incubations was NADPH dependent and this study identified CYP2C8 as the major P450 involved, with a minor contribution from CYP2C9.
Multiple regression analysis between known P450 enzyme selective activities and the rates of para-hydroxy and N-desmethyl rosiglitazone formation revealed significant correlations with paclitaxel 6α-hydroxylase activity, in the 47 human livers investigated. The hydroxylation of paclitaxel, at position 6α on the taxane ring, has been reported to be a selective CYP2C8 pathway [14, 31, 32]. Additionally, tolbutamide hydroxylase (CYP2C9), caffeine N3-demethylase (CYP1A2) and lauric acid ω-1 hydroxylase (CYP2E1) activities correlated significantly with para-hydroxy and/or N-desmethyl rosiglitazone. However, exclusion of these activities from the multiple regression analysis model caused only minor effects on the r2 value (<0.04). Thus, little explanatory power was lost by exclusion of CYP2C9, 1A2 and 2E1 activities from the model, which suggests a relatively small contribution to the metabolism of rosiglitazone despite the level of statistical significance. A significant correlation was also apparent between the rates of rosiglitazone para-hydroxylation and N-demethylation, which is consistent with the hypothesis that the two metabolic pathways are mediated by the same P450 enzyme(s). Correlations with substrates selective for CYP2A6, 2C19, 2D6, 3A and 4A activities were not statistically significant.
Of the heterologously expressed human drug-metabolizing enzymes, only microsomes from baculovirus infected insect cells expressing CYP2C8 demonstrated hydroxylation and N-demethylation of rosiglitazone at a comparative rate to that seen in human liver microsomes. Although the rate of rosiglitazone N-demethylation in CYP2C9 supersomes™ was four-fold less compared with an average human liver and only trace amounts of para-hydroxy rosiglitazone were detected, some contribution from CYP2C9 may be anticipated in vivo, particularly in those individuals with high levels of this enzyme.
Consistent with the expressed P450 enzymes and the correlation studies, rosiglitazone para-hydroxylation and N-demethylation pathways were inhibited by 13-cis retinoic acid, an inhibitor of CYP2C8. Although its selectivity has not been conclusively proven, retinoic acid, a CYP2C8 substrate [7], has been reported to inhibit paclitaxel 6α-hydroxylation in human liver microsomes with a Ki of 27 μm [14]. Both pathways of rosiglitazone metabolism were inhibited to a limited extent by sulphaphenazole, a selective P450 inhibitor of CYP2C9 [8, 23, 33], thus confirming the minor involvement of CYP2C9. The lack of inhibition observed with furafylline, a highly selective mechanism based inhibitor of CYP1A2 activity [5, 6], suggests that CYP1A2 is not significantly involved in the metabolism of rosiglitazone. Inhibitors of CYP3A4 and CYP2D6 had no effect on the microsomal formation of para-hydroxy and N-desmethyl rosiglitazone. Overall, the expression systems, correlation and inhibition studies performed are fully consistent with CYP2C8 having the dominant role in the metabolism of rosiglitazone.
As a CYP2C8 substrate rosiglitazone, as might be anticipated, caused moderate inhibition of paclitaxel 6α-hydroxylase (IC50 approx. 20 μm) in human liver microsomes. Weak inhibition of tolbutamide hydroxylase was also observed (IC50 approx. 50 μm), which may reflect the minor involvement of CYP2C9 in the metabolism of rosiglitazone or a lack of specificity of tolbutamide for CYP2C9, since CYP2C8 is also known to be involved in its metabolism [15]. In addition, concentrations of rosiglitazone required to influence the metabolism of tolbutamide, are unlikely to be achieved in vivo. No other P450 enzymes were significantly affected by the presence of rosiglitazone.
There is currently limited information regarding inhibitors, inducers and substrates of CYP2C8 in man, in vivo. Only a few clinically utilized drugs, for example paclitaxel and cerivastatin, are known to be substrates of CYP2C8 [32, 34]. Since rosiglitazone has little nonspecific binding in microsomes ( fumic=0.9 at 0.5 μm, personal communication H. Oldham) the IC50s determined here probably accurately reflect the low in vitro inhibitory potential of rosiglitazone. In vivo rosiglitazone attains a plasma Cmax of less than 2 μm at therapeutic doses, but is highly protein bound (>99.8%) with no accumulation or concentration in the liver [SB, data on file]. Together this would suggest that the potential for drug interactions mediated through P450 inhibition by rosiglitazone would be low.
References
- 1.Cawthorne MA, Lister CA, Holder JC, et al. Anti-hyperglycaemic efficacy of BRL 49653, a highly potent thiazolidinedione, in animal models of non-insulin dependent diabetes. Diabetes. 1993;42 [Google Scholar]
- 2.McInnes GT, Brodie MJ. Drug interactions that matter. A critical appraisal. Drugs. 1988;36:83–110. doi: 10.2165/00003495-198836010-00006. [DOI] [PubMed] [Google Scholar]
- 3.Smith PK, Krohn RI, Hermanson GT, et al. Measurement of protein using bicinchoninic acid. Anal Biochem. 1985;150:76–85. doi: 10.1016/0003-2697(85)90442-7. [DOI] [PubMed] [Google Scholar]
- 4.Bolton GC, Keogh JP, East PD, Hollis FJ, Shore AD. The fate of a thiazolidinedione antidiabetic agent in rat and dog. Xenobiotica. 1996;26:627–636. doi: 10.3109/00498259609046738. [DOI] [PubMed] [Google Scholar]
- 5.Sesardic D, Boobis AR, Murray BP, et al. Furafylline is a potent and selective inhibitor of cytochrome P450 1A2 in man. Br J Clin Pharmacol. 1990;29:651–663. doi: 10.1111/j.1365-2125.1990.tb03686.x. [DOI] [PMC free article] [PubMed] [Google Scholar]
- 6.Clarke SE, Ayrton AD, Chenery RJ. Characterisation of the inhibition of Cytochrome P4501A2 by furafylline. Xenobiotica. 1994;24:517–526. doi: 10.3109/00498259409043254. [DOI] [PubMed] [Google Scholar]
- 7.Leo MA, Lasker JM, Raucy JL, Kim C, Black M, Lieber CS. Metabolism of retinol and retinoic acid by human liver cytochrome P450IIC8. Arch Biochem Biophys. 1989;269:305–312. doi: 10.1016/0003-9861(89)90112-4. [DOI] [PubMed] [Google Scholar]
- 8.Baldwin SJ, Bloomer JC, Smith GJ, Ayrton AD, Clarke SE, Chenery RJ. Ketoconazole and sulphaphenazole as the respective selective inhibitors of P4503A and 2C9. Xenobiotica. 1995;25:261–270. doi: 10.3109/00498259509061850. [DOI] [PubMed] [Google Scholar]
- 9.Otton SV, Crewe HK, Lennard MS, Tucker GT, Woods HF. Use of quinidine inhibition to define the role of the sparteine/debrisoquine cytochrome P450 in metoprolol oxidation by human liver microsomes. J Pharmacol Exp Therap. 1988;247:242–247. [PubMed] [Google Scholar]
- 10.Maurice M, Pichard L, Daujat M, et al. Effects of imidazole derivatives on cytochromes P450 from human hepatocytes in primary culture. Faseb J. 1992;6:752–758. doi: 10.1096/fasebj.6.2.1371482. [DOI] [PubMed] [Google Scholar]
- 11.Berthou F, Flinois J-P, Ratanasavanh D, Beaune P, Riche C, Guillouzo A. Evidence for the involvement of several cytochromes P-450 in the first steps of caffeine metabolism by human liver microsomes. Drug Metab Dispos. 1991;19:561–567. [PubMed] [Google Scholar]
- 12.Yamano S, Tatsuno J, Gonzalez FJ. The CYP2A3 gene product catalyzes coumarin 7-hydroxylation in human liver microsomes. Biochemistry. 1990;29:1322–1329. doi: 10.1021/bi00457a031. [DOI] [PubMed] [Google Scholar]
- 13.Maurice M, Emiliani S, Dalet-Beluche I, Derancourt J, Lange R. Isolation and characterisation of a cytochrome P450 of the IIA subfamily from human liver microsomes. Eur J Biochem. 1991;200:511–517. doi: 10.1111/j.1432-1033.1991.tb16212.x. [DOI] [PubMed] [Google Scholar]
- 14.Rahman A, Korzekwa R, Grogan J, Gonzalez FJ, Harris JW. Selective biotransformation of taxol to 6α-hydroxytaxol by human cytochrome P450 2C8. Cancer Res. 1994;54:5543–5546. [PubMed] [Google Scholar]
- 15.Veronese ME, Doecke CJ, Mackenzie PI, et al. Site-directed mutation studies of human liver cytochrome P-450 isoenzymes in the CYP2C subfamily. Biochem J. 1993;289:533–538. doi: 10.1042/bj2890533. [DOI] [PMC free article] [PubMed] [Google Scholar]
- 16.Relling MV, Aoyama T, Gonzalez FJ, Meyer UA. Tolbutamide and mephenytoin hydroxylation by human cytochrome P450s in the CYP2C subfamily. J Pharmacol Exp Ther. 1990;252:442–447. [PubMed] [Google Scholar]
- 17.Wrighton SA, Stevens JC, Becker GW, Vandenbranden M. Isolation and characterisation of human liver cytochrome P450 2C19: Correlation between 2C19 and S-mephenytoin 4′-hydroxylation. Arch Biochem Biophys. 1993;306:240–245. doi: 10.1006/abbi.1993.1506. [DOI] [PubMed] [Google Scholar]
- 18.Zanger UM, Vilbois F, Hardwick J, Meyer UA. Absence of hepatic cytochrome P450buf1 causes genetically deficient debrisoquine oxidation in man. Biochemistry. 1988;27:5447–5454. doi: 10.1021/bi00415a010. [DOI] [PubMed] [Google Scholar]
- 19.Clarke SE, Baldwin SJ, Bloomer JC, Ayrton AD, Sozio RS, Chenery RJ. Lauric acid as a model substrate for the simultaneous determination of cytochrome P450 2E1 and 4A in hepatic microsomes. Chem Res Tox. 1994;7:836–842. doi: 10.1021/tx00042a018. [DOI] [PubMed] [Google Scholar]
- 20.Combalbert J, Fabre I, Fabre I, et al. Metabolism of Cyclosporin A. Purification and identification of the rifampicin-inducible human liver cytochrome P-450 (Cyclosporin A Oxidase) as a product of P450IIIA gene subfamily. Drug Metab Dispos. 1989;17:197–207. [PubMed] [Google Scholar]
- 21.Dirven HAAM, Peters JGP, Gibson GG, Peters WHM, Jongeneelen FJ. Lauric acid hydroxylase activity and cytochrome P450 IV family proteins in human liver microsomes. Biochem Pharmacol. 1991;42:1841–1844. doi: 10.1016/0006-2952(91)90524-9. [DOI] [PubMed] [Google Scholar]
- 22.Bloomer JC, Clarke SE, Chenery RJ. Determination of P4501A2 activity in human liver microsomes using [3–14C-methyl]caffeine. Xenobiotica. 1995;25:917–927. doi: 10.3109/00498259509046663. [DOI] [PubMed] [Google Scholar]
- 23.Miners JO, Smith KJ, Robson RA, McManus ME, Veronese ME, Birkett DJ. Tolbutamide hydroxylation by human liver microsomes, kinetic characterisation and relationship to other cytochrome P-450 dependent xenobiotic oxidations. Biochem Pharmacol. 1988;37:1137–1144. doi: 10.1016/0006-2952(88)90522-9. [DOI] [PubMed] [Google Scholar]
- 24.Meier UT, Kronbach T, Meyer UA. Assay of mephenytoin metabolism in human liver microsomes by high-performance liquid chromatography. Anal Biochem. 1985;151:286–291. doi: 10.1016/0003-2697(85)90177-0. [DOI] [PubMed] [Google Scholar]
- 25.Pichard L, Fabre I, Fabre G, et al. Cyclosporin A drug interactions. Screening for inducers and inhibitors of cytochrome P-450 (Cyclosporin A Oxidase) in primary cultures of human hepatocytes and in liver microsomes. Drug Metab Dispos. 1990;18:595–606. [PubMed] [Google Scholar]
- 26.Poon GK, Wade J, Bloomer JC, Clarke SE, Maltas J. Rapid screening of taxol metabolites in human microsomes by liquid chromatography/electrospray ionization-mass spectrometry. Rapid Commun Mass Spectrom. 1996;10:1165–1168. doi: 10.1002/(SICI)1097-0231(19960731)10:10<1165::AID-RCM608>3.0.CO;2-J. [DOI] [PubMed] [Google Scholar]
- 27.Leatherbarrow RJ. Grafit. Staines, UK: Erithacus Software Ltd.; 1992. Version 3.0. [Google Scholar]
- 28.SAS./INSIGHT®. Users Guide. 2. SAS Campus Drive, Cary, NC: SAS Institute Inc.; 1993. p. 27513. Version 6. [Google Scholar]
- 29.Venkatakrishnan K, von Moltke LL, Greenblatt DJ. Human cytochromes P450 mediating phenacetin O-deethylation in vitro: validation of the high affinity component as an index of CYP1A2 activity. J Pharm Sci. 1998;87:1502–1507. doi: 10.1021/js980255z. [DOI] [PubMed] [Google Scholar]
- 30.Crespi CL. Xenobiotic-metabolizing human cells as tools for pharmacological and toxicological research. Adv Drug Res. 1995;26:179–235. [Google Scholar]
- 31.Cresteil T, Monsarrat B, Alvinerie P, Treluyer JM, Vieira I, Wright M. Taxol metabolism by human liver microsomes: Identification of cytochrome P450 isoenzymes involved in its metabolism. Cancer Res. 1994;54:386–392. [PubMed] [Google Scholar]
- 32.Sonnichsen DS, Liu Q, Schuetz EG, Schuetz JD, Pappo A, Relling MV. Variability in human cytochrome P450 paclitaxel metabolism. J Pharmacol Exp Ther. 1995;275:566–575. [PubMed] [Google Scholar]
- 33.Back DJ, Tjia JF, Karbwang J, Colbert J. In vitro inhibition studies of tolbutamide hydroxylase activity of human liver microsomes by azoles, sulphonamides and quinolines. Br J Clin Pharmacol. 1988;26:23–29. doi: 10.1111/j.1365-2125.1988.tb03359.x. [DOI] [PMC free article] [PubMed] [Google Scholar]
- 34.Wolfgang M. Rational assessment of the interaction profile of cerivastatin supports its low propensity for drug interactions. Drugs. 1998;56:15–23. doi: 10.2165/00003495-199856001-00003. [DOI] [PubMed] [Google Scholar]