Abstract
Aims
Platinum chemotherapy has been shown to have potent antineoplastic activity against various tumours, especially testicular, bladder, ovarian, head and neck cancers. This activity is accompanied by side-effects of nephrotoxicity and cumulative myelosuppression, the latter frequently presenting as severe anaemia. Cisplatin and carboplatin nephrotoxicity might lower erythropoietin (Epo) secretion and, by this mechanism, contribute to the anaemia that follows therapy with this chemotherapeutic agent. The aim of the present work is to study the plasma immunoerythropoietin and haemoglobin levels of cancer patients treated with platinum or 5-fluorouracil-based chemotherapy.
Methods
Plasma was obtained from 25 patients who were about to receive chemotherapy for advanced malignancy: 15 treated with cisplatin or carboplatin and 10 with nonplatinum drugs. Blood was collected on the first day (before drug administration) and around day 15 of every chemotherapy course. Complete blood count, creatinine and immunoreactive Epo levels were also measured in 22 healthy volunteers.
Results
An increase in Epo levels occurred following every course of 5-FU or platinum based chemotherapy in patients with steady concentrations of creatinine and decreased levels of haemoglobin (Hb). In particular, we observed an increase after about 15 days of the chemotherapy treatment and the Epo levels declined toward normal just before the following course. This phenomenon was evident in every course.
Conclusions
Our results suggest that chemotherapy administration, using the current standards of hydration and forced diuresis, slightly lowered Hb levels but did not depress Epo production, both in 5-FU and in platinum treated subjects.
Keywords: 5-FU therapy, anticancer chemotherapy, cancer anaemia, cancer therapy, plasma erythropoietin, platinum therapy
Introduction
In adult humans, erythropoietin (Epo) is a glycoprotein hormone primarily produced outside the bone marrow by a single organ, the kidney; this molecule plays a critical role in the regulation of the red blood cells (RBC) mass, participating in a classic negative feedback control from a renal oxygen sensor to the erythroid system. Epo mediates this feedback, and its rate of production is inversely proportional to the renal oxygen tension, which itself is determined by haemoglobin concentration, pulmonary function, cardiac output, and renal blood flow [1, 2]. Under normal circumstances, the circulating red cell mass is maintained at a homeostatic level in each individual, although that level may vary by more than 10% among individuals of the same age and gender.
Anaemia is commonly observed in patients with malignant neoplasm. Along with many other factors causing anaemia in cancer patients, such as haemorrhage, abnormalities in iron metabolism, bone marrow failure, haemolysis, cachexia, malnutrition and concurrent infections with disorders of the reticuloendothelial system, anticancer drugs are thought to be one of the principal causes.
Most anticancer drugs adversely affect the haematopoietic system. Platinum and non platinum drugs, used widely in chemotherapy, not only act directly upon bone marrow cells and haematopoietic progenitor cells but also indirectly affect the haematopoietic system by their effects on the bone marrow microenvironment, or by their interactions with cells or factors that regulate haematopoiesis [3].
In the case of a bone marrow toxic effect an increase of the Epo plasma levels would be expected; on the contrary a decrease in Epo levels due to a toxic effect of the anticancer drugs on the renal cells producing Epo is observed.
Platinum chemotherapy has been shown to have potent antineoplastic activity but it is accompanied by side-effects of nephrotoxicity and cumulative myelosuppression, the latter frequently presenting as severe anaemia. Several authors have speculated that cisplatin and carboplatin nephrotoxicity might lower erythropoietin secretion and, by this mechanism, contribute to the anaemia that follows therapy with these chemotherapeutic agents [4]. There is also evidence that cytostatic drugs cause an increase in Epo production not mediated through anaemia but possibly initiated by a cytostatic effect on the kidneys or by an unknown stimulatory factor, responsive to bone marrow inhibition [5, 6]. However, recent results in human and rat studies indicate that the primary aetiology of cisplatin-associated anaemia is a transient, but persistant Epo deficiency state, resulting from cisplatin-induced renal tubular damage, which can be prevented or treated by Epo replacement [7].
Recent observations in patients injected with 5-fluorouracil showed a progressive increase of serum Epo levels for 15 days after the administration of chemotherapy. These data appear to indicate that the increase in serum Epo, which was not related to anaemia, may follow the administration of a cytotoxic drug at doses used in routine, clinical practice [8].
The purpose of this work was to investigate plasma Epo concentrations in cancer patients with various advanced solid malignancies treated with platinum or 5-fluorouracil-based chemotherapy and to investigate whether the changes in Epo concentrations are mediated through anaemia; furthermore, creatinine concentrations were monitored during the treatment as a generic index of renal function.
Methods
This study was conducted in accordance with the Helsinki Declaration and was approved by the Ethics Committee of Evangelico Valdese Hospital of Torino, Italy; written informed consent was obtained from each participant before beginning treatment.
Patient population
A total of 25 consecutive subjects, who were about to receive six courses of chemotherapy for various advanced solid malignancies, were selected for our study.
After the clinical decision 15 patients, Group A, received platinum-based chemotherapy (cisplatin or carboplatin) alone or in combination with other chemotherapeutic agents and 10 patients, group B, received 5-fluorouracil-based chemotherapy in combination with other drugs. Preparative regimens varied according to the protocols used and the patient's diagnosis (Tables 1 and 2). Entry criteria for this analysis demanded no prior chemotherapy and good personal status, particularly renal function (haemoglobin concentration > 90 g l−1, haematocrit [Ht] > 40% and creatinine 107 µmol/l.
Table 1.
Patients characteristics at the beginning of the study (group A).
| Group A | Age (years) | Sex | Diagnosis | Therapy | Dose1 | Hb2 | Epo3 | Cr4 |
|---|---|---|---|---|---|---|---|---|
| Patient 1 | 60 | M | Head and neck cancer | Cisplatin | 100 | 149 | 10.23 | 74.3 |
| 5-Fluorouracil | 2000 | |||||||
| Patient 2 | 55 | F | Head and neck cancer | Carboplatin | 45 | 111 | 12.00 | 54.8 |
| Patient 3 | 60 | M | Head and neck cancer | Cisplatin | 100 | 137 | 14.29 | 69.0 |
| 5-Fluorouracil | 2000 | |||||||
| Patient 4 | 67 | F | Head and neck cancer | Carboplatin | 580 | 155 | 9.11 | Missing |
| Paclitaxel | 175 | |||||||
| Patient 5 | 56 | M | Head and neck cancer | Carboplatin | 580 | 148 | 9.39 | 109.6 |
| Paclitaxel | 175 | |||||||
| Patient 6 | 60 | F | Ovarian carcinoma | Carboplatin | 580 | 111 | 32.82 | 73.4 |
| Paclitaxel | 175 | |||||||
| Patient 7 | 67 | M | Head and neck cancer | Cisplatin | 80 | 156 | 8.10 | 63.6 |
| Patient 8 | 63 | F | Head and neck cancer | Cisplatin | 80 | 139 | 5.58 | 53.9 |
| 5-Fluorouracil | 1600 | |||||||
| Patient 9 | 59 | M | Colon-rectal cancer | Cisplatin | 80 | 154 | 20.07 | 76.0 |
| 5-Fluorouracil | 1600 | |||||||
| Patient 10 | 43 | F | Colon-rectal cancer | Carboplatin | 700 | 166 | 5.94 | 77.8 |
| Paclitaxel | 175 | |||||||
| Patient 11 | 68 | M | Head and neck cancer | Cisplatin | 100 | 145 | 11.90 | 119.3 |
| 5-Fluorouracil | 2000 | |||||||
| Patient 12 | 63 | M | Head and neck cancer | Carboplatin | 45 | 136 | 8.07 | 65.4 |
| Patient 13 | 73 | F | Ovarian carcinoma | Carboplatin | 400 | 119 | 20.03 | 81.3 |
| Paclitaxel | 175 | |||||||
| Patient 14 | 54 | M | Head and neck cancer | Cisplatin | 100 | 147 | 41.13 | 44.2 |
| 5-Fluorouracil | 2000 | |||||||
| Patient 15 | 36 | F | Head and neck cancer | Cisplatin | 100 | 107 | 15.29 | 62.8 |
| 5-Fluorouracil | 2000 | |||||||
| Mean | 138.67 | 14.93 | 73.2 | |||||
| Median | 145.00 | 11.90 | 71.2 | |||||
| s.d. | 18.48 | 10.09 | 20.3 |
Dose mg/m2
Hb g/l
Erythropoietin (Epo) mU/ml
Creatinine (Cr) μmol/l.
Table 2.
Patients characteristics at the beginning of the study (group B).
| Group B | Age (years) | Sex | Diagnosis | Therapy | Dose1 | Hb2 | Epo3 | Cr4 |
|---|---|---|---|---|---|---|---|---|
| Patient 1 | 70 | M | Colon-rectal cancer | 5-Fluorouracil | 375 | 136 | 14.44 | 88.4 |
| Leucovorin | 100 | |||||||
| Patient 2 | 52 | F | Colon-rectal cancer | 5-Fluorouracil | 375 | 118 | 9.40 | 84.0 |
| Leucovorin | 100 | |||||||
| Patient 3 | 63 | F | Colon-rectal cancer | 5-Fluorouracil | 375 | 131 | 13.94 | 58.4 |
| Leucovorin | 100 | |||||||
| Patient 4 | 52 | F | Colon-rectal cancer | 5-Fluorouracil | 375 | 123 | 21.04 | 53.0 |
| Leucovorin | 100 | |||||||
| Patient 5 | 79 | F | Colon-rectal cancer | 5-Fluorouracil | 375 | 142 | 16.12 | 66.3 |
| Leucovorin | 100 | |||||||
| Patient 6 | 64 | M | Colon-rectal cancer | 5-Fluorouracil | 375 | 130 | 24.78 | 74.3 |
| Leucovorin | 100 | |||||||
| Patient 7 | 64 | M | Head and neck cancer | Vinorelbin | 20 | 128 | 13.11 | 66.3 |
| Docetaxel | 80 | |||||||
| Patient 8 | 54 | M | Colon-rectal cancer | 5-Fluorouracil | 2000 | 152 | 12.51 | 61.0 |
| Mitomicina | 15 | |||||||
| Patient 9 | 70 | F | Colon-rectal cancer | 5-Fluorouracil | 375 | 130 | 29.51 | 70.7 |
| Leucovorin | 100 | |||||||
| Patient 10 | 64 | M | Colon-rectal cancer | 5-Fluorouracil | 370 | 110 | 33.80 | 81.4 |
| Leucovorin | 10 | |||||||
| Mean | 130.00 | 18.87 | ||||||
| Median | 130.00 | 15.28 | ||||||
| s.d. | 11.84 | 8.10 | 11.6 |
Dose mg/m2
Hb g/l
Erythropoietin (Epo) mU/ml
Creatinine (Cr) μmol/l.
Plasma samples for Epo, complete blood count and creatinine were collected before administration of every chemotherapeutic course (indicated as precourse) and during every course, between day 14 and 18 (day 15) after drug administration (Tables 3 and 4).
Table 3.
Number of subjects treated in every chemotherapeutic course and number of days between the start of the chemotherapic treatment and the first day of every chemotherapeutic course.
| Courses | 1 | 2 | 3 | 4 | 5 | 6 |
|---|---|---|---|---|---|---|
| Group A: number of subjects | 15 | 15 | 13 | 9 | 6 | 4 |
| Time schedule of courses (median days) | 0 | 28 | 46 | 77 | 103 | – |
| Time schedule of courses (interquartile range) | – | 21–32 | 42–62 | 65–98 | 92–130 | – |
| Group B: number of subjects | 10 | 10 | 8 | 8 | 8 | 6 |
| Time schedule of courses (median days) | 0 | 29 | 59 | 91 | 122 | 143 |
| Time schedule of courses (interquartile range) | – | 28–33 | 58–101 | 80–132 | 114–174 | 134–160 |
Table 4.
Number of blood samples and days between the first day of each chemotherapeutic course and the day of mid-course blood collection.
| Intra-cycle days | Course 1 | Course 2 | Course 3 | Course 4 | Course 5 | Course 6 | |
|---|---|---|---|---|---|---|---|
| Group A | Number of samples | 11 | 12 | 9 | 4 | 4 | 0 |
| Epo | Median (days) | 16 | 15 | 14 | 18 | 14 | – |
| Inter-quartile range | 15–20 | 14–18 | 12–15 | 15–25 | 13–15 | – | |
| Group A | Number of samples | 11 | 12 | 7 | 5 | 5 | 0 |
| Hb | Median (days) | 16 | 14 | 15 | 15 | 14 | – |
| Inter-quartile dash;20 | 13–18 | 14–15 | 15–24 | 12–16 | – | ||
| Group B | Number of samples | 9 | 8 | 4 | 4 | 6 | 6 |
| Epo | Median (days) | 17 | 18 | 18 | 16 | 17 | 16 |
| Inter-quartile range | 17–19 | 16–19 | 17–24 | 13–17 | 17–19 | 14–17 | |
| Group B | Number of samples | 7 | 8 | 7 | 7 | 6 | 5 |
| Hb | Median (days) | 17 | 18 | 17 | 17 | 16 | 15 |
| Inter-quartile range | 17–19 | 14–19 | 15–19 | 14–18 | 14–18 | 14–18 |
Complete blood count was determined with a Coulter Counter® S5/60 cells counter (Instrumentation Laboratory SpA Italy).
Reference population
Twenty-two healthy volunteers with normal complete blood count and normal renal function served as controls for Epo concentrations.
Radioimmunoassay
Plasma immunoreactive Epo concentrations were measured by a standard radioimmunoassay kit, the INCSTAR Epo-Trac 125I RIA, based on competitive binding which utilizes goat anti-Epo (primary antibody), donkey antigoat precipitating complex (DAG-PPT, secondary) and recombinant human erythropoietin for both tracer and standards. Heparinized blood from patients was separated immediately by centrifugation and stored at −28 °C until assay; samples in test were incubated first with primary antibody for 2 h, then with Epo-125I (overnight, 4 °C) and later with addition of precipitating complex. After centrifugation, standards and samples were counted with a gamma-counter Cobra model (Canberra Packard, USA). Frozen plasma was held until all cycles of the chemotherapy were completed, so samples from each individual was assayed simultaneously and interpreted against a common standard curve with 5 calibration points (+ blank) and 2 controls (C1 = low, range 10–21 mU ml−1; C2 = medium, 47–72 mU ml−1).
Reproducibility, accuracy, sensitivity (LOQ), and specificity linearity of the method were evaluated according to current recommendations [9]. The intraday coefficients of variation were about 9% for C1 and 5% for C2, while the interday CV were 14% and 5%, respectively; accuracy was 103.8%, sensitivity was 4.4 mU ml−1 and linearity was demonstrated by correlation which exceeded 0.996. All parameters were considered acceptable and the method was judged reliable for the analysis.
Statistical analysis
The statistical analysis was carried out using erythropoietin (Epo) and haemoglobin (Hb) data from 22 healthy volunteers and 25 patients. We analysed the concentration changes between the precourse levels (before drug administration) and day 15 (mid-course control) of each chemotherapeutic course. Subsequently, we analysed in each group of patients the trend of these variations during the whole period of treatment. Due to the non parametric distribution of our data, results are expressed as median values and interquartiles ranges.
All statistical tests were carried out with the computer program Minitab 12 for Windows® (Minitab Inc.). To evaluate the differences among the precourse levels of Epo and Hb, for each patients group, we employed the nonparametric Mood's Median Test. The null hypothesis was that the population medians are equal, and P values less than 0.05 were considered statistically significant.
To study the concentration changes between administration (precourse) and day 15 (middle course) of each course, we applied a Trend Analysis for fitting a general curve model to time series data.
Results
Patients characteristics at the beginning of the study, including age, sex, diagnosis, chemotherapy treatment, Hb, Epo and creatinine concentrations are presented in Table 1 and Table 2. The Epo concentrations in cancer patients before treatment were not statistically different from the Epo concentrations in normal healthy volunteers (Mood's Median Test: P = 0.106).
In Table 3 we present the number of subjects treated in every chemotherapeutic course and the number of days between the start of the chemotherapeutic treatment and the first day of every chemotherapeutic course. In Table 4, for every chemotherapeutic course, we show the number of subjects in whom we were able to collect blood samples for Hb and Epo measurements and the days between the precourse day and the mid-course day of blood collection.
Epo levels in relation to courses and Hb levels
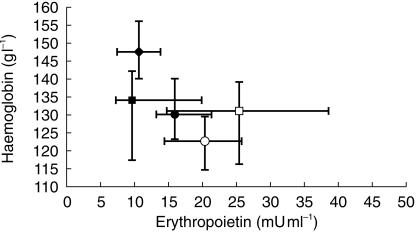
The Epo and Hb concentrations of the healthy subjects and of the treated patients before and after the chemotherapeutic courses are reported in Figure 1. These was wide variability of the overall values: healthy subjects show high Hb and low Epo concentrations. Overlapping values were present in patients only at the beginning of the study, while during the treatment Hb started to decrease and Epo concentrations increased. No patient showed low concentratations of Hb and erythropoietin. Only patients assessed at day 15 of the chemotherapeutic courses showed Epo concentrations greater than 25 mU ml−1.
Figure 1.
Epo vs Hb levels (medians and interquartile ranges) of healthy volunteers (♦) and patients in every chemotherapeutic course, distinguished in precourse (▪) and mid-course (□) of platinum treatment; precourse (•) and mid-course (○) of non platinum treatment.
Epo concentrations in relation to courses and creatinine
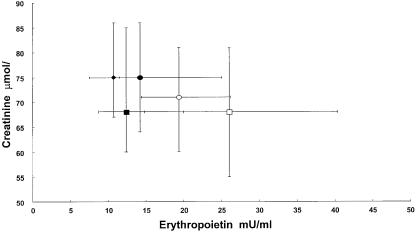
The Epo and creatinine concentrations of the normal subjects and of the treated patients in all the chemotherapeutic courses are reported in Figure 2. The creatinine concentrations remain in the physiological range with a reduced variability during the chemotherapeutic courses. During treatment only 12 patients showed creatinine levels above 1.20 mg/100 ml (??µmol l−1) with low levels of Epo, but the same subjects developed an increase of Epo following chemotherapy treatment.
Figure 2.
Epo vs creatinine levels (medians and interquartile ranges) of healthy volunteers (♦) and patients in every chemotherapeutic course, distinguished in precourse (▪) and mid-course (□) of platinum treatment; in precourse (•) and mid-course (○) of non platinum treatment.
Epo concentrations during the chemotherapy courses
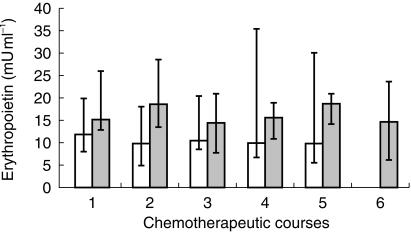
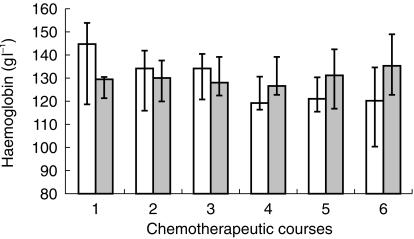
Epo and Hb concentrations at the beginning of every chemotherapeutic course (precourse concentrations) are reported in Figures 3 and 4. Mood's Median Test showed no statistical differences between these concentrations during the period of the treatment, but Hb concentrations in group A decreased during the treatment period, although the decrease was not statistical significant (P = 0.07).
Figure 3.
Pre-course Epo levels in platinum (□) and nonplatinum ( ) treated patients, measured in every chemotherapeutic course
Figure 4.
Pre-course Hb levels in platinum (□) and nonplatinum ( ) treated patients, measured in every chemotherapeutic course.
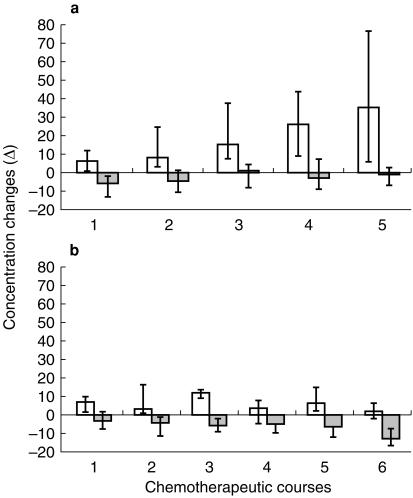
In Figure 5a we report the change of plasma Epo and Hb concentrations between the drug administration day (precourse) and about day 15 after injection (mid-course) in platinum treated patients. During every chemotherapeutic course we observed an increase of Epo in the mid course sample, with a modest decrease in Hb concentration. The Epo response increased throughout the chemotherapeutic courses, while Hb changes were relatively constant.
Figure 5.
Medians and interquartile ranges of the Epo mU/ml (□) and Hb g/l ( ) concentrations changes between drug administration day (precourse) and day 15 (mid-course) in every chemotherapeutic course, distinguished in platinum (a) and nonplatinum (b) groups.
In Figure 5b we present the results of the non platinum treated subjects: 15 days after the treatment each patient showed an increase in Epo plasma concentration that was variable for each course. The Hb levels progressively decreased with the lowest level during the last chemotherapeutic course.
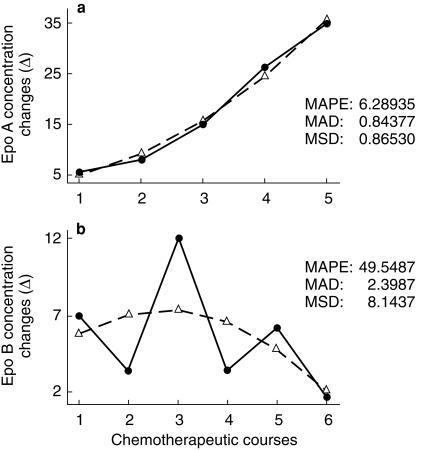
Using a Trend Analysis in platinum treated patients the Epo response increased from the first to the last chemotherapeutic course (Figure 6a); this curve was best fitted with a quadratic function. On the contrary in 5-FU treated subjects the trend was highly variable (Figure 6b).
Figure 6.
Trend analysis of Epo concentration changes (mU ml−1) in platinum (a) and nonplatinum (b) groups (MAPE = Mean Absolute Percentage Error, MAP = Mean Absolute Deviation and MSD = Mean Squared Deviation); actual, fits, solid line actual, dashed line fits.
Anaemia in patients 6 A and 7 A
During the study no patient showed abnormal creatinine values, but two platinum treated subjects developed anaemia after the sixth cycle; these patients started the treatment with values in the normal range (see Table 1). In both the Epo concentrations increased significantly and were elevated (61.24 and 49.78 mU ml−1, respectively) when the Hb concentrations decreased below 90 g l−1 (86 and 89 g l−1). Patient 6 A received erythropoietin (Eprex® 10 mU, 3 times for a week) without improvement of the anaemia (Hb 91 g l−1), and he was transfused with good clinical results (Hb 113 g l−1). Patient 7 A received a blood transfusion to correct the anaemia.
Discussion
Our results demonstrated that an increase in Epo concentrations occurred after every administration of 5-FU or platinum based chemotherapy in patients with decreased concentrations of Hb and steady creatinine blood concentrations. In particular we observed an increase in the middle of each course of the chemotherapy treatment and the Epo concentrations declined towards basal just before the following course. This phenomenon was evident in every course. Only in platinum treated patients did the Trend Analysis show a progressive increase in Epo response from the first to the last chemotherapeutic course. Renal function was not related to Epo production.
The finding that cytostatic treatments caused an increase in Epo response not triggered by anaemia or hypoxia has been observed by several authors [6, 8, 10, 11].
Various interpretations have been proposed for the observed serum Epo increase before the decrease in Hb after treatment with cytostatic drugs: (1) cytotoxic therapy causes direct injury to Epo production cells in the kidney in manner that mimics hypoxia; (2) bone marrow inhibition triggers an unknown stimulus for Epo production; recently some authors observed an inverse relationship between erythroid activity and Epo levels after myelosuppressive therapy [12]; (3) a decreased mass of erythroid precursors disrupts the usual Epo degradation pathway, reduced Epo use resulting in prolonged Epo lifespan and concentration [13]; (4) as protein synthesis and protein transcription are necessary for the normal degradation of Epo mRNA, it is also possible that cytotoxic drugs could enhance Epo mRNA stability with a consequent increase in protein synthesis. However some experimental data contradict this hypothesis [14–16].
The present data demonstrated that plasma Epo concentrations were elevated after each administration of chemotherapy and, in platinum treated patients, continued to increase as the course of chemotherapy advanced. This result is coincident with that of patients with leukaemia [6, 17], gynaecological cancer and in vivo animal studies [18], but in our study we were able to extend the observations for a longer period and we documented an increase of Epo blood concentration in the middle of the chemotherapy course followed by a return to normal values.
With the trend analysis we have shown that during the six platinum chemotherapic courses there is a progressive increase of the Epo response at the 15th day following injection; this is probably due to an enhanced sensitivity of the mechanism responsible of the Epo release following platinum injection. We were unable to demonstrate a similar increase after 5-FU based chemotherapy.
Although several clinical trials have demonstrated that recombinant human erythropoietin (rhEpo) is an effective treatment in tumour or chemotherapy-induced anaemia, only a portion of patients respond to rhEpo therapy. In a recent controlled randomised study the relative Epo deficiency was not a predictive factor for response [19]. Furthermore, Abels et al. found no statistical significant relationship between endogenous Epo concentration and response to rhEpo treatment in patients whose chemotherapy contained platinum and those whose chemotherapy did not [20]. The reasons for these findings are still unclear but may be related to our observation, confirmed by several other studies, of temporary increased levels of erythropoietin after administration of cyclic chemotherapy [17].
Recent data from Beguin et al. point to an inverse relationship between marrow erythropoietic activity and serum Epo concentrations: the higher the number of erythroid precursors, the lower the serum Epo value [14]. This observation suggests that the increased Epo levels we observed after chemotherapy could happen through a mechanism (yet to be elucidated) by which marrow erythropoiesis influences the rate of Epo production by the kidney.
It is generally accepted that the cells responsible for Epo synthesis are renal peritubular interstitial cells including endothelial cells [2]. Since the nephrotoxicity of platinum based chemotherapy [21] is centred on the tubule and the interstitial tissue, it is possible to hypothesize that platinum may affect the function of the renal oxygen sensor regulating Epo synthesis. In this study the treated patients did not show any pathological increase of creatinine blood level and we were unable to show any statistical significant correlation between Epo concentrations and creatinine concentrations. These data confirm previous results [6], but it is still possible that the cytostatic drugs have a toxic effect on the kidney that trigger Epo production in the same or similar way to that of cobalt.
Conflicting data are reported on the use of Epo to treat anaemia after chemotherapy. In the present study, the level of haemoglobin reduction experienced in patients with chemotherapy anaemia was always associated with a lack of Epo deficiency. Further studies are in progress to elucidate the precise mechanism of Epo blood concentrations increase after chemotherapic treatment and to follow more closely the Epo concentrations during the 4 weeks of the chemotherapic course. Based on the results this study, we think that clinical pharmacological studies will be useful to evaluate the place of erythropoietin therapy in anaemic cancer patients treated with chemotherapy.
References
- 1.Lacombe C, Da Silva JL, Bruneval P, et al. Peritubular cells are the site of erythropoietin synthesis in the murine hypoxic kidney. J Clin Invest. 1988;81:620. doi: 10.1172/JCI113363. [DOI] [PMC free article] [PubMed] [Google Scholar]
- 2.Koury ST, Bondurant MC, Koury MJ. Localization of erythropoietin synthetizing cells in murine kidneys by in situ hybridization. Blood. 1988;71:524. [PubMed] [Google Scholar]
- 3.Matsumoto T, Endoh K, Kamisango K, et al. Effect of recombinant human erythropoietin on cancer drug-induced anaemia. Br J Haematology. 1990;75:463–468. doi: 10.1111/j.1365-2141.1990.tb07783.x. [DOI] [PubMed] [Google Scholar]
- 4.Fjornes T, Wiedemann GJ, Sack K, et al. Serum erythropoietin and creatinine concentrations as predictive factors for response to recombinant human erythropoietin treatment in anaemic tumor patients on chemotherapy. Oncol Reports. 1998;5:81–86. [PubMed] [Google Scholar]
- 5.Hasegawa I, Tanaka K. Serum erythropoietin levels in gynaecologic cancer patients during cisplatin combination chemotherapy. Gynaecologic Oncol. 1992;46:65–68. doi: 10.1016/0090-8258(92)90198-r. [DOI] [PubMed] [Google Scholar]
- 6.Birgegard G, Wide L, Simonsson B. Marked erythropoietin increase before fall in Hb after treatment with cytostatic drugs suggests mechanism other than anaemia for stimulation. Br J Haematology. 1989;72:462–466. doi: 10.1111/j.1365-2141.1989.tb07733.x. [DOI] [PubMed] [Google Scholar]
- 7.Wood PA, Hrushesky WJM. Cisplatin-associated anaemia: an erythropoietin deficiency syndrome. J Clin Invest. 1995;95:1650–1659. doi: 10.1172/JCI117840. [DOI] [PMC free article] [PubMed] [Google Scholar]
- 8.Cerutti A, Castello G, Balleari E, et al. Serum erythropoietin increase in patients receiving adjuvant therapy with 5-fluorouracil and leucovorin. Exp Hematol. 1994;22:1261–1263. [PubMed] [Google Scholar]
- 9.Shah VP, Midha KK, Dighe S, et al. Analytical methods validation: bioavailability, bioequivalence and pharmacokinetic studies. J Pharm Sci. 1992;81:309–312. doi: 10.1007/BF03189968. [DOI] [PubMed] [Google Scholar]
- 10.Smith DH, Goldwasser E, Vokes EE. Serum immunoerythropoietin levels in patients with cancer receiving cisplatin-based chemotherapy. Cancer. 1991;68:1101–1105. doi: 10.1002/1097-0142(19910901)68:5<1101::aid-cncr2820680533>3.0.co;2-l. [DOI] [PubMed] [Google Scholar]
- 11.Schapira L, Antin JH, Ransil BJ, et al. Serum erythropoietin levels in patients receiving intensive chemotherapy and radiotherapy. Blood. 1990;76:2354–2359. [PubMed] [Google Scholar]
- 12.Cazzola M, Guarnone R, Cerani P, et al. Red blood cell precursor mass as an independent determinant of serum erythropoietin level. Blood. 1998;91:2139–2145. [PubMed] [Google Scholar]
- 13.Stohlman FJ, Brecher G. Hormonal regulation of erythropoiesis vs. relationship of plasma Epo level to bone marrow activity. Proc Soc Exp Biol Med. 1959;100:40–44. doi: 10.3181/00379727-100-24516. [DOI] [PubMed] [Google Scholar]
- 14.Beguin Y, Baron F, Fillet G. Influence of marrow erythropoietic activity on serum erythropoietin levels after autologus hematopoietic stem cell transplantation. Hematologica. 1998;83:1076–1081. [PubMed] [Google Scholar]
- 15.Wolff M, Jelkmann W. Effects of chemotherapeutic and immunosuppressive drugs on the production of erythropoietin in human hepatoma cultures. Ann Hematol. 1993;66:27–31. doi: 10.1007/BF01737686. [DOI] [PubMed] [Google Scholar]
- 16.Jelkmann W, Wolff M, Fandrey J. Inhibition of erythropoietin production by cytokines and chemotherapy may contribute to the anemia in malignant diseases. Adv Exp Med Biol. 1994;345:525–530. doi: 10.1007/978-1-4615-2468-7_70. [DOI] [PubMed] [Google Scholar]
- 17.Piros E, Erslev A, Caro J. Inappropriate increase in erythropoietin titers during chemotherapy. Am J Hematol. 1989;32:248–254. doi: 10.1002/ajh.2830320403. [DOI] [PubMed] [Google Scholar]
- 18.Rothmann SA, Paul P, Weick JK, et al. Effects of cis diamminedichloroplatinum on erythropoietin production and hematopoietic progenitor cells. Int J Cell Cloning. 1985;3:415–423. doi: 10.1002/stem.5530030607. [DOI] [PubMed] [Google Scholar]
- 19.Oberhoff C, Neri B, Amadori D, et al. Recombinant human erythropoietin in the treatment of chemotherapy-induced anaemia and prevention of transfusion requirement associated with solid tumours: a randomized, controlled study. Ann Oncol. 1998;9:255–260. doi: 10.1023/a:1008296622469. [DOI] [PubMed] [Google Scholar]
- 20.Abel RI. Recombinant human erythropoietin in the treatment of anaemia of cancer. Acta Haematol. 1992;87:4–11. doi: 10.1159/000204780. [DOI] [PubMed] [Google Scholar]
- 21.Medias NE, Harrington JT. Platinum nephrotoxicity. Am J Med. 1978;65:307–314. doi: 10.1016/0002-9343(78)90825-2. [DOI] [PubMed] [Google Scholar]


