

Abstract
Aims
To assess the pharmacodynamics of moxonidine in patients with functional NYHA Class II-III congestive heart failure (CHF).
Methods
A parallel population pharmacokinetic/pharmacodynamic (PK/PD) analysis was performed to assess the effect of moxonidine (0.1, 0.2, 0.3 mg twice daily) and placebo treatment on plasma noradrenaline (NA) levels, standing systolic blood pressure (SBP), and heart rate (HR) over 12 weeks in 97 patients with CHF using a parallel group design with dose escalation. A sequential analysis was also developed, where the relative changes in NA concentration were related to both SBP and HR.
Results
In the parallel PD analysis, an effect delay was shown for all three end points (NA, SBP, and HR). An inhibitory Emax model was used to characterize the concentration-effect relationships. For SBP and HR, the EC50 value increased over time. For NA, there was a positive baseline drift over the 12 weeks; this was interpreted as disease progression. Moxonidine delayed this increase by 9.8 weeks. For SBP, there was a circadian pattern at baseline. In the sequential PD analysis, the relationship between the drug response (NA) and SBP or HR was best described by an inhibitory Emax model. No effect delays between the response and effects were found.
Conclusions
Effects of moxonidine on NA, SBP, and HR could be quantified by an effect compartment model in the presence of disease progression and circadian variations. Disease progression, as judged by increasing NA levels with time, was delayed by moxonidine. A direct relationship was found between NA and SBP/HR.
Keywords: heart rate, moxonidine, noradrenaline, pharmacodynamic modelling, systolic blood pressure
Introduction
Despite recent major advances, current treatment of congestive heart failure (CHF) is unsatisfactory. Angiotensin converting enzyme (ACE) inhibitors [1, 2] and the combination of hydralazine with isosorbide dinitrate [3] have been shown to cause a reduction in symptoms and mortality. However, even with the use of these agents the annual mortality in patients with New York Heart Association (NYHA) Class II-III CHF is approximately 10%. The mechanism accounting for the progression of CHF has not been established; however, increased neurohormonal activation has been proposed [4]. Supportive evidence includes significant elevation of noradrenaline (NA), which is correlated with the extent of physiologic circulatory abnormalities [5] and mortality [6, 7]. Therefore a reduction in neurohormonal activity may be clinically beneficial [8]. Inhibition of the sympathetic nervous system by β-adrenoceptor antagonists has been shown to reduce symptoms, improve left ventricular function, increase functional capacity [9], and reduce mortality [10] in patients with CHF. By adding spironolactone to standard therapy (e.g. blockade of aldosterone receptors), morbidity and mortality was reduced [11]. Thus, it is important to use drugs acting on different systems (i.e. sympathetic nervous system, angiotensin system, etc.) in order to reduce the risk of morbidity and mortality in patients with severe CHF.
Moxonidine, a selective imidazoline receptor (I1) agonist with central antihypertensive effects, inhibits peripheral release of NA but does not attenuate cardiac stimulation by physical exercise. This reduced sympathetic nervous system activity leads directly to an interference with vasoconstrictor mechanisms and thereby a reduction in systolic blood pressure (SBP) [12, 13]. The use of moxonidine as a potential adjuvant treatment for CHF is entirely consistent with the potential benefits of reduced sympathetic nervous system activity. In addition, this novel mechanism of action is claimed to lead to fewer adverse effects in comparison with older centrally acting agents such as clonidine, which acts on both α2-and I1-receptors [13]. It has been shown that the imidazoline receptor is responsible for the blood pressure lowering effects of clonidine, while α2-adrenoceptor stimulation leads to adverse effects such as sedation [14] and dry mouth [12].
The pharmacokinetics of moxonidine in healthy volunteers and hypertensive patients have been thoroughly studied. Moxonidine has been shown to have rapid and extensive gastrointestinal absorption (80–90%) and mainly renal excretion. The half-life is 2.0–3.0 h [12, 15].
Pharmacokinetic/pharmacodynamic (PK/PD) analysis frequently relies upon the use of a compartmental model, where a hypothetical effect compartment is linked to the plasma compartment via a first-order rate constant [16]. The effect site concentration is related to the measured effect by using different functional forms, i.e. linear, hyperbolic, and sigmoidal relationships [17]. With antihypertensive drugs, a conventional approach to PK/PD modelling consists in fitting separately each haemodynamic effect measured (parallel concentration-effect relationships). One of the major drawbacks of this approach is that it fails to recognise that some haemodynamic variables are physiologically related via regulation processes. An approach of modelling that is more closely related to the mechanism of drug action is to model the pharmacodynamic responses sequentially. Because in such modelling one pharmacodynamic model is driving another, the modelling approach may be termed PK/PD/PD. Also, the cardiovascular system is complex and contains both short-and long-term time-related variations, such as circadian changes and disease progression, which may be important to take into account during the development of pharmacodynamic models.
The aim of this study was to evaluate the effect of moxonidine on different pharmacodynamic effects (noradrenaline, standing systolic blood pressure, and heart rate) in patients with congestive heart failure.
Methods
Patients and study design
Ninety-seven patients with functional NYHA Class II-III CHF, were randomized to receive placebo or one of three doses of moxonidine (parallel study) in a Phase II, multicentre, dose-finding study. Active treatment started at 0.1 mg twice daily and was escalated to a pre-defined dose of 0.1, 0.2, or 0.3 mg twice daily. The study consisted of a 2 week single-blind screening period, a 4 week double-blind dose progression period (dosage increased at 1 week intervals), and an 8 week, double-blind maintenance period. The study was approved by the local ethics committees and was conducted according to the guidelines of the Declaration of Helsinki.
Patient selection criteria
Male or female patients, 21–79 years old, with a past history of clinically stable NYHA Class II-III CHF were enrolled into the study after each signed the informed consent form. Thereafter, they underwent an initial screening examination, including a physical examination and laboratory measurements. Patients were required to have a left ventricular ejection fraction of ≤40%, and not to have had a myocardial infarction in the last 90 days, or haemodynamically significant valvular or outflow tract obstruction, or severely reduced diastolic function, nor complex congenital heart disease. Active myocarditis, unstable angina, likelihood of cardiac surgery in the near future, life-threatening dysrhythmias, uncontrolled hypertension, SBP ≤ 90 mmHg or symptomatic hypotension, advanced pulmonary disease, cerebrovascular disease, collagen vascular disease, primary liver disease, renal artery stenosis, pregnant women or women of childbearing potential who were not acceptably protected also were not allowed.
Patients with a stable dose of ACE inhibitor as well as those who had previously failed ACE inhibitor therapy were allowed to enrol in the study. Stable administration of digoxin and diuretics were allowed, but the diuretic dosage could be reduced and had to be stable for at least 5 days before enrolment in the study. Other acceptable concomitant medication, which had to remain constant during the trial, were antiarrhytmic, antianginal, cholesterol-lowering, and/or antihypertensive drugs, except use of β-adrenoceptor blockers within the last 3 months and moxonidine within 1 month. Additional safety measurements of serum creatinine, haematology, urine analysis, chemistry, weight, electrocardiogram, symptoms of ischemic heart disease, NYHA classification, and adverse events were performed. Table 1 lists the characteristics of the patients involved in the study.
Table 1.
Summary of patient characteristics presented as median values with range or number of patients (97 patients).
| Characteristic | Value |
|---|---|
| Demographics | |
| Age (years) | 67 (43–78) |
| Weight (kg) | 77 (41–125) |
| Sex | |
| Female | n = 24 |
| Male | n = 73 |
| Laboratory parameters | |
| SCR (mol l−1) | 110 (60–170) |
| CLCR (ml min−1) | 64 (30–142) |
| New York Heart Association (NYHA) Classification | |
| II | n = 44 |
| III | n = 53 |
| Other cardiovascular drugs given | |
| ACE inhibitors | n = 58 |
| Diuretics | n = 93 |
| Digoxin | n = 62 |
Collection of blood samples
Blood samples for analysis of moxonidine were collected at 0.5, 1, 1.5, 2, 4, 6, and 8 h after the first morning dose and again after 12 weeks of therapy in 74 patients. A trough sample immediately before the last dose was also collected. Four patients were studied only after the first dose as they dropped out of the study before the second study period. The blood samples were collected into heparinized tubes and centrifuged for 10 min at 3000 rev min−1 and the plasma was immediately separated and frozen (at −70 °C) pending chemical analysis.
Additional blood samples were drawn for quantification of NA concentration immediately before and 1, 2, 4, and 8 h after the morning dose at three study occasions in all 97 patients (i.e. first dose and after 4 and 12 weeks of therapy). On each sampling occasion, plasma for NA estimation was collected in vials containing glutathione after 30 min of supine rest. The vials were promptly placed on ice and centrifuged for 20 min. Of the total number of NA concentrations that could have been measured, 94% were realized.
Blood pressure and heart rate measurements
Systolic BP and HR (standing) were evaluated over 8 h (immediately before dose and at 1, 2, 3, 4, 6, and 8 h after dose) at start of medication and after 4 and 12 weeks of medication. During dose escalation (i.e. week 1 and 2) and after 8 weeks of treatment, the effects were evaluated over 4 h (immediately before dose and at 1, 2, 3, and 4 h after dose). Two effect measurements for SBP, but not for HR were missing. Otherwise the two sampling patterns were identical.
Chemical assay
Plasma concentrations of moxonidine were analysed by a GC/MS method, which was validated at a range from 0.025 to 5.0 ng ml−1.
Data analysis
The concentration and effect data were analysed by nonlinear mixed effects modelling by means of NONMEM (versions V and VI beta), using the first-order approximation method (FO) as the standard method; the first-order conditional estimation method (FOCE) and a nonparametric method (available only in NONMEM VI) were also tested on the final models [18]. Mean population parameters were assessed, as well as interindividual, residual, and interoccasion variabilities. Individual parameter values were obtained by using Bayesian estimation, which was used in the characterization of the sequential response-effect relationships. An exponential variance model was used to describe the interindividual variability and an additive error model was used to characterize the residual errors. The basic assumption is that the residual errors are approximately normally distributed, but on occasion these may be log-normally distributed. This seemed to be the case for the pharmacokinetic and the NA data. Thus, the data for moxonidine and NA were log-transformed in the data file, enabling an additive error model, which corresponds approximately to a proportional error model on untransformed data. The nonparametric method does not assume a parametric distribution of the interindividual variability parameters, unlike both FO and FOCE. The nonparametric option is run in sequence with a parametric fit [15]. Interoccasion variability is a random variability in a subject's parameter values between study occasions [19]. Discrimination between different models was made by comparison of the objective function values (−2log likelihood) calculated by NONMEM and by visual inspection of the goodness of fit plots in the program Xpose (version 2) [20]. The difference between the objective function values for two hierarchical models is approximately χ2 distributed, where the degrees of freedom are based on the difference between the number of estimated parameters. The significance levels used were P < 0.001 in all analyses except during the covariate-model building using a stepwise generalized additive modelling (GAM), where the criterion for inclusion was P < 0.05. For final selection of covariates, the previous criterion was used (P < 0.001). During the model-building process different models were tested. Only the key models will be presented here.
The pharmacokinetics of the present study have been published [15]. A one-compartment model with first-order absorption and a lag-time was used to describe the concentration-time profile of moxonidine. Clearance was linearly related to the creatinine clearance.
Parallel pharmacodynamic analysis (PK/PD)
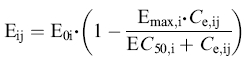
The model-building process was performed in different steps and several different models were tested. Firstly, as all three pharmacodynamic responses (NA, SBP, and HR) showed a lag behind the concentration-time profile, an effect compartment model with a first-order rate constant was used to account for the effect delay [16]. The time course of the effect site concentration is described by the rate constant ke0 from the effect compartment. An alternative model, the indirect response model, which can provide a delay that gives a better description of some mechanistic systems, was also tested [23]. Different functional forms (i.e. linear, Emax and sigmoidal Emax) were tested, where an Emax model related to baseline was found to best describe the relationship between the effect site concentration of moxonidine and NA according to the following equation:
 |
(1) |
in which Eij is the jth observed effect at the corresponding effect-site concentration (Ce,ij) of the ith individual; E0,i, Emax,i and EC50,i represent baseline, fraction of maximal drug effect, and concentration at half-maximal effect, respectively, for the ith individual. Because most NA concentrations were low relative to EC50, the functional form was parameterized in terms of Emax and Slope (ratio between Emax and EC50). This parameterization was also used in the analysis of SBP and HR. The time-dependent change in NA baseline was accounted for by adding an increasing slope to baseline, which was offset by drug treatment over time [22].
The same pharmacodynamic model was used both for SBP and HR, but with no slope on the baseline. Instead, a change in drug sensitivity was observed in both SBP and HR, as the effect of moxonidine decreased during the 12 weeks of treatment. Hence, a linear slope was added to the Slope in the functional form, in order to increase EC50 over time. In addition, a circadian cosine model described the SBP baseline. In all models, the drug effect was assumed to be additive to placebo effect. The PK and PD were analysed simultaneously with population parameters fixed to previously obtained values for the population.
The GAM procedure was used to identify covariates [24]. The GAM procedure is done outside NONMEM and is a multiple nonlinear regression analysis of the empirical Bayes estimates for each of the pharmaco-dynamic parameters and the available covariates. This procedure is included in the Xpose manual [20]. The following covariates were tested for significance: age, weight, gender, and creatinine clerance (CLCR; which was calculated based on age, weight, gender, serum creatinine concentration (SCR) according to the Cockroft & Gault equation) [21], N-terminal atrial natriuretic peptide, New York Heart Association classification (NYHA), randomized group, visit, time of day, duration since start of treatment, and concomitant medication with ACE-inhibitors, digoxin, or diuretics as three separate covariates. Some covariate information was missing from the data set. When covariate values were missing from some visits, but not others within the same patient, the latter were used to estimate the missing data. Serum creatinine was not recorded for one patient and this covariate value was replaced in the final model by the population median value, 110 µmol l−1.
The candidate covariates relationships are included in the nonlinear mixed effect model. Some covariates of particular interest were tested even if not indicated in the GAM model.
Finally, the model, including the statistical part (i.e. the part of the nonlinear mixed effects model that describes the variabilities of the parameters and the discrepancies between the observations and model prediction), was refined. All pharmacodynamic effect measurements were used in this data analysis. The final parallel PD analyses were reanalysed using the reduced data set, which was used in the sequential analysis.
Sequential pharmacodynamic analysis (PK/PD/PD)
According to the mechanism of drug action, moxonidine inhibits the release of NA, which decreases the vasoconstriction, resulting in attenuation of the SBP [13]. Thus, a more physiological approach would be to model the effect of NA on HR and SBP. To model the response-effect relationships between NA and SBP or HR, the empirical Bayes estimates for each of the final pharmacodynamic parameters of moxonidine and NA were used in the data file. The individual changes in NA concentrations from baseline over time were inserted in the response-effect relationships for both SBP and HR. As NA was used as a time-variant response, only data from week 1, 4, and 12 (0–8 h postdose) were used. The baseline changes in NA concentrations were both related with or without an effect delay to the time-variants in SBP and HR. Identification of covariate relationships was performed as described above.
Results
Parallel pharmacodynamic analysis (PK/PD)
The response-effect-time curves are depicted in Figures 1, 2, and 3. Baseline normalization is included in figures only for illustrative purposes. The population mean estimates for all three pharmacodynamic endpoints (NA, SBP, and HR) are shown in Table 2 and the corresponding goodness-of-fit plots are shown in Figure 4. All three effects showed a lag behind the concentration-time profile, which could be accounted for by a first-order delay through an effect compartment. All drug effects could be well described by an inhibitory Emax model. For NA, there was a positive baseline drift (2.3%/week) over the 12 weeks, which was interpreted as disease progression. A change of 28% was estimated in the placebo group after 12 weeks of treatment, from 395 ng ml−1 to 504 ng ml−1. This pronounced change in baseline over time was less marked in the drug-treated groups, where an increase of only 5% was estimated (from 395 ng ml−1 to 413 ng ml−1). Moxonidine offset this disease progression by, on average, 9.8 weeks. This significant delay in disease progression was not found to be dose-dependent.
Figure 1.

The change in noradrenaline concentrations relative to baseline for placebo (▪) and divided total daily moxonidine doses of 0.2 mg (□), 0.4 mg (▴), and 0.6 mg (▵) vs time (mean ± 2 s.e. mean) observed at start of treatment (week 0), after 2 weeks maintenance dose (week 4), and after additional 8 weeks steady state treatment (week 12).
Figure 2.

The change in blood pressure relative to baseline for placebo (▪) and divided total daily moxonidine doses of 0.2 mg (□), 0.4 mg (▴), and 0.6 mg moxonidine (▵) vs time (mean ± 2 s.e.mean) observed at start of treatment (week 0), after each dose escalation (week 1 and 2), and during steady state (week 4, 8, and 12).
Figure 3.

The change in heart rate relative to baseline for placebo (▪) and divided total daily moxonidine doses of 0.2 mg (□), 0.4 mg (▴), and 0.6 mg (▵) moxonidine vs time (mean ± 2 s.e.mean) observed at start of treatment (week 0), after each dose escalation (week 1 and 2), and during steady state (week 4, 8, and 12).
Table 2.
Population pharmacodynamic parameter estimates from the parallel (MOX-NA, MOX-SBP and MOX-HR; full and reduced data set) and sequential (MOX-NA-SBP and MOX-NA-HR) pharmacodynamic analysis. Values are given as the mean population estimate (± %RSE).
| MOX-NA | MOX-SBP | NA-SBP | MOX-HR | NA-HR | |||
|---|---|---|---|---|---|---|---|
| Data set | full | full | reduced | reduced | full | reduced | reduced |
| Pharmacodynamic submodel | |||||||
| Baseline | 395 | 126 | 125 | 126 | 78 | 77 | 77 |
| (ng l−1 – mmHg – beats min−1) | (4) | (2) | (2) | (2) | (1) | (1) | (1) |
| Slope (= Emax/EC50) | 26 | 16 | 27.5 | 0.24 | 9.3 | 4.7 | 0.18 |
| (%decrease/ng ml−1) | (27) | (25) | (20) | (32) | (20) | (43) | (43) |
| Emax | 47 | 20 | 19 | 12 | 25 | 16 | 5.2 |
| (%) | (25) | (21) | (16) | (30) | (46) | (84) | (22) |
| ke0 | 1.1 | 0.60 | 0.41 | – | 0.49 | 0.32 | – |
| (h−1) | (65) | (46) | (22) | (21) | (47) | ||
| Covariate submodel | |||||||
| Baseline increase with time | 2.3 | – | – | – | – | – | – |
| (%/week) | (17) | ||||||
| Delay in disease progression with drug | 9.8 | – | – | – | – | – | – |
| (weeks) | (14) | ||||||
| Decrease in drug effect | – | 4.5 | 5.1 | 5.9 | 6.4 | 5.7 | 6.6 |
| (Slope) (%/week) | (27) | (17) | (29) | (16) | (29) | (5) | |
| Diurnal baseline change – peak time | – | 22:00 | 22:00 | 23:00 | – | – | – |
| (hh:mm) | (4) | (4) | (3) | ||||
| Diurnal baseline change – magnitude | – | 4.3 | 5.3 | 6.3 | – | – | – |
| 100* (peak-average)/average | (20) | (15) | (18) | ||||
| Statistical submodel | |||||||
| Inter-individual variability in Baseline | 37 | 15 | 15 | 15 | 13 | 13 | 13 |
| (%) | (7) | (7) | (7) | (7) | (8) | (9) | (9) |
| Inter-individual variability in Slope | 110 | 220 | 147 | 212 | 120 | 182 | 444 |
| (%) | (34) | (31) | (28) | (31) | (22) | (43) | (36) |
| Inter-individual variability in ke0 | 160 | 140 | 122 | – | – | – | – |
| (%) | (37) | 30) | (25) | ||||
| Interoccasion variability in Baseline | 18 | 6.0 | 6.0 | 5.7 | 5.5 | 6.0 | 6.0 |
| (%) | (7) | (6) | (8) | (8) | (7) | (9) | (8) |
| Residual variability | 20 | 8.0 | 7.9 | 8.3 | 5.3 | 5.2 | 5.2 |
| (%CV – s.d.(mmHg) – s.d.(beats min−1)) | (5) | (3) | (3) | (3) | (3) | (4) | (3) |
Figure 4.

Basic goodness of fit plots for the final parallel analysis (full data set) of noradrenaline (left panel), standing systolic blood pressure (middle panel), and heart rate (right panel) model, respectively. All plots shows the predictions based on population parameter estimates (PRED) and individual parameter estimates (IPRED) vs the observed effects (DV). The solid diagonal lines are the lines of identity.
For SBP there was a circadian pattern at baseline, which was modelled using a cosine function. The baseline SBP was on average 9% higher in the evening than in the morning, with a maximum at 22 : 00. The average SBP baseline was estimated to be 126 mmHg. The inhibitory Emax models describing NA, SBP, and HR at the first dose were characterized by Emax values of 47%, 20%, and 25%; EC50 values of 1.8 (range 0.4–3.9), 1.2 (range 0.03–25), and 2.7 (range 0.25–10) ng ml−1; and ke0 values of 1.1, 0.60, and 0.49 h−1, respectively. The interindividual variability of ke0 was large for both NA and SBP, but close to zero for HR data. The maximal effect was estimated with no interindividual variability. For SBP and HR the EC50 value increased over time (4.5 and 6.4%/week, respectively). There were no significant correlations between any of the covariates and drug response. Due to high interindividual variability in ke0 and EC50 (Slope), the pharmacodynamic analysis was rerun using the nonparametric method. The nonparametric method reduced the interindividual variabilities by about 50%, without any changes in the population estimates except for the 26% increase in the slope of NA. This corresponds to an EC50 of 1.4 ng ml−1 for the nonparametric analysis as compared with the value of 1.8 ng ml−1 for the parametric analysis. The use of the FOCE method resulted in slightly higher Emax and EC50 values of NA.
Sequential pharmacodynamic analysis (PK/PD/PD)
Response-effect relationships were obtained by relating the drug-induced changes in NA concentration to SBP or HR. The final population estimates are shown in Table 2. The sequential and parallel models performed equally, with similar objective function values for HR and for SBP. No differences in goodness-of-fit plots could be detected between the models. In the sequential model, no effect delays between NA and SBP or HR were found. The inhibitory Emax models describing SBP and HR at the first dose were characterized by Emax values of 12% and 5%, much less than that estimated in the parallel analysis, and the corresponding changes in EC50 from baseline were 51 and 29 ng ml−1, respectively. Circadian variations in SBP, as well as decreased sensitivity for both SBP and HR, were also evident in these models. There were no significant correlations between any of the covariates and drug response.
Discussion
The cardiovascular effects of moxonidine in patients with NYHA II-III congestive heart failure were characterized by using population pharmacodynamic models. Two different modelling approaches were performed, in parallel, where the drug concentration is related to each measured pharmacodynamic endpoint, and sequentially, where the change in drug response (NA) is related to each of the observed effects (SBP and HR). In the former approach, all three effects were found to lag behind the plasma concentration-time profile. An effect compartment model with a first-order rate constant for the effect compartment was used to account for the effect delay [16]. The time-delays of NA, SBP, and HR were similar and were estimated to have half-lives of 40 min, 70 min, and 85 min, respectively. These values are estimated with low precision for both NA and SBP and with an interindividual variability of 160% and 140%, respectively. In contrast, the interindividual variability for HR was close to zero.
Different baseline models were considered during the model building process. For NA, the baseline increased linearly with time (2.3% per week) and was interpreted as disease progression. It appeared that this increase was less pronounced for the moxonidine-treated patients since it could be described in a manner that drug treatment delayed the disease progression (9.8 weeks). Blood pressure is known to show circadian variation. A cosine function was used, as this method needs fewer parameters to describe the time-variant changes in SBP in comparison with other methods. Data obtained during only a small portion of the day leads to a considerably less well characterized circadian profile than that based on 24 h measurements [25].
An Emax model was used to describe the relationship between moxonidine and NA, as a linear model was too restrictive and a sigmoidal Emax model yielded no further advantage. For most patients the doses given resulted in less than half-maximal effect (EC50). Estimation of Emax and EC50 in such circumstances results in high covariance of the estimates [26, 27]. Thus, a slope (i.e. Emax/EC50) was used to characterize the concentration-response relationship. The Emax model was related to the baseline proportionally in all three effect relationships. Thus, a patient with a higher baseline is expected to have a larger absolute drop in the effect. The average moxonidine concentration-effect relationship for SBP and HR had similar shapes of that for NA, but with an Emax half the size as that for NA. The model predicts that for most patients the drug effect is in the lower portion of the Emax curve, which means that a further increase in moxonidine dose may lead to a further increase in drug effect. For both SBP and HR, but not for NA, some patients exhibit EC50 values so low that they could be expected to experience effects close to the maximal effect. These patients are most likely those contributing to the information that the Emax model is superior to a linear model. However, for both NA and SBP there were patients with EC50 values so high that they would be expected not to experience any particular effect at the doses given. Caution must always be used in extrapolating model predictions to regions not covered by the data used to derive the model. The decrease in effect on SBP with time was pronounced, such that after 12 weeks drug treatment it was halved. This was also the case for HR with time, but the decrease in effect was even more pronounced. This decrease with time was modelled as a change in slope and thereby assumed a change in sensitivity (EC50) rather than maximal effect (Emax). No mechanistic conclusions should be drawn from this fact, as it was not possible to discriminate between these two possibilities.
The patients were examined on eight different occasions during a period of 12 weeks. Small changes in, for example, baseline values are to be expected over such a long study period. Thus, interoccasion variability was taken into account in all models, as ignoring it when it is present can lead to model misspecifications [19]. Low interoccasion variabilities were estimated for all baseline effects.
Usually, concentration-effect relationships are analysed in parallel for the different pharmacodynamic endpoints. However, there is often a possible correlation between effects, such that a patient responding with a large decrease/increase in response is also likely to exhibit a large decrease/increase in effect. A more physiological approach was performed by modelling the observed effects sequentially, where the changes in the NA concentrations from baseline with time were correlated with time-variant changes in SBP or HR. This model suggested that the rate-limiting step in sequence is between moxonidine concentration and NA. Significantly smaller Emax values were obtained for both SBP and HR and the interindividual variabilities were even larger for the Slopes than were estimated in the parallel analysis, possibly because in the parallel analysis some of the variability in sensitivity is partitioned into ke0 variability.
Modelling sequentially (PK/PD/PD) has advantages in that it is more mechanistic and described the data as well as the parallel model. Furthermore, the structure model is more rigid because fewer parameters are estimated (2 parameters less) in comparison with the PK/PD model. In addition, an estimate of the true intraindividual variability in a specific step in the sequence, in this case NA to SBP or HR, could be estimated. There is also a possibility that new covariate relationships for the NA to SBP or HR could be identified, which have been masked when the pharmacodynamic data is modelled in parallel. However, in this case none was found.
In conclusion, effects of moxonidine could be characterized by an effect-compartment model and an Emax model (NA, SBP, and HR). The interindividual variability was high and could not be explained by demographic factors. There was an increase with time in the NA levels in the placebo group, which was interpreted as disease progression. This increase was considerably less pronounced in the drug-treated group. Blood pressure displayed circardian variation in baseline. By modelling sequentially, abnormalities between drug response and effect could be discovered and this approach is more physiologic.
References
- 1.The Consensus trial study group. Effects of enalapril on mortality in severe congestive heart failure: Results of the Cooperative North Scandinavian Enalapril Survival Study (CONSENSUS) N Engl J Med. 1987;316:1429–1435. doi: 10.1056/NEJM198706043162301. [DOI] [PubMed] [Google Scholar]
- 2.The SOLVD investigators. Effect of enalapril on survival in patients with reduced left ventricular ejection fractions and congestive heart failure. N Engl J Med. 1991;325:293–302. doi: 10.1056/NEJM199108013250501. [DOI] [PubMed] [Google Scholar]
- 3.Cohn JN, Archibald DG, Ziesche S, et al. Effect of vasodilator therapy on mortality in chronic congestive heart failure. Results of a Veterans Administration Cooperative Study. N Engl J Med. 1986;314:1547–1552. doi: 10.1056/NEJM198606123142404. [DOI] [PubMed] [Google Scholar]
- 4.Cohn JN, Levine TB, Olivari MT, et al. Plasma norepinephrine as a guide to prognosis in patients with chronic congestive heart failure. N Engl J Med. 1984;311:819–823. doi: 10.1056/NEJM198409273111303. [DOI] [PubMed] [Google Scholar]
- 5.Levine TB, Francis GS, Goldsmith SR, Simon AB, Cohn JN. Activity of sympathetic nervous system and renin-angiotensin system assessed by plasma hormone levels and their relation to hemodynamic abnormalities in congestive heart failure. Am J Cardiol. 1982;49:1659–1666. doi: 10.1016/0002-9149(82)90243-0. [DOI] [PubMed] [Google Scholar]
- 6.Francis GS, Cohn JN, Johnson G, Rector TS, Goldman S, Simon A for the V-Heft VA Cooperative Studies Group. Plasma norepinephrine, plasmarenin-activity and congestive heart failure. Relation to survival and the effects of therapy in V-HeFT II. Circulation. 1993;87:VI–48. [PubMed] [Google Scholar]
- 7.Swedberg K, Eneroth P, Kjekshus J, Wilhelmsen L. Hormones regulating cardiovascular function in patients with severe congestive heart failure and their relation to mortality. Circulation. 1990;82:1730–1736. doi: 10.1161/01.cir.82.5.1730. [DOI] [PubMed] [Google Scholar]
- 8.Dickstein K, Manhenke C, Aarsland T, Kopp U, McNay J, Wiltse C. Acute hemodynamic and neurohormonal effects of moxonidine in congestive heart failure secondary to ischemic or idiopathic dilated cardiomyopathy. Am J Cardiol. 1999;83:1638–1644. doi: 10.1016/s0002-9149(99)00170-8. 10.1016/s0002-9149(99)00170-8. [DOI] [PubMed] [Google Scholar]
- 9.The Australia-New Zealand Heart Failure Research Collaborative Group. Effect of carvediol, a vasodilator-β-blocker, in patients with congestive heart failure due to ischemic heart disease. Circulation. 1995;92:212–218. [PubMed] [Google Scholar]
- 10.Packer M, Bristow MR, Cohn JN, et al. for the U.S. Carvediol Heart Failure Study Group. The effect of carvediol on morbidity and mortality in patients with chronic heart failure. N Engl J Med. 1996;334:1349–1355. doi: 10.1056/NEJM199605233342101. [DOI] [PubMed] [Google Scholar]
- 11.Pitt B, Zannad F, Remme WJ, et al. for the Randomized Aldactone Evaluation Study Investigators. The effect of spironolactone on morbidity and mortality in patients with severe heart failure. N Engl J Med. 1999;341:709–717. doi: 10.1056/NEJM199909023411001. [DOI] [PubMed] [Google Scholar]
- 12.Morris STW, Reid JL. Moxonidine: a review. J Human Hypertension. 1997;11:629–635. doi: 10.1038/sj.jhh.1000518. [DOI] [PubMed] [Google Scholar]
- 13.Elliott HL. Moxonidine. Pharmacology, clinical pharmacology and clinical profile. Blood Pressure. 1998;7:23–27. doi: 10.1080/080370598438447-1. [DOI] [PubMed] [Google Scholar]
- 14.Ernsberger P, Giuliano R, Willette RN, Reis DJ. Role of imidazole receptors in the vasodepressor response to clonidine analogs in the rostal ventrolateral medulla. J Pharmacol Exp Ther. 1990;253:408–418. [PubMed] [Google Scholar]
- 15.Karlsson MO, Jonsson EN, Wiltse CG, Wade JR. Assumption testing in population pharmacokinetic models: illustrated with an analysis of moxonidine data from congestive heart failure patients. J Pharmacokinet Biopharm. 1998;26:207–246. doi: 10.1023/a:1020561807903. [DOI] [PubMed] [Google Scholar]
- 16.Sheiner LB, Stanski DR, Vozeh S, Miller RD, Ham J. Simultaneous modeling of pharmacokinetics and pharmacodynamics: application to d-tubocurarine. Clin Pharmacol Ther. 1979;25:358–371. doi: 10.1002/cpt1979253358. [DOI] [PubMed] [Google Scholar]
- 17.Holford NHG, Sheiner LB. Understanding the dose-effect relationship: Clinical application of pharmacokinetic-pharmacodynamic models. Clin Pharmacokin. 1981;6:429–453. [Google Scholar]
- 18.Beal SL, Sheiner LB. Nonmem Users Guides. San Francisco: NONMEM. Project Group, University of California at San Francisco; 1992. [Google Scholar]
- 19.Karlsson MO, Sheiner LB. The importance of modelling interoccation variability in population pharmacokinetic analyses. J Pharmacokin Biopharm. 1993;21:735–750. doi: 10.1007/BF01113502. [DOI] [PubMed] [Google Scholar]
- 20.Jonsson EN, Karlsson MO. Xpose – an S-PLUS based population pharmacokinetic/pharmacodynamic model building aid for NONMEM. Comp Meth Prog Med. 1998;58:51–64. doi: 10.1016/s0169-2607(98)00067-4. [DOI] [PubMed] [Google Scholar]
- 21.Cockroft DW, Gault MH. Prediction of creatinine clearance from serum creatinine. Nephron. 1976;16:31–41. doi: 10.1159/000180580. [DOI] [PubMed] [Google Scholar]
- 22.Holford NHG, Peace KE. Results and validation of a population pharmacodynamic model for cognitive effects in Alzheimer patients treated with tacrine. Proc Natl Acad Sci. 1998;89:1471–1475. doi: 10.1073/pnas.89.23.11471. [DOI] [PMC free article] [PubMed] [Google Scholar]
- 23.Dayneka NL, Garg V, Jusko WJ. Comparison of four basic models of indirect pharmacodynamic responses. J Pharmacokin Biopharm. 1993;21:457–478. doi: 10.1007/BF01061691. [DOI] [PMC free article] [PubMed] [Google Scholar]
- 24.Mandema JW, Verotta D, Sheiner LB. Building population pharmacokinetic – pharmacodynamic models. I. Models for covariate effects. J Pharmacokinet Biopharm. 1992;20:511–528. doi: 10.1007/BF01061469. [DOI] [PubMed] [Google Scholar]
- 25.Hempel G, Karlsson MO, de Alwis DP, Toublanc N, Schaefer HG. Population PK/PD modelling of moxonidine 24h-ambulatory blood pressure measurements. Clin Pharmacol Ther. 1998;64:622–635. doi: 10.1016/S0009-9236(98)90053-4. [DOI] [PubMed] [Google Scholar]
- 26.Dutta S, Matsumoto Y, Ebling WF. Is it possible to estimate the parameters of the sigmoid Emax model with trucated data typical of clinical studies. J Pharm Sci. 1996;85:232–239. doi: 10.1021/js950067y. [DOI] [PubMed] [Google Scholar]
- 27.Schoemaker RC, Cohen AF. Estimating impossible curves using NONMEM. Br J Clin Pharmacol. 1996;42:283–290. doi: 10.1046/j.1365-2125.1996.04231.x. [DOI] [PMC free article] [PubMed] [Google Scholar]