

Abstract
Aims
It is not clear whether the analgesic effect following dihydrocodeine (DHC) administration is due to either DHC itself or its metabolite, dihydromorphine (DHM). We examined the relative contribution of DHC and DHM to analgesia following DHC administration in a group of healthy volunteers using a PK-PD link modelling approach.
Methods
A single oral dose of DHC (90 mg) was administered to 10 healthy volunteers in a randomised, double-blind, placebo-controlled study. A computerized cold pressor test (CPT) was used to measure analgesia. On each study day, the volunteers performed the CPT before study medication and at 1.25, 2.75, 4.25 and 5.75 h postdose. Blood samples were taken at 0.25 h (predose) and then at half hourly intervals for 5.75 h postdose. PK-PD link modelling was used to describe the relationships between DHC, DHM and analgesic effect.
Results
Mean pain AUCs following DHC administration were significantly different to those following placebo administration (P = 0.001). Mean pain AUC changes were 91 score. s−1 for DHC and −17 score. s−1 for placebo (95% CI = ± 36.5 for both treatments). The assumption of a simple linear relationship between DHC concentration and effect provided a significantly better fit than the model containing DHM as the active moiety (AIC = 4.431 vs 4.668, respectively). The more complex models did not improve the likelihood of model fits significantly.
Conclusions
The findings suggest that the analgesic effect following DHC ingestion is mainly attributed to the parent drug rather than its DHM metabolite. It can thus be inferred that polymorphic differences in DHC metabolism to DHM have little or no effect on the analgesic affect.
Keywords: analgesia, dihydrocodeine, dihydromorphine, pain, PK-PD modelling
Introduction
Dihydrocodeine (DHC) is frequently used as an antitussive and analgesic drug. It has been asserted that the analgesic activity of DHC, like codeine, is attributed to its dihydromorphine (DHM) metabolite. This assertion has been based on DHM having a binding affinity to µ receptors similar to that of morphine [1, 2] and possessing approximately 100 times the activity of DHC [3]. Less than 10% of DHC is metabolized by O-demethylation to DHM in man [3, 4]. The conversion of DHC to DHM is mediated by the cytochrome P450 CYP2D6 enzyme [3, 4]. The CYP2D6 enzyme activity is determined by genetic polymorphism, wherein approximately 5–10% of Caucasians and slightly more of Asians lack the functional activity of this enzyme [5]. It has therefore been suggested that the analgesic effects of DHC might be diminished in subjects phenotyped as CYP 2D6 poor metabolisers [3].
The pharmacokinetic (PK)–pharmacodynamic (PD) modelling method has been successfully used to relate pharmacological effect to plasma drug and/or metabolite concentrations after single dose administration of the parent drug [6–8].
In this study we examined the relationships between analgesic effect and plasma concentrations of DHC and DHM following DHC administration in a group of healthy volunteers, using conventional model-independent as well as PK-PD modelling methods.
Methods
Study design
Ten healthy nonsmoker volunteers (five females) aged 20–26 years gave their informed consent to take part in a double-blind, randomised, placebo-controlled crossover study which was approved by the Joint University/Regional Health Authority Ethics Committee. Subjects who had taken any drugs within 3 weeks prior to the study were excluded. Volunteers were asked to refrain from taking any caffeine containing foods or drinks and alcohol for 24 h prior to each study period. Each subject underwent a general medical examination, including haematology, serum biochemistry and full liver function tests, before the start of the study. On two separate occasions, following an overnight fast, each subject received a matching single oral dose of DHC tartrate (90 mg) and placebo. During each study day subjects received a light breakfast (two slices of toast, jam and orange juice) 2 h after drug administration and a standard lunch 2 h later. There was a minimum period of 7 days between the treatments.
Cold pressor test
Experimental details relating to the cold pressor test (CPT) have been described previously [9]. On each study day the CPT was carried out by subjects, in quiet surroundings, at 0.25 h predose, and at 1.25, 2.75, 4.25, 5.75 h postdose.
The maximum pain score achieved over the 2 min test period (equivalent to the highest pain intensity reached) was used as the main outcome measure to assess pain relief, as shown previously [10].
On both occasions, blood samples (10 ml) were collected via a cannula inserted into a suitable forearm vein at 0.25 h (predose) and then every 0.5 h for up to 5.75 h postdose.
Determination of DHC and DHM plasma concentrations
Plasma DHC and DHM concentrations were measured simultaneously by gas chromatography-tandem mass spectrometry [11]. Quality control samples of DHC (10.0, 200.0 and 1000 pmol ml−1) and DHM (0.1, 2.0 and 10.0 pmol ml−1) were routinely assayed with an intra-assay coefficient of variation less than 11% and an interassay coefficient of variation less than 12%.
Model-independent analysis
The maximum pain score was plotted against time at every CPT time point (0.25 h predose, 1.25, 2.75, 4.25 and 5.75 h postdose) for each treatment for every subject, and the area under the curve (AUC) for changes in maximum pain score from baseline (predose value) was calculated to represent the total change in pain perception for either treatment. A positive value was assigned to the AUC if pain perception decreased during the study period, and conversely a negative value indicated an increase in pain perception. The AUCs for the two treatments in all subjects were compared using a balanced two way analysis of variance (anova), with treatment and subject as factors. To compare DHC with placebo, the pain score AUCs for active drug were subtracted from the corresponding placebo pain AUC in the same subject. The resulting values were compared using paired t-tests.
The relationship between plasma concentrations of DHC and DHM and analgesia was examined using analysis of covariance (ancova), with subject as the factor and plasma concentration as the covariant.
PK-PD modelling analysis
Pharmacokinetic parameters of DHC and DHM were determined using simultaneous fits to concentration-time profiles of both the compounds by means of classical analysis (see Appendix). For the PD analysis, however, a population approach was applied due to the limited number of CPT assessments available for each subject. For both types of analyses the P-Pharm software package (Version 1.5, Innaphase, France) was used. The consistency of the results of classical fits were checked by re-fitting PK data with commonly used software package WinNonlin (Version 1.5, Scientific Consulting Inc, USA). The validity of all models were checked by inspection of residual distributions. The PK data for DHM were evaluated by employing equations which accounted for first-pass formation of the metabolite [12] (see Appendix).
Individual PK parameters obtained by the above fitting processes served as covariates for PD analysis (i.e. a two-stage link PK-PD model). The link between plasma drug concentration or concentration at a remote effect compartment and analgesic effect was determined by number of different models. These models included simple linear relationship between concentration and effect, Emax and sigmoidal Emax model, competitive, additive, synergistic and multi-ligand interactions between DHC and DHM (see Appendix). The PK-PD model assuming the effect compartment is shown schematically in Figure 1. The relative effectiveness of different PK-PD models in explaining analgesic effect, based on DHC alone, DHC plus DHM or DHM alone, was examined by Akaike Information Criteria (AIC) [13], as well as the F-test for significance of improvement in likelihood. The critical values for declaring significant improvement of likelihood were based on α= 0.05. Thus, for example, a reduction of 4.10, 3.25, 2.87, 2.64, 2.49 and 2.39 in —LL (– log likelihood) were required to accept significant improvements following addition of 1, 2, 3, 4, 5 and 6 model parameters to the 1 parameter model of linear effect, respectively.
Figure 1.

Schematic representation of PK-PD link modelling for DHC and DHM.
Results
The plasma concentration-time profiles for DHC and DHM and the placebo-corrected reductions in pain scores as an index of analgesic effect are shown in Figure 2a 2b, and 2c, respectively.
Figure 2.

Plasma concentration-time profiles for DHC (a), DHM (b) and placebo corrected reduction in pain score as an index of analgesic effect (c).
Model-independent analysis
Analysis of the pain AUCs showed a significant difference between the DHC and placebo treatments (P = 0.001, paired t-test). Mean AUC changes were 91 score. s−1 for DHC and −17 score. s−1 for placebo (95% CI = ± 36.5 for both treatments). Two way anova of maximum pain scores for DHC, with treatment and subject as factors, indicated that maximum pain relief occurred at 1.25 h post dose. The analgesic effect was significantly related to plasma concentrations of both DHC and DHM (P < 0.0001 for both treatments). One male subject appeared to be a poor metaboliser of DHC, with respect to the O-demethylation pathway (DHC/DHM ratio=343.7). However, analgesia produced by the drug in the subject was not significantly different compared with the rest of the group.
PK-PD modelling analysis
There was a wide interindividual variability in DHC/DHM plasma concentration ratio, but except for the first 2 h, the latter remained relatively constant throughout the course of the study in every subject (Figure 3). A classical one-compartment model with first-order absorption and elimination was found to best fit the plasma DHC concentrations. The PK values obtained by P-Pharm were similar to those calculated by WinNonlin (3, 5, 12 and 8% median differences for CL/F, V/F, ka and tlag, respectively). A typical example for the fitted plasma DHC and DHM concentrations are shown in Figure 4a and 4b, respectively. Pharmacokinetic parameters for DHC and DHM are shown in Table 1.
Figure 3.

DHC/DHM metabolic ratio vs time.
Figure 4.

Model fits for plasma DHC and DHM concentrations for a typical subject.
Table 1.
Median (upper and lower quartile) values of pharmacokinetic parameters for DHC and DHM
| CL/F (l h−1) | V/F (l) | ka (h−1) | tlag (h) | kel (h−1) | fm(DHM)systemic | fm(DHM)1st pass | k(DHM) | V(DHM) |
|---|---|---|---|---|---|---|---|---|
| 43 | 203 | 11 | 0.3 | 0.216 | 0.015 | 0.022 | 0.339 | 200 |
| (34–46) | (177–224) | (9–39) | (0.250–0.467) | (0.173–0.258) | (0.010–0.019) | (0.010–0.046) | (0.303–0.648) | Fixed |
A sensitivity analysis according to PK parameters of DHC and DHM indicated that DHC/DHM plasma concentration ratio compared with the initial value reached a plateau after 16 h (Figure 5); beyond this time point it was not possible to distinguish between analgesic effect of the compounds. However, there were sufficient differences in the plasma profiles of DHC and DHM between 0 and 10 h to enable the use of models evaluating the combined effects of DHC and DHM. Thus, we examined the models which assumed DHC or DHM as the only active substance producing analgesic effect, and combinations of DHC and DHM with additive, synergistic and antagonistic effects. Finally, we studied models that assumed different efficacy and potency for DHC and DHM (multiple ligand model). Models that assumed no effect compartment were all inferior (minimum AIC = 4.59) than their corresponding models which assumed effect compartment. Table 2 shows the summary results for fitting PD data with the latter models. Assuming a simple linear effect, the model containing DHC as the only active compound produced the most parsimonious fit (having the least AIC value) compared to other models. The results of the best population PD model (linear effect of DHC alone) and the Bayesian individual fits are shown in Figure 6. The slope of concentration-response curve according to the best fit was 0.063 (score. s−1. pmol ml−1) with a 62% (CV) interindividual variability. Inter-compartmental transfer associated with the effect compartment, ke0, was 3.3 (h−1) indicating only small delays in analgesic action (half-life of elimination from effect compartment=13 min). The interindividual variability on ke0 was only 14%. Concentration-effect curves arizing from this model are shown in Figure 7. These curves indicated up to seven fold interindividual variation in response to an identical concentration while interindividual variability in DHC concentration at any given time was less than two fold (Figure 2a).
Figure 5.

Estimated change in the ratio of DHC/DHM with time according to best model fit to pharmacokinetic data. (Reference point was the ratio of DHC/DHM at 0.25 h)
Table 2.
The results of pharmacodynamic model building and selection*
| Active moiety | Model | Number of model parameters | Model description | – LL** | AIC |
|---|---|---|---|---|---|
| DHM only | (1) | 2 | Linear effect (no intercept) | 171.508 | 4.388 |
| (2) | 3 | Linear effect (with intercept) | 171.255 | 4.431 | |
| (3) | 4 | Emax model | 169.996 | 4.400 | |
| DHC only | (4) | 2 | Linear effect (no intercept) | 182.728 | 4.668 |
| (5) | 3 | Linear effect (with intercept) | 174.485 | 4.512 | |
| (6) | 4 | Emax model | 175.149 | 4.529 | |
| DHC and DHM | (7) | 3 | Linear effect (no intercept) | 171.537 | 4.438 |
| (8) | 4 | General Emax model (no synergism or antagonism) | 171.419 | 4.485 | |
| (9) | 5 | General Emax model (with synergism or antagonism) | 171.850 | 4.546 | |
| (10) | 5 | Multiple ligand Emax model | 171.012 | 4.525 |
Lowest value for likelihood (indicating best fit) is shown in italics and the most parsimonious model (the best fit amongst nonstatistically different lowest-LL which has fewer number of model parameters) is shown in bold italics.
−LL = – log likelihood; Model 3 produced statistically significant better fit than all models except models 1, 2, 4 and 9. The differences between −LL of the latter four models and model 3 was not significant.
Figure 6.

Population model fit of analgesic effect vs time for DHC (bold line) and the predicted Bayesian fits for individual subjects (fine lines).
Figure 7.

Concentration-effect relationship for DHC at the effect site according to best pharmacodynamic model fit. (Different symbols indicate different individuals. Bold line represents population average and fine lines are Bayesian individual predictions).
Discussion
It has been suggested that analgesia caused by DHC is mainly due to its DHM metabolite, based on DHM having a high affinity for µ receptors [1, 2]. The greater binding affinity to µ receptor for DHM in comparison with DHC, is attributed to the free hydroxyl group at its C3 position of the phenolic ring [14]. The metabolism of DHC by O-demethylation to DHM is mediated by the cytochrome CYP2D6 enzyme which is polymorphic [3, 4], with wide variations within phenotypes [15]. It has therefore been proposed that DHC might be less effective in subjects who are CYP2D6 poor metabolisers [3].
To decipher the contribution of a drug or its metabolite(s) to the overall pharmacological effect in circumstances where the parent drug and its metabolite(s) are both active can be difficult. To tackle this, however, a number of experimental approaches have been developed. These include administration of the metabolite alone [16], inhibition of the metabolic pathway that is responsible for the formation of the metabolite [17, 18], or investigation of pharmacological effect in subpopulations who are polymorphic with respect to the biotransformation pathway that produces the active metabolite [19]. Alternatively, PK-PD modelling based on either inter or intraindividual differences in plasma concentration-time profiles between the parent drug and its metabolite, can be used without disruption of drug metabolism or the use of phenotypic groups. PK-PD modelling method has indeed been used previously to relate pharmacological activity to plasma drug/metabolite concentrations [6, 7].
In this study we examined whether the analgesic activity of DHC is related to plasma concentrations of either DHC, or its DHM metabolite following the administration of a single oral dose of DHC in healthy volunteers using conventional model-independent analysis as well as PK-PD modelling. First, we established that DHC produced significant analgesia compared to placebo, using a computerized CPT. The latter has previously been demonstrated to be a sensitive experimental model in measuring analgesia [9, 10, 20]. However, the analgesic effect could not be related to overall AUC of either DHC or DHM by conventional model-independent analysis. Consequently, we used PK-PD modelling approach to relate analgesic effect to plasma drug/metabolite concentrations. This was made possible mainly because of interindividual differences in DHC/DHM plasma concentration ratios as well as contribution by first-pass effect in producing varying DHC/DHM plasma concentration ratios over time. Although DHM or combination of DHM and DHC could also explain the analgesic effect, the data fittings in such models were inferior to those for the DHC one, as was confirmed by their respective AIC values and lack of significant improvement in –LL (– log likelihood). However, it is worth noting that the modelling data favours DHC to exert most effect mainly due to large differences in plasma concentrations between DHC and DHM. Thus, whilst DHC is purported to have a lower potency compared with DHM, it appears that the contribution of the parent drug to overall effect is higher than that of the metabolite, consequent to its greater plasma concentrations. Further in support of this, we found that the large interindividual variation (up to 20 fold) in DHM plasma concentrations was not related to the large interindividual variation (seven fold) in the analgesic effect following DHC administration.
The pharmacological effect of both DHC and DHM is determined by their ability to penetrate the blood–brain barrier, which in turn is dependent on their plasma protein binding and lipophilicity. However, there is no information available on the extent to which DHC and DHM bind to plasma proteins. Since only the plasma unbound fractions of DHC and DHM can penetrate the brain, any differences between DHC and DHM plasma protein binding can affect their relative in vivo potency. DHC is more lipophilic than DHM. It can therefore be expected that DHC/DHM concentration ratio in the brain, in the absence of any differences in plasma protein binding, is even greater than that found in plasma, thus further increasing the role of DHC on the overall analgesic effect. Population value for model parameter ke0, which was related to the rate of entry to effect compartment (see Appendix), appeared to be slightly greater (3.33 vs 2.98 h−1) for DHC but there was no statistical difference. Other minor metabolites of DHC and of DHM also possess analgesic activity. However, such metabolites are unlikely to make a significant contribution to the overall analgesic effect after DHC administration.
It is unlikely that tolerance develops within the first 6 h following a single oral dose of DHC in healthy volunteers. Moreover, with the development of tolerance it would be expected that a faster decay in analgesic effect relative to that in plasma drug concentrations is observed. Contrary to this we found that the changes in plasma drug concentrations were rapidly followed by the changes in analgesic effect (only a short delay as suggested by half-life for transfer constant; ke0 = 13 min).
Sensitivity analysis showed that the relative contribution of DHC and DHM to analgesic effect may have been more precisely determined if pain relief was measured with a greater frequency for the first 2 h following drug administration. However, this would be impractical, as it is expected that overexposure of volunteers to the CPT could reduce their accuracy of scoring pain and thus compromise the sensitivity of the test. One male subject appeared to be a poor metaboliser of DHC O-demethylation (DHC/DHM plasma concentration-time AUC ratio=343, compared to the average ratio of 55 for the remaining subjects). However, analgesia produced in this subject was not significantly different to the rest of the group. This further supports the findings of the PK-PD modelling that analgesic activity is mainly exerted by DHC.
Recently it has been suggested, based on measurement of evoked nociceptive activity in the rat thalamus, that analgesia produced by DHC administration is independent of its biotransformation to DHM [21]. A study in healthy volunteers showed that although quinidine-induced inhibition of CYP2D6 enzyme caused significant reduction in DHM metabolite production, it did not diminish analgesic effects of DHC [22]. These findings together with the results of our PK-PD modelling further reinforce the notion that DHC analgesic activity is not altered in polymorphic populations. Indeed, the preliminary findings of a more recent study has revealed that the analgesic activity of a single oral dose of DHC was not significantly different in healthy subjects genotyped as CYP2D6 poor metabolisers compared with those genotyped as CYP2D6 extensive metabolisers, although DHM and its glucuronide metabolites were undetectable in the plasma and urine of the poor metabolisers [23].
In conclusion, the results of the PK-PD modelling indicate that analgesic effect following DHC administration is mainly attributed to DHC itself, which is likely to be due to plasma DHC concentration being much greater than that of DHM rather than any differences in analgesic potency between the drug and its metabolite.
Appendix
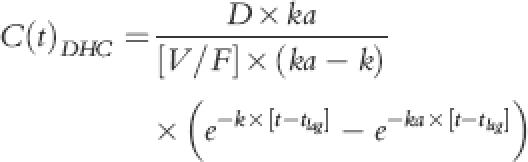
Equation 1 described plasma DHC concentrations beyond absorption lag time (tlag); plasma DHC concentrations before tlag was considered to be zero:
 |
(1) |
C(t)DHC, D, V/F, k and ka were plasma concentrations at time t, dose, oral volume of distribution, first order rate of elimination and first order rate of absorption for DHC, respectively. Elimination rate constant was determined as quotient of oral clearance (CL/F) and oral volume of distribution.
Equation 2 described plasma concentrations of DHM:
| (2) |
where C(t)DHM(1st pass) and C(t)DHM(systemic) showed the first-pass and systemic components of the plasma DHM concentrations. Each of these components were described by equations 3 and 4, respectively:
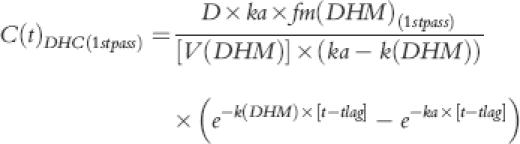 |
(3) |
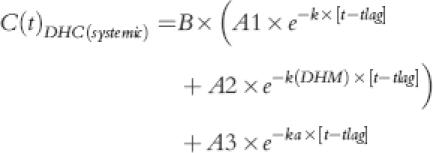 |
(4) |
where A1, A2, A3 and B were:
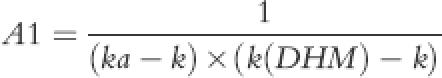 |
(5) |
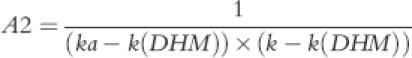 |
(6) |
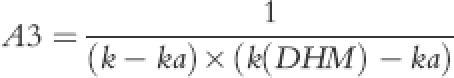 |
(7) |
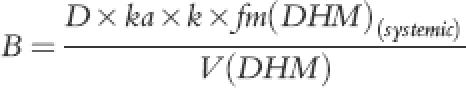 |
(8) |
The parameter k(DHM) described elimination rate constant of DHM while fm(DHM) was proportional conversion of DHC to DHM during first-pass or subsequent systemic metabolism. In the absence of iv data for DHM, the fraction of DHC that is converted to DHM is unknown. Thus, the volume of distribution of DHM [V(DHM)] and the fractional conversion of DHC to DHM [fm(DHM)] cannot be calculated. Therefore a fixed value of 200 l for V(DHM), a value close to DHC volume of distribution was chosen, which enabled us to obtain functional values for fm to describe DHM plasma concentration-time profile. Although these functional values had no physiological meaning, the ratio of fm(DHM) during first-pass and fm(DHM) of systemic circulation was a true reflection of proportional contribution of first-pass and systemic circulation of DHC in producing DHM. DHM elimination constant, k(DHM), was also of real physiological meaning that could determine plasma DHM half-life provided that DHM was not formation limited. An identifiability analysis of parent-metabolite relationship for ivabratine using the above model parameters has recently been reported by Evans et al. [24] the authors concluded that if the volume of distribution for metabolite was known a priori then all of the model parameters would be globally identifiable. Otherwise, the rate of drug conversion to metabolite via first pass and systemic metabolism could only be determined relative to each other [24].
The PD data were linked to PK by assuming an effect compartment with elimination rate constant ke0 and one of the following PD models:
where Ce(t) was the concentration of active moiety (DHC model 1and 2; DHM model 5 and 6) at the effect site and intercept could be fixed to 0 (models 1 and 5) or be calculated by iterations (models 2 and 6).
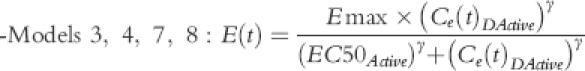 |
where Emax was maximum achievable pain score suppression and EC50 was the concentration of active moiety (DHC model 3 and 4; DHM model 7 and 8) that was associated with half Emax. Sigmoidicity constant, γ, could be fixed at 1 (models 3 and 7) or be calculated by iterations (models 4 and 8).
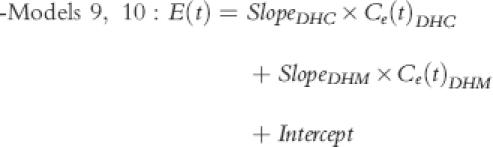 |
These were similar to models 1, 2 and 5, 6 but they assumed DHC and DHM both to be active. Intercept could be fixed AT 0 (model 9) or be calculated as part of modelling (model 10). Since ‘Slope’ values could be negative, any competitive interaction could be assessed in this model.
-Model 11–15:
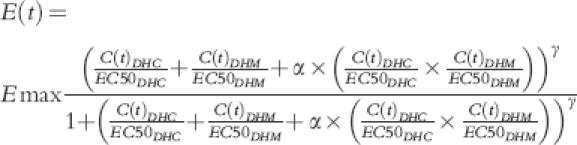 |
This general model for nonadditivity assumed an interaction term α. If α= 0 then an additive effect could be considered (with the assumption of EC50 being the same for DHC and DHM). However, negative values of α indicated antagonism and positive values showed synergism. The value of α could be fixed at 0 (models 11 and 12) or be calculated as part of the model (models 13 and 14). Similarly sigmoidicity function, γ, could be fixed at 1 (models 11 and 13) or be calculated during modelling (models 12 and 14)
-Models 15 and 16:
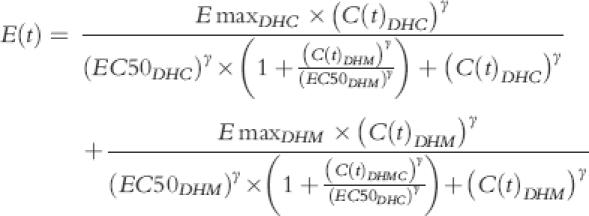 |
These models assumed that DHC and DHM are two ligands acting at the same cite of action, but with different efficacy. Sigmoidicity function, γ, could be fixed at 1 (model 15) or be calculated as part of modelling (model 16).
References
- 1.Creese I, Synder SH. Receptor binding and pharmacological activity of opiates in the guinea-pig intestine. J Pharmacol Exp Ther. 1975;194:205–219. [PubMed] [Google Scholar]
- 2.Kirkwood LC, Venning MG, Nation RL. Comparative activity of dihydrocodeine and its metabolites in the electrically stimulated guinea-pig ileum. Pharm Sci. 1995;1:573–575. [Google Scholar]
- 3.Fromm MF, Hofmann U, Greise EU, Mikus G. Dihydrocodeine. A new opioid substrate for the polymorphic CYP2D6 in humans. Clin Pharmacol Ther. 1995;58:374–382. doi: 10.1016/0009-9236(95)90049-7. [DOI] [PubMed] [Google Scholar]
- 4.Kirkwood LC, Nation RL, Somoyi AA. Characterization of the human cytochrome P450 enzymes involved in the metabolism of dihydrocodeine. Br J Clin Pharmacol. 1997;44:549–555. doi: 10.1046/j.1365-2125.1997.t01-1-00626.x. [DOI] [PMC free article] [PubMed] [Google Scholar]
- 5.Eichelbaum M, Gross AS. The genetic polymorphism of debrisoquine/sparteine metabolism: clinical aspects. Pharmac Ther. 1990;46:377–394. doi: 10.1016/0163-7258(90)90025-w. [DOI] [PubMed] [Google Scholar]
- 6.Duffull SB, Aarons L. Development of a sequential linked pharmacokinetic and pharmadynamic simulation model for ivabradine in healthy volunteers. Eur J Pharm Sci. 2000;10:275–284. doi: 10.1016/s0928-0987(00)00085-3. [DOI] [PubMed] [Google Scholar]
- 7.Tuk B, Van Oostenbruggen MF, Herben VMM, Mandema JW, Danhof M. Characterisation of the pharmacodynamic interaction between parent drug and active metabolite in vivo: midazolam and α-OH-midazoalm. J Pharmacol Exp Ther. 1999;289:1076–1074. [PubMed] [Google Scholar]
- 8.Sindrup SH, Madsen C, Brsen K, Jensen TS. The effect of tramadol in painful polyneuropathy in relation to serum drug and metabolite levels. Clin Pharmacol Ther. 2000;66:636–641. doi: 10.1053/cp.1999.v66.103171001. [DOI] [PubMed] [Google Scholar]
- 9.Webb J, Kamali F. Analgesic effects of lamotrigine and phenytoin on cold-induced pain: a crossover placebo-controlled study in healthy volunteers. Pain. 1998;76:357–633. doi: 10.1016/S0304-3959(98)00068-2. [DOI] [PubMed] [Google Scholar]
- 10.Wotherspoon HA, Kenny GNC, McArdle CS. Analgesic efficacy of controlled release dihydrocodeine. Anaesthesia. 1991;46:915–917. doi: 10.1111/j.1365-2044.1991.tb09845.x. [DOI] [PubMed] [Google Scholar]
- 11.Hofmann U, Fromm MF, Johnson S, Mikus G. Simultaneous determination of dihydrocodeine and dihydromorphine in serum by gas chromatography-tandem mass spectrometry. J Chromatogr. 1995;663:59–65. doi: 10.1016/0378-4347(94)00423-3. [DOI] [PubMed] [Google Scholar]
- 12.Rostami-Hodjegan A, Nurminen S, Jackson PR, Tucker GT. Caffeine urinary metabolic ratios as markers of enzyme activity: a theoretical assessment. Pharmacogenetics. 1996;6:121–149. doi: 10.1097/00008571-199604000-00001. [DOI] [PubMed] [Google Scholar]
- 13.Yamaoka K, Nakagawa T, Uno T. Application of Akaike's information criteria (AIC) in the evaluation of linear pharmacokinetic equations. J Pharmacokin Biopharm. 1976;6:165–175. doi: 10.1007/BF01117450. [DOI] [PubMed] [Google Scholar]
- 14.Pert CB, Synder SH. Opiate receptor binding of agonists and antagonists affected differentially by sodium. Mol Pharmacol. 1974;10:868–878. [Google Scholar]
- 15.Sachse C, Brockmöller J, Bauer S, Roots I. Cytochrome P450 2D6 variants in Caucasian population: allele frequencies and phenotypic consequences. Am J Hum Genet. 1997;60:284–295. [PMC free article] [PubMed] [Google Scholar]
- 16.Nordin C, Bertilsson L, Dahl ML, Resul B, Toresson G, Sjoqvist F. Treatment of depression with E-10-hydoxynortriptyline: a pilot study on biochemical effects and pharmacokinetics. Pscychopharmacology. 1991;103:287–290. doi: 10.1007/BF02244280. [DOI] [PubMed] [Google Scholar]
- 17.Heiskanen T, Olkkola KT, Kalso E. Effects of blocking CYP2D6 on the pharmacokinetics and pharmacodynamics of oxycodone. Clin Pharmacol Ther. 1998;64:603–611. doi: 10.1016/S0009-9236(98)90051-0. [DOI] [PubMed] [Google Scholar]
- 18.Abul-Manap A, Wright CE, Gregory A, et al. The antitussive effect of dextromethorphan in relation to CYP2D6 activity. Br J Clin Pharmacol. 1999;48:382–387. doi: 10.1046/j.1365-2125.1999.00029.x. [DOI] [PMC free article] [PubMed] [Google Scholar]
- 19.Eckhardt K, Li S, Ammon S, Schänzle G, Mikus G, Eichelbaum M. Same incidence of adverse drug events after codeine administration irrespective of the genetically determined differences in morphine formation. Pain. 1998;76:27–33. doi: 10.1016/s0304-3959(98)00021-9. [DOI] [PubMed] [Google Scholar]
- 20.Posner J, Telekes A, Crowley D, Phillipson R, Peck AW. Effects of an opiate on cold induced pain and the CNS in healthy volunteers. Pain. 1985;23:73–82. doi: 10.1016/0304-3959(85)90232-5. [DOI] [PubMed] [Google Scholar]
- 21.Jurna I, Komen W, Baldauf J, Fleischer W. Analgesia by dihydrocodeine is not due to formation of dihydromorphine: Evidence from nociceptive activity in rat thalamus. J Pharmacol Exp Ther. 1997;281:1164. [PubMed] [Google Scholar]
- 22.Wilder-Smith CH, Hufschmid E, Thormann W. The visceral and somatic antinociceptive effects of dihydrocodeine and its metabolite, dihydromorphine. A crossover study with extensive and quinidine-induced poor metabolizers. Br J Clin Pharmacol. 1998;45:575–581. doi: 10.1046/j.1365-2125.1998.00727.x. [DOI] [PMC free article] [PubMed] [Google Scholar]
- 23.Schmidt WH, Vormfelde SV, Klinder K, et al. Pharmacokinetics and pharmacodynamics of dihydrocodeine in healthy volunteers depending on DYP2D6 genotype. Eur J Clin Pharmacol. 1999;55:A21. [Google Scholar]
- 24.Evans ND, Godfrey Kr, Chapman MJ, Chappell MJ, Aarons L, Duffull SB. An indentifiability analysis of a parent–metabolite pharmacokinetic model for ivabradine. J Pharmacokin Biopharm. 2001;28:93–105. doi: 10.1023/a:1011521819898. [DOI] [PubMed] [Google Scholar]