Abstract
Acoustic stimulation vibrates the cochlear basilar membrane, initiating a wave of displacement that travels toward the apex and reaches a peak over a restricted region according to the stimulus frequency. In this characteristic frequency region, a tone at the characteristic frequency maximally excites the sensory hair cells of the organ of Corti, which transduce it into electrical signals to produce maximum activity in the auditory nerve. Saturating, nonlinear, feedback from the motile outer hair cells is thought to provide electromechanical amplification of the travelling wave. However, neither the location nor the extent of the source of amplification, in relation to the characteristic frequency, are known. We have used a laser–diode interferometer to measure in vivo the distribution along the basilar membrane of nonlinear, saturating vibrations to 15 kHz tones. We estimate that the site of amplification for the 15 kHz region is restricted to a 1.25 mm length of basilar membrane centered on the 15 kHz place.
Keywords: outer hair cell, frequency selectivity, Deiters cells, laser diode interferometry
Sound impinging on the ear drum causes the basilar membrane (BM) of the cochlea to vibrate, thereby initiating a wave of displacement (the von Bekèsy travelling wave), which travels toward the apex and reaches a peak over a restricted region of the BM according to the stimulus frequency (1). In this characteristic frequency (CF) region, a tone at the CF maximally excites the sensory hair cells of the organ of Corti, which transduce it into electrical signals to produce maximum activity in the auditory nerve. Saturating, nonlinear, feedback from the motile outer hair cells (OHCs) (1–4) is thought to provide electromechanical amplification of the travelling wave (5, 6). Neither the location nor the extent of the source of amplification, in relation to the CF, are known. However, a number of modelling studies have suggested that energy is introduced at a point in the travelling wave basal to the CF position and that the active element extends over several millimeters (7–9). This proposal is attractive because the travelling wave must pass through the active region before reaching the CF, thereby directly stimulating the OHCs, which, in turn, feed back energy to boost the displacement of the adjacent CF region to overcome the viscous damping, which otherwise would dissipate the travelling wave.
To investigate the location and extent of the BM region responsible for amplifying the travelling wave, it is necessary to measure the spatial representation of a pure tone along the BM. Spatial displays of the representation of pure tones on the BM have been constructed from the responses of auditory afferent nerve fibers, but these indirect measurements of excitation patterns were confined to low frequencies (10–12). The pioneering, direct measurements by von Bekèsy (1), which established the travelling wave properties of cochlear vibrations, were obtained from dead cochleae and used intense tones, two conditions that compromise the remarkable frequency tuning of the cochlea. In the experiments reported here, we have measured in vivo the distribution along the BM of nonlinear, saturating vibrations to 15 kHz tones in the 12.5–27 kHz region of the guinea pig cochlea.
MATERIALS AND METHODS
A detailed description of the methods of preparation, experimental techniques, and stimulus presentation has been published (13). Recordings were made from pigmented guinea pigs (230–320 g) anesthetized with the neurolept anesthetic technique (0.06 mg atropine sulfate s.c., 30 mg/kg pentobarbitone i.p., 4 mg/kg droperidol i.m./1 mg/kg phenoperidine i.m.). The animals were tracheotomized, artificially respired, and core temperatures were maintained at 37°C. The compound action potential (CAP) was recorded through an Ag/AgCl electrode placed on the round window. A CAP audiogram was obtained over the range 1–30 kHz before and after each major surgical procedure and after each series of BM displacement measurements made at a single location on the BM.
BM displacements were measured using the self-mixing effect of a laser diode. This technique is sensitive enough to measure light directly reflected from the BM. Speed of measurement was a crucial consideration in these experiments so most data were obtained without averaging. The interferometer formed a spot on the BM 10 μm in diameter with a <5 μm depth of focus at a distance of 5 cm from the front surface of the focusing lens. Self-mixing in a laser diode involves coupling back a small part of the laser light into the laser cavity. Mixing of this light with the light produced in the cavity is obtained when the target is displaced along the beam axis. The intensity of the laser varies sinusoidally with a period corresponding to a displacement of λ/2, where λ is the wavelength of the laser light (670 nm). Providing the interferometer is operating about a resting position from the target that is an integer function of λ/2, the method underestimates the displacement by <3% for changes in displacement of < ±45 nm about the resting position. The displacement-dependent effect was measured in the signal of the photodiode, which is located behind the laser crystal in the diode laser housing. The bandwidth of the displacement-dependent signal was 200 kHz and the equivalent noise floor is <10 pm. Calibration of the signal was achieved in situ, and with respect to the measurement point on the BM, by displacing the interferometer a known amount by a piezo electric driver. Voltage responses from the interferometer proportional to BM displacement were analyzed with a two-channel lock-in amplifier (EG & G, Princeton, NJ; Model 510) set in quadrature. The in-phase and quadrature outputs were digitized and the phase and the magnitude were computed.
Sound was delivered to the tympanic membrane by a closed acoustic system comprising a Bruel and Kjaer 4133 1/2 inch microphone with a 1/4 inch coupler for delivering tones and a Bruel and Kjaer 3134 1/2 inch microphone with a 1/4 inch coupler for monitoring the sound pressure at the tympanum. Pure tone stimuli, 40 ms duration with 2 ms cosine-shaped, rise and fall times, delivered every 200 ms, were generated by a Hewlett–Packard 325 synthesizer coupled to a computer-controlled gate and an attenuater. The sound system was calibrated in situ for frequencies between 1 and 30 kHz, such that known sound pressure levels (SPL) expressed in decibels (dB SPL) (dB relative to 2 × 10⁻⁵ Pa) were used in the experiments.
RESULTS
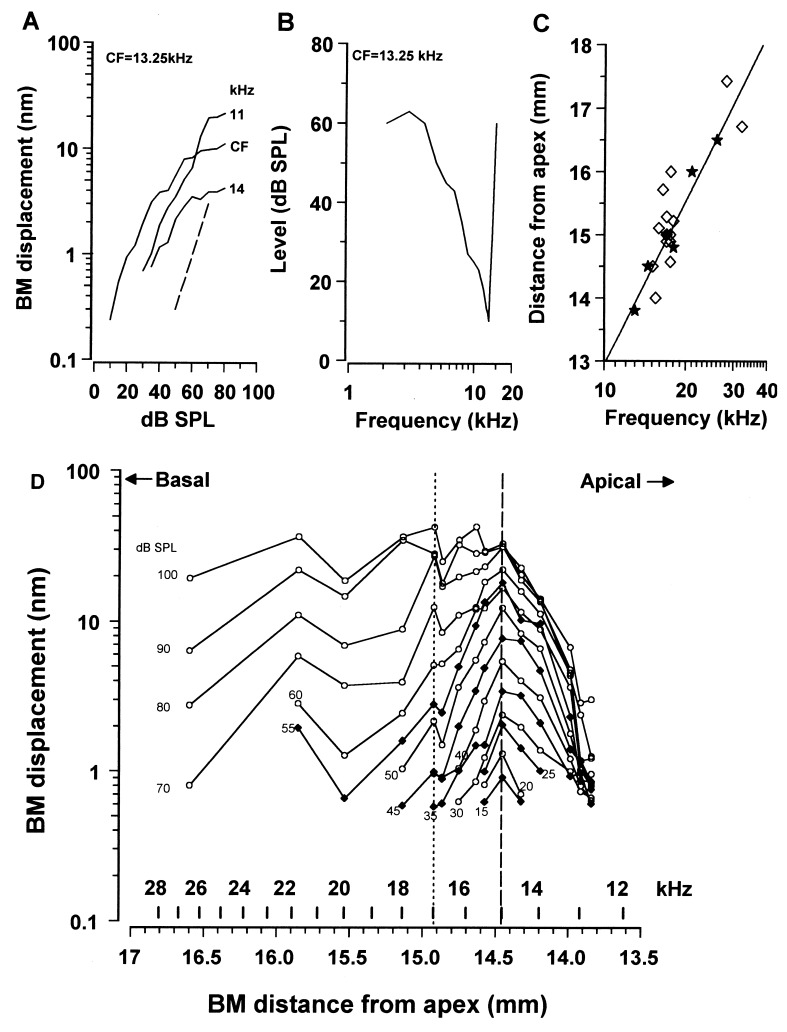
The exact location of each measurement point with respect to the apex of the cochlea was determined from a function, relating the CF of a point along the BM to its distance from the apex (14). Isoresponse frequency tuning curves were derived from the curves describing the BM displacement as a function of stimulus level (Fig. 1A). We then established a relationship between the CF of the tuning curve and the location of the measuring point along the BM (Fig. 1B). The location was determined by lesioning the BM at the point of measurement and then measuring the distance between the lesion and the apical-most extent of the BM. This distance showed a close correspondence with that predicted from the frequency-distance function (14) for the BM (Fig. 1C) and also with the tonotopic distributions of inner hair cell (IHC) receptor potential CFs (15).
Figure 1.
(A) BM displacement as a function of intensity at the 13.25 kHz CF position at 3 frequencies around the CF; broken line, slope of 1. (B) Isoresponse frequency tuning curve at the 13.25 kHz position showing the intensity required to cause a 0.5 nm BM displacement [CF/bandwidth 10 dB from tip (Q10dB) = 7.2]. (C) Locations of CF as a function of distance from the apex. ★, BM measurements; ⋄, IHC receptor potentials (15). Line represents the cochlear frequency-position function (14) (F = 0.35(100.1135d − 0.85). (D) BM displacement response to a 15 kHz tone measured at 15 positions along the BM from 12.5–27 kHz, over a range of intensities from 15–60 dB SPL in 5 dB SPL steps and from 60–100 dB SPL in 10 dB SPL steps. Functions at 5 dB SPL intervals have solid symbols. Broken line indicates the 15 kHz location. Frequency positions to the right of the dotted line (12.5–17 kHz) are from one preparation and those on the left (17–27 kHz) are each from separate preparations.
The spatial distribution of the displacement to a 15 kHz tone along the BM was obtained for levels between 15–100 dB SPL for six preparations. In 5 preparations it was possible to make measurements from at least 5 positions along the BM, whereas in 1 preparation measurements were made from 11 positions along the BM without an apparent change in the sensitivity of the cochlea. At each measuring point, the CF of the location was determined and the distance of the point from the apex was estimated from the frequency position function. The magnitude and phase of the BM response to the 15 kHz tone was then measured as a function of level. The data shown to the right of the dotted vertical line in Fig. 1D is from the single preparation where it was possible to make measurements from 11 different positions along the BM over the CF range 12.5–17 kHz without a perceptible change in the audiogram between the measurements. Measurements from the four frequency positions with CFs above 17 kHz (those to the left of the dotted line) were each made from different preparations. It was considered that the inclusion of data from the four additional preparations was justified because (i) The CAP audiograms of these preparations were within 5 dB SPL of that of the preparation whose data are represented to the right of the dotted line; (ii) BM displacements in the tail of the tuning curve (where measurements were made in these preparations) are relatively insensitive to changes in the tip of the tuning curve (15, 16); (iii) The noise floor for each of these measurements remained within 0.1 nm of 0.5 nm rms, and all measurements were normalized to this. For low levels of the 15 kHz tone, the spread of excitation along the BM is centered around the 15 kHz point (broken line). There is a sharp cut-off in the apical extent of the 15 kHz response near 12.5 kHz when, presumably, the motion of the BM becomes mass limited (1). For levels between 40 and 100 dB SPL, the amplitude of BM displacement tends toward a minimum near the 16.5 kHz point and then grows again at the 17 kHz point. For tone levels of 60 dB and above, the 15 kHz response extends basally and beyond the 27 kHz point, which was the basal-most measuring point in these experiments.
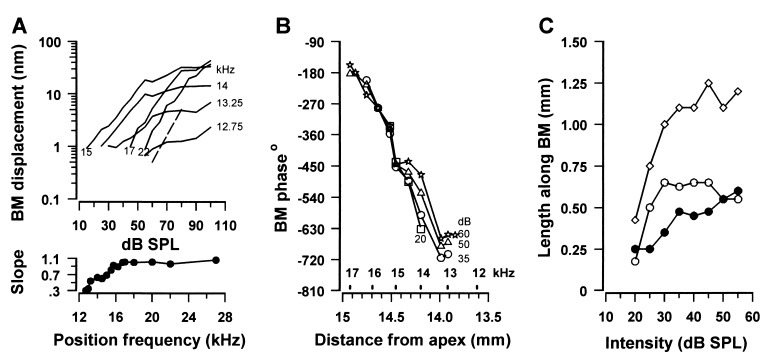
The 15 kHz displacement-level functions (Fig. 2A), measured within the length of the BM between the 12.5 kHz and 16.5 kHz places, were saturating and nonlinear with slopes of less than 1 (measured from the 0.5 nm noise floor to 30 dB above this). This nonlinearity is an indication that, in this region of the BM, the responses are boosted by feedback. Furthermore, the slopes, and the magnitude at which the displacement saturated, decreased as the measuring point was moved apically and toward lower frequencies, possibly because feedback becomes less effective in this direction. This observation was repeated in all six preparations that formed the basis of this investigation and is apparent in measurements of BM vibration obtained at similar SPLs from fixed positions in the basal turns of the guinea pig (17) and chinchilla cochleae (18, 19). Amplification appears to have little or no part to play in the 15 kHz responses measured from frequency positions at 17 kHz and above because the slopes of the displacement-level functions are unity.
Figure 2.
(A) BM displacement response as a function of intensity to a 15 kHz tone measured over a range of frequency positions about the 15 kHz point; broken line, slope of 1. (Lower) Slope of the initial region of the level function as a function of frequency position. (B) Phase as a function of position along the BM measured at several intensities (20–60 dB SPL). (C) Length along BM of the 15 kHz displacement envelope above the noise floor (0.5 nm) as a function of level. ⋄, total peak width; ○, length from the center of the peak to the apical end; •, length from the center to the basal end.
The phase of displacement evoked by the 15 kHz tones, relative to that of the driving voltage, was studied in detail in one preparation (Fig. 2B) and with coarser resolution, but with similar results in two other preparations. The phase was relatively independent of the level for measuring points at the 15 kHz point and basal to it. For measuring points at frequencies within the 15–12.5 kHz region the changes in phase, as functions of frequency, were level dependent. Significantly, the phase of the BM response at measuring points just apical to the 15 kHz point approached that at the 15 kHz point with increasing SPLs. This indicates that, with increasing SPL, the 15 kHz point and regions of the BM just apical to it vibrate in unison to the 15 kHz tone.
The length of the BM responding to the 15 kHz tone (Fig. 2C, ⋄) grows steeply for levels up to 30 dB SPL and then grows more slowly, asymptoting at around 1.25 mm for levels between 35 and 55 dB SPL. From the regression of the lowest three points in Fig. 2C it can be estimated that 0.15 mm of the BM or 14 IHCs and 53 OHCs (20) respond to a 15 kHz tone at CAP threshold (15 dB SPL in this preparation). The spread of excitation with tone levels below 30 dB SPL extended initially in the apical direction (○) for a distance of 0.6 mm along the BM from the 15 kHz point, whereas in the basal direction (•), the spread of excitation was a more gradual and linear function of level, at least to 55 dB SPL. Above 30 dB SPL, the recruitment of BM with level is confined to the basal direction and is more gradual, so that between 35 and 55 dB SPL no more than 1.25 mm of BM, or 440 OHCs and 100 IHCs, contribute to the peak of the BM response.
DISCUSSION
The nonlinear, compressive, level-dependent behavior of tone-evoked BM displacements measured within the 12.5–16.5 kHz region leads us to suggest that this 1.25 mm long section of the BM is the source of mechanically active elements contributing to the amplification of the 15 kHz place. The extent and location of the nonlinear region of BM displacement reported here is in agreement with estimates of the distribution of the cochlear amplifier based on noise-induced lesions of the BM (21).
It might be expected that the combination of decreased stiffness and increase in the effective mass of the BM from the CF region toward the apex of the cochlea will disperse the travelling wave and, hence, reduce both the excitation of the OHCs and the effects on the BM of any forces they may generate. However, the observed apical spread of excitation along the BM from the 15 kHz place with increasing tone levels would be facilitated if the region just apical to the CF became momentarily stiffer during presentation of the 15 kHz tone, thereby countering the mass limitation of this region. Indeed, the finding that with increasing level the phase of BM vibrations to the 15 kHz tone recorded from the 14.5 kHz and 14 kHz points approaches that at the 15 kHz point (Fig. 2B) may be an indication that the BM becomes stiffer with level. Thus, with increasing levels of stimulation, greater lengths of the BM resonate in synchrony and, presumably, a larger number of OHCs cooperate in unison to feedback energy at 15 kHz. The acoustic foveae of constant-frequency bats (22), and the consequent sharply tuned cochlear responses (23), may be due to an extreme specialization of this process.
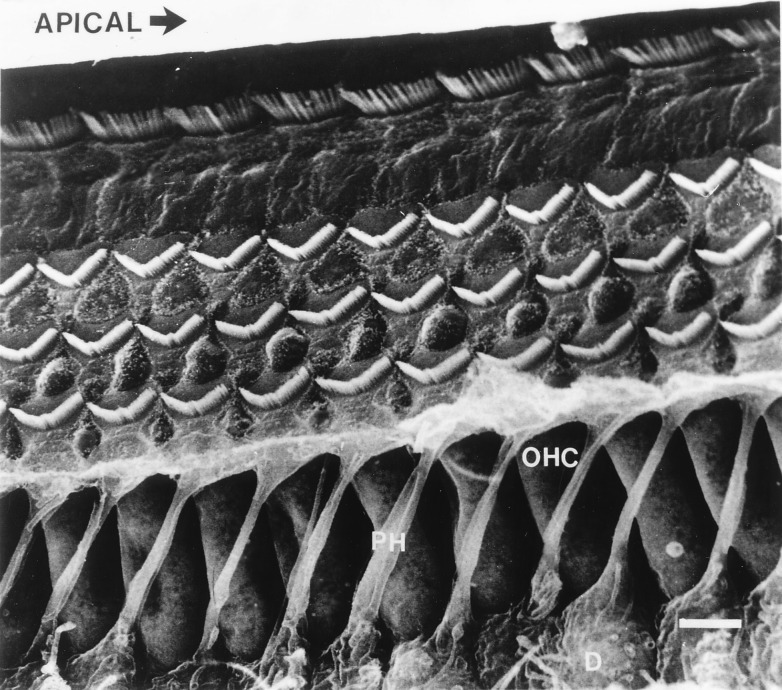
The apical spread of excitation along the BM could be conducted by the geometrical arrangement of basally slanting OHCs and apically sloping phalangeal processes of the Deiters cells, which mechanically couple the base of an OHC with the neck region of the next-but-one OHC apical to it (Fig. 3) (24, 25). In this arrangement, forces exerted by the OHCs at the 15 kHz point are transmitted, via the strut-like phalangeal processes, to apically located OHCs. In turn, the more apical OHCs detect and respond to these forces, by causing a transient stiffening of the cochlear partition. These forces are then fed back, through the phalangeal processes, to the 15 kHz point and fed forwards to adjacent, apically located OHCs.
Figure 3.
Each cylindrical OHC is supported at its base by a cup-like depression in a Deiters cell (D). Each Deiters cell extends a phalangeal process (PH), which extends at an angle and inserts into the reticular lamina one or two OHCs away toward the apex of the cochlea (indicated by arrow). (Scale bar = 10 μm.) (Scanning electron micrograph of the gerbil cochlea provided by A. Forge, Institute of Laryngology and Otology, University College of London)
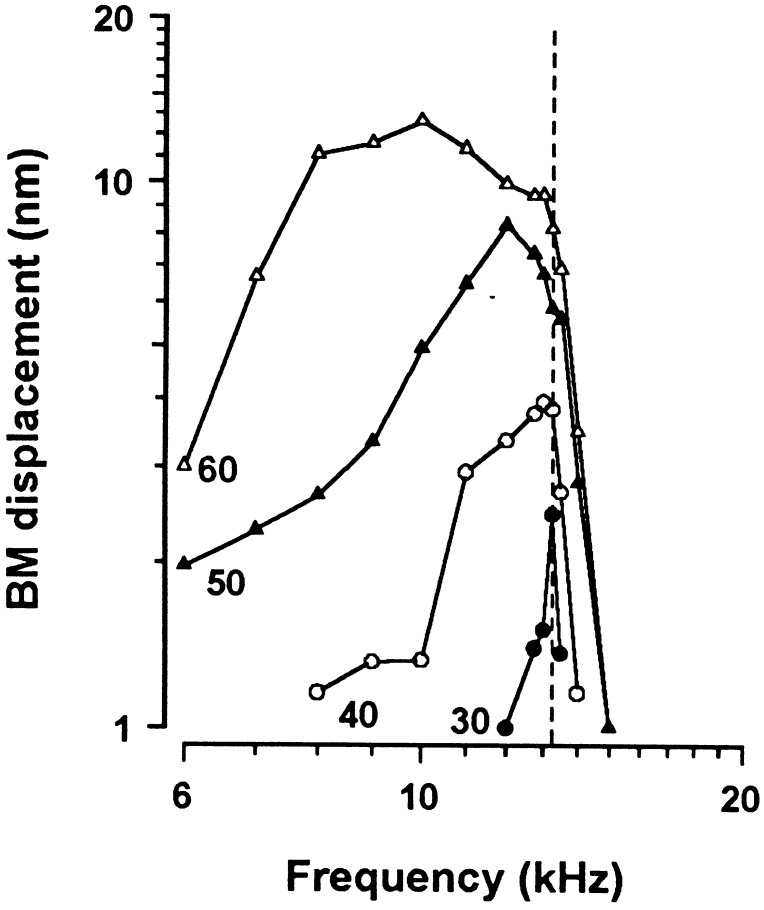
According to the measurements presented in Fig. 1D of BM displacement to a single 15 kHz tone made at different points along the BM, the peak response to the 15 kHz tone remains almost stationary in its location on the BM over an 85 dB SPL range. This finding contrasts with measurements of BM vibration made at a single location to tones of different frequencies (Fig. 4), where with increasing level the peak response shifts to lower frequencies. Vibration reaches a maximum for intense tones at frequencies approximately one-half octave below the CF (19, 26). The reason for the apparent lack of downward shift in the spatial distribution of the response to the 15 kHz tone on the BM may be a function of the gradient of increased stiffness of the BM with distance from the apex of the cochlea (1), and the possibility that OHCs may contribute to the stiffness of the BM for frequencies around the CF. The BM will be displaced less for a given pressure difference across the cochlear partition with increasing distance from the apex, i.e., the 20 kHz region will move less for an intense tone one-half octave lower in frequency (15 kHz) than will the 15 kHz region for a 11.25 kHz tone of the same intensity. Thus, over most of the dynamic range of BM vibration, the peak response to a 15 kHz tone is at the 15 kHz position, although the frequency to which the 15 kHz position vibrates maximally is one-half octave below this.
Figure 4.
BM displacement as a function of frequency recorded at four different levels from the 13.25 kHz point. The vertical dotted line indicates the CF (13.25 kHz).
In conclusion, we find that the BM and IHC frequency-place maps are very similar, which indicates that the tip of IHC-tuning curves, and hence neural-tuning curves, are a direct consequence of the mechanical tuning of the BM. We find also that saturating, nonlinear displacements of the BM to 15 kHz tones are restricted to a 1.25 mm region extending both apical and basal to the 15 kHz point. If this nonlinearity reflects OHC-mediated feedback to the cochlear partition, then fewer than 440 OHCs contribute to the displacement of the 15 kHz frequency point on the BM. This finding contrasts with current models, which locate the source of amplification over an extended region basal to the CF. For levels below about 30 dB SPL, OHCs located apical to the 15 kHz point are recruited with increasing level to amplify BM displacement to 15 kHz tones, possibly as a consequence of a transient increase in the stiffness of the cochlear partition immediately apical to the 15 kHz point.
Acknowledgments
We thank James Hartley for designing and constructing the electronic apparatus, Andrew Forge for providing the micrograph shown in Fig. 3, and Manfred Kössl for providing us with software. We are indebted to Ann Brown, Manfred Kössl, Andrei Lukashkin, and Guy Richardson for stimulating discussion and comments on the manuscript. This work was supported by grants from the Medical Research Council.
ABBREVIATIONS
- BM
basilar membrane
- CF
characteristic frequency
- OHCs
outer hair cells
- IHCs
inner hair cells
- SPL
sound pressure level
- CAP
compound action potential
References
- 1.von Bekèsy G. Experiments in Hearing. New York: McGraw–Hill; 1960. [Google Scholar]
- 2.Dallos P. J Neurosci. 1992;12:4575–4585. doi: 10.1523/JNEUROSCI.12-12-04575.1992. [DOI] [PMC free article] [PubMed] [Google Scholar]
- 3.Brownell W E, Bader C R, Bertrand D, Ribaupirre Y. Science. 1985;227:194–196. doi: 10.1126/science.3966153. [DOI] [PubMed] [Google Scholar]
- 4.Ashmore J F. J Physiol (London) 1987;388:323–347. doi: 10.1113/jphysiol.1987.sp016617. [DOI] [PMC free article] [PubMed] [Google Scholar]
- 5.Santos-Sacchi J, Dilger J P. Tissue Cell Res. 1988;229:467–481. [Google Scholar]
- 6.Patuzzi R B, Yates G K, Johnstone B M. Hear Res. 1989;42:47–72. doi: 10.1016/0378-5955(89)90117-2. [DOI] [PubMed] [Google Scholar]
- 7.de Boer E. J Acoust Soc Am. 1983;73:567–573. doi: 10.1121/1.389002. [DOI] [PubMed] [Google Scholar]
- 8.Neely S T, Kim D O. J Acoust Soc Am. 1986;79:1472–1480. doi: 10.1121/1.393674. [DOI] [PubMed] [Google Scholar]
- 9.Diependaal R J, de Boer E, Viergever M A. J Acoust Soc Am. 1987;80:124–132. doi: 10.1121/1.394460. [DOI] [PubMed] [Google Scholar]
- 10.Pfeiffer R R, Kim D O. J Acoust Soc Am. 1975;58:867–869. doi: 10.1121/1.380735. [DOI] [PubMed] [Google Scholar]
- 11.Kim D O, Molnar C E. J Neurophysiol. 1979;42:16–30. doi: 10.1152/jn.1979.42.1.16. [DOI] [PubMed] [Google Scholar]
- 12.Geisler C D, Cai Y. J Acoust Soc Am. 1996;99:1550–1555. doi: 10.1121/1.414731. [DOI] [PubMed] [Google Scholar]
- 13.Murugasu E, Russell I J. J Neurosci. 1996;16:325–332. doi: 10.1523/JNEUROSCI.16-01-00325.1996. [DOI] [PMC free article] [PubMed] [Google Scholar]
- 14.Greenwood D D. J Acoust Soc Am. 1990;87:2592–2605. doi: 10.1121/1.399052. [DOI] [PubMed] [Google Scholar]
- 15.Russell I J, Sellick P M. J Physiol (London) 1978;284:261–290. doi: 10.1113/jphysiol.1978.sp012540. [DOI] [PMC free article] [PubMed] [Google Scholar]
- 16.Sellick P M, Patuzzi R, Johnstone B M. J Acoust Soc Am. 1982;72:131–141. doi: 10.1121/1.387996. [DOI] [PubMed] [Google Scholar]
- 17.Nuttall A L, Dolan D F. J Acoust Soc Am. 1996;99:1556–1565. doi: 10.1121/1.414732. [DOI] [PubMed] [Google Scholar]
- 18.Robles L, Ruggero M A, Rich N C. J Acoust Soc Am. 1986;80:1364–1374. doi: 10.1121/1.394389. [DOI] [PubMed] [Google Scholar]
- 19.Ruggero M A, Rich N C. Hear Res. 1991;51:215–230. doi: 10.1016/0378-5955(91)90038-b. [DOI] [PMC free article] [PubMed] [Google Scholar]
- 20.Thorne P R, Gavin G B. J Acoust Soc Am. 1984;76:440–442. doi: 10.1121/1.391136. [DOI] [PubMed] [Google Scholar]
- 21.Cody A R. Hear Res. 1992;62:166–171. doi: 10.1016/0378-5955(92)90182-m. [DOI] [PubMed] [Google Scholar]
- 22.Kössl M, Vater M J. Comp Physiol A. 1990;166:687–697. doi: 10.1007/BF01351362. [DOI] [PubMed] [Google Scholar]
- 23.Kössl M, Russell I J. Proc Natl Acad Sci USA. 1995;92:276–279. doi: 10.1073/pnas.92.1.276. [DOI] [PMC free article] [PubMed] [Google Scholar]
- 24.Engström H. Int Rev Cytol. 1958;7:535–585. [Google Scholar]
- 25.Kolston P J, Viergever M A, de Boer E, Diependaal R J. J Acoust Soc Am. 1989;86:133–140. doi: 10.1121/1.398332. [DOI] [PubMed] [Google Scholar]
- 26.Johnstone B M, Patuzzi R B, Yates G K. Hear Res. 1986;22:147–153. doi: 10.1016/0378-5955(86)90090-0. [DOI] [PubMed] [Google Scholar]


