

Abstract
Previous postsynaptic density (PSD) isolation methodologies have utilized either whole brain or discrete brain regions of relatively large mammals such as dogs and rats. The present report details a simple and highly effective procedure for the rapid isolation of PSDs from small amounts of adult mouse hippocampus that has several advantages. First, by substituting synaptoneurosomes for synaptosomes as starting material, we have decreased the steps, time, and amount of tissue required to isolate PSDs. Second, by modifying critical steps in the synaptic isolation protocols we were able to isolate PSDs from less than 200 mg of mouse hippocampi in 3 h. Electron micrographs of isolated synaptoneurosomes showed presynaptic vesicles and densely stained membranes representing PSDs. Morphological examination of these PSDs by electron microscopy revealed a preparation that seems to be quite pure, with little or no membrane contamination. A comparison by Western blot analysis of synaptoneurosome and PSD fractions suggests that this technique yields a purified sample. Moreover, two different protocols using swing and fixed bucket rotors were used for this small-scale PSD isolation and both resulted in a very pure partition, supporting the idea that this procedure is reliable and consistent.
Keywords: Postsynaptic densities, Synaptoneurosomes, Hippocampus, Electron microscopy, PSD95, Synaptotagmin, Mouse
1. Introduction
The study of proteins and receptors at synaptic sites has provided valuable information about molecular mechanisms underlying neuronal activity (Cohen et al., 1977; Kennedy et al., 1983) as well as the pathogenesis of diseases (Unger et al., 2005) and aging (Helfert et al., 2003). The identification of these proteins at synaptic sites provides valuable information to how the synapses function during synaptic transmission (Carlin et al., 1980; Cohen et al., 1977; Kennedy, 1997; Kennedy et al., 1983; Marrs et al., 2001; Suzuki et al., 1993). Thus, the isolation of presynaptic and postsynaptic structures becomes a useful technique to observe molecular changes in protein composition at synapses.
Traditionally, the most commonly studied fraction for neurochemical research has been the synaptosome, detached synapses which are sealed presynaptic nerve terminals containing a portion of the target cell adhering to their external surface (Hebb and Whittaker, 1958). There are some morphological criteria to identify synaptosomes, including small mitochondria within a sealed plasma membrane, synaptic vesicles present in nerve terminals, and an electron-dense membrane resembling postsynaptic membranes adhering to the periphery of the synaptosome (Whittaker, 1993). To achieve an enrichment in neuronal markers, several studies reported the use of a crude particulate fraction containing presynaptic and postsynaptic vesicularized components (Daly et al., 1980; Horn and Phillipson, 1976; Shimizu et al., 1975). The term synaptoneurosome is suggested for entities in which a presynaptic sac (synaptosome) is attached to a resealed postsynaptic sac (neurosome) (Hollingsworth et al., 1985; Quinlan et al., 1999). The point of contact between two neurons is the synaptic junction (Palay, 1956). The synaptic junction consists of regions of the presynaptic and postsynaptic plasma membranes joined together by structures within the synaptic cleft. The postsynaptic part is thick, lying closely adjacent to the postsynaptic membrane plus adherent sub-synaptic material. This fraction corresponds to the postsynaptic density fraction or PSD (Akert et al., 1969; Bloom, 1970).
Most methods used to isolate PSDs use synaptosomes or synaptic membrane fractions as the source of PSDs (Carlin et al., 1980; Cohen et al., 1977; Kennedy, 1997; Marrs et al., 2001). When sucrose gradients are used to isolate synaptosomes, a significant amount of material is lost. Therefore, a large quantity of starting material is usually required for this method. Other methods require several centrifugations, which also lead to significant loss of material. Some methods that do not require sucrose gradients or several centrifugations use detergents to solubilize non-PSD membranes from synaptic membranes (Kennedy, 1997). These methods are ideal for small quantities but risk contamination due to detergent insoluble proteins.
Although some of these techniques may be modified to isolate PSDs from rat or mouse whole brain, no protocols exist to isolate PSDs from specific mouse brain regions such as the hippocampus. In this manuscript, we offer an alternative method for isolating PSDs that requires smaller amounts of starting material and less time for preparation. We combined and modified protocols to isolate PSDs in 3 h or less using as little as 200 mg of tissue. We also compare and contrast two different protocols that we developed throughout our experiments.
2. Materials and methods
2.1. Materials
Unless otherwise noted, chemicals were obtained from Sigma (St. Louis, MO, USA). Anti-PSD95 and anti-tubulin were obtained from Upstate Biotechnology (Lake Placid, NY, USA). Anti-synaptotagmin was obtained from Santa Cruz (Santa Cruz, CA, USA) and anti-CaMKII was obtained from Chemicon International (Chemicon International, Temecula, CA). Anti-glial fibrillary acidic protein (GFAP), and horseradish peroxidase-conjugated secondary antibodies were obtained from Promega (Madison, WI, USA). Enhanced chemiluminescence (ECL) Western blotting detection reagents were obtained from Amersham Biosciences (Piscataway, NJ, USA).
2.2. Animals and tissue collection
Animals were handled and sacrificed in compliance with institutional and national regulations and policies. The protocol was approved by the Institutional Animal Care and Use Committee at Baylor College of Medicine. Male C57BL/6J mice (6–8 weeks old) were sacrificed by cervical dislocation under gentle anesthesia. Two protocols were followed. The fixed angle rotor protocol used 11 hippocampi from adult mice to obtain PSDs, which is a substantial reduction of sample compared to previous protocols (Carlin et al., 1980; Cohen et al., 1977; Johnson et al., 1997). The swing bucket rotor protocol used only four hippocampi to isolate PSDs, a 63% reduction in tissue and animals compared to the fixed angle rotor protocol that is also described in this manuscript.
The brain was removed from several mice, hippocampi were isolated, pooled, and homogenized in 40 ml (fixed angle rotor protocol) or 8 ml (swing bucket protocol) of synaptoneurosome buffer for processing (10 mM HEPES, 1 mM EDTA, 2 mM EGTA, 0.5 mM DTT, 10 μg/ml leupeptin, and 50 μg/ml soybean trypsin inhibitor, pH 7.0).
2.3. Isolation of synaptoneurosomes
The same protocol for isolating synaptoneurosomes described below was used for either the fixed angle rotor or the swing bucket protocol. The solution amounts described here were used in the fixed angle rotor method. For the swing bucket method, volumes of buffers and solutions were reduced 4 × because the starting material was reduced.
Whole hippocampi were homogenized in synaptoneurosome buffer at 4 °C using a Teflon-glass mechanical tissue grinder (0.25 mm clearance). A fraction of homogenate sample was set aside for Western blot analysis. From this step forward the homogenate was kept ice-cold at all times to minimize proteolysis throughout the isolation procedure. The homogenate then was diluted further with same volume of synaptoneurosome buffer and briefly and gently sonicated delivering 3 pulses using an output power of 1 in a 60Sonic dismembrator (Fisher Scientific, Pittsburgh, PA). The sample was loaded into a 60 ml Leur-lok syringe and filtered twice through three layers of a pre-wetted 100 μm pore nylon filter held in a 13 mm diameter filter holder. The resulting filtrate then was loaded into a 5 ml Leur-lok syringe and filtered through a pre-wetted 5 μm pore hydrophilic filter held in a 13 mm diameter filter holder. Because the 5 μm pore size filter produces more pressure and requires changing out the filter within samples, smaller 5 ml volumes were filtered to keep the sample cold while filtering, and then were pooled together. The resulting filtrate was placed in a 50 ml polycarbonate tube and centrifuged at 1000 × g for 10 min. The pellet obtained corresponded to the synaptoneurosome fraction. Isolated synaptoneurosomes were resuspended in 5 ml of buffer solution containing 0.32 M sucrose, and 1 mM NaHCO3 (pH 7.0). A 300 μl sample of synaptoneurosomes was set aside for Western blot analysis and electron microscopy.
2.4. Isolation of postsynaptic densities
Isolated synaptoneurosomes were diluted further with 5 ml of 1%Triton X-100 in 32 mM sucrose–12 mM Tris–HCL (pH 8.1). The sample was stirred in the same open top tube in a 4 °C cold room for 15 min, and then centrifuged at 33,000 × g for 20 min. For the fixed angle rotor protocol, the pellet was resuspended with 500 μl of buffer solution and layered onto a sucrose gradient containing 1.16 ml of 2.0 M sucrose, 0.9 ml 1.5 M sucrose–1 mM NAHCO3, 0.9 ml 1.0 M sucrose–1 mM NAHCO3. The sample was spun in a fixed angle rotor, for 2 h at 200,000 × g. For the swing bucket rotor procedure, the resulting pellet was resuspended with 50 μl of buffer solution and layered onto a sucrose gradient containing 300 μl of 1.5 M sucrose–1 mM NaHCO3 and 300 μl of 1.0 M sucrose–1 mM NaHCO3. The sample then was centrifuged at 167,000 × g for 2 h in a swing bucket rotor. The streak-like cloudy band between 2.0 M sucrose and 1.5 M sucrose–1 mM NaHCO3 (for the fixed angle rotor) or the pellet (for the swing bucket rotor) containing PSDs was removed carefully and resuspended in 600 μl (fixed angle rotor protocol) or in 70 μl (swing bucket protocol) of buffer solution. An equal amount of 1% Triton X-100–150 mM KCl was added to the sample for resuspension. The sample then was centrifuged at 200,000 × g for 30 min (fixed angle rotor) or at 167,000 × g for 30 min (swing bucket rotor). The resulting pellet was resuspended in 600 μl (fixed angle rotor) or 50 μl (swing bucket rotor) of buffer solution for Western blot analysis and for electron microscopy studies.
2.5. Electron microscopy
The supernatants from the last centrifugation step in the synaptoneurosome and PSD isolation procedures were carefully removed. Samples were pelleted and prepared for electron microscopy by adding 500 μl of 0.1 M cacodylate with 2 mM CaCl2 buffer. The pellet was spun briefly before it was fixed in 500 μl of 2.5% glutaraldehyde in 0.1 M cacodylate with 2 mM CaCl2 buffer for 30 min on ice. Samples were washed 3 times for 3 min with 0.1 M cacodylate with 2 mM CaCl2 buffer, fixed for 30 min in 1% OsO4 in 0.1 M cacodylate buffer and washed twice for 5 min with 0.1 M cacodylate buffer with 2 mM CaCl2. Synaptoneurosome and PSD samples were gradually dehydrated with a two to 3 min wash of 25–50% ethyl alcohol and then En bloc stained with filtered 2% ethanolic uranyl acetate for 30 min. The samples were dehydrated further in series of 70, 95, and 100% ethanol washes. Durcupan ACM Epoxy Resin was used to embed the samples and cured at 55 °C for 2–3 days. Eighty nanometer thin sections were cut using MT6000-XL ultramicrotome and then stained in uranyl acetate and lead citrate. Sections were viewed on Hitachi H7500 Transmission Electron Microscope and images were acquired with Gatan Ultrascan 1000 CCD camera.
2.6. Western blot analysis
A Bradford assay (Bradford, 1976) was performed to calculate protein yield and equivalent amounts of protein from homogenate, synaptoneurosome, and PSD samples were resolved via electrophoresis on 10% SDS-PAGE gels. For detection of PSD-95, tubulin, α-CaMKII, and GFAP, 7.5 μg of protein were loaded on each lane. Samples probed for synaptotagmin were loaded with 10 μg of protein. The gels were transferred overnight to polyvinylidene difluoride (PVDF) membranes, and incubated in a solution of 0.2% I-Block (Tropix, Bedford, MA) for 1 h at room temperature. Blots were incubated with anti-PSD-95 (1:5000 dilution), anti-synaptotagmin (1:1000), anti-tubulin (1:1000), anti-αCaMK II (1:1000), or anti-GFAP (1:1000) for 1 h at room temperature under shaking, washed four times for 15 min in Tris-buffered saline with Tween 20 (TTBS, 50 mM Tris–HCl [pH 7.5–8.0], 150 mM NaCl, and 0.1% Tween 20), followed by a 1 h incubation with a horseradish peroxidase-conjugated goat anti-mouse (1:20,000, from Promega, Madison, WI) for membranes treated with anti-PSD-95, anti-tubulin, and anti-αCaMKII. Membranes treated with anti-synaptotagmin were probed with a horseradish peroxidase-conjugated donkey anti-goat (1:5000, from Promega) and membranes treated with anti-GFAP were probed with a horseradish peroxidase-conjugated goat anti-rabbit (1:5000, from Promega) for 1 h at room temperature. Blots then were washed four times for 15 min and visualized using enhanced chemiluminescense (ECL, Amersham Biosciences, Piscataway, NJ).
3. Results
3.1. Synaptoneurosome and PSD preparation
Because of the large amount of material needed to obtain PSDs, previous reports utilized various brain regions of dogs and rats. Here we have scaled down the procedure, reporting a simple and highly effective technique for the rapid isolation of PSDs from a discrete amount of adult mouse hippocampus. Flow charts depicting each procedure are shown in Fig. 1. According to a standard protein determination, we were able to isolate PSDs from less than 200 mg of mouse hippocampal protein in only 3 h. Moreover, two different protocols using fixed angle and swing bucket rotors were used for our small-scale PSD isolation and both resulted in a very pure partition, supporting the idea that this method is consistent and reliable.
Fig. 1.

Schematic depicting protocols for the isolation of (A) synaptoneurosomes and (B) postsynaptic densities (PSDs) from mouse hippocampus.
3.2. Morphology assessment by electron microscopy
To obtain an assessment of the morphology of isolated synaptoneurosome and PSD fractions, the pellet was examined by electron microscopy. The term synaptoneurosome is suggested for entities in which a presynaptic sac, a synaptosome, is attached to a resealed postsynaptic sac, a neurosome (Hollingsworth et al., 1985). Certain morphological characteristics have been defined previously that allowed us to identify synaptoneurosomes (Hollingsworth et al., 1985; Quinlan et al., 1999), such as a local concentration of vesicles resembling in size and number the synaptic vesicles seen in nerve terminals, and the presence of a characteristically electron-dense membrane, resembling postsynaptic membranes adhering to the periphery of the synaptosome.
As shown in Fig. 2, electron micrographs of synaptoneurosome fractions confirmed a dense cellular mass in which mitochondria and vesicular structures are seen together with densely stained membranes representing PSDs (Fig. 2A). A close view of the synaptoneurosome fraction revealed vesicular clusters inside intact synapses (Fig. 2B and C). These electron micrographs are in agreement with previous studies underlining synaptoneurosome preparations (Hollingsworth et al., 1985; Johnson et al., 1997).
Fig. 2.

Electron micrographs of representative sample of synaptoneurosomes isolated from mouse hippocampus. (A) A typical large field view of synaptoneurosomes (2500×). Arrow indicates synaptic junctions. Mitochondria (m) also are present. (B) A close up view of a complete synaptoneurosome. (C) Higher magnification of the synaptic site where the presynaptic terminal displays vesicles and a postsynaptic membrane contains PSDs (25,000×). Synaptosome (S), presynaptic vesicles (pv), neurosome (N), and densely stained membranes that characterize PSDs (PSD) are shown.
The point of contact between the synaptosome and the neurosome is thick, lying closely adjacent to the postsynaptic membrane. This fraction corresponds to the PSD. The PSD has been described as a small, irregular, fibrous structure that is located underneath the postsynaptic membrane of synapses (Kennedy, 1997). Examination of electron micrographs of PSD preparations revealed densely stained structures ranging from ~200 to 500 nm in length (Fig. 3A). These structures varied in shape with some appearing disc or bar shaped and others amorphous. The outlines of several PSDs were not distinct and appeared diffused. Membrane contamination, although minimal, was present. The electron micrographs of the PSDs resembled those obtained by similar methods of isolation (Carlin et al., 1980; Cohen et al., 1977; Cotman et al., 1974).
Fig. 3.
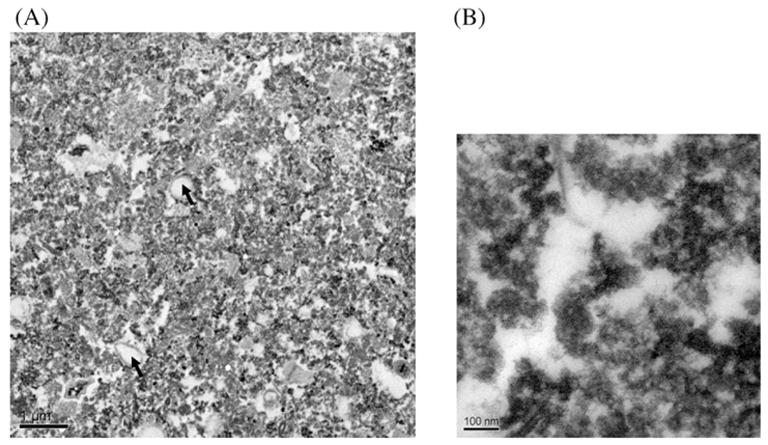
Electron micrographs of representative samples of PSDs isolated from mouse hippocampus. (A) A typical large field view of isolated PSDs showing densely stained structures that are enriched in the sample (2500×). Arrow indicates membrane contamination. (B) A close up view of a PSD preparation (25,000×).
3.3. Western analysis of synaptoneurosome and PSD preparation
We relied on the specific localization and expression of certain proteins in the mouse hippocampus to further analyze our synaptoneurosome and PSD preparations from the mouse hippocampus. Synaptotagmin is a presynaptic vesicular protein involved in regulating exocytosis (Elferink et al., 1993). Thus, synaptotagmin can be used as a presynaptic marker. PSD-95 is a postsynaptic protein that binds to ion channels and helps anchor them to the postsynaptic density (Garner et al., 2000; Sheng, 1997). Therefore, PSD-95 may be used as a postsynaptic marker. CaMKII is a pansynaptic protein, although it is most abundant in the PSD (Johnson et al., 1997; Kennedy et al., 1983). Thus, levels of CaMKII also may be used to assess the purity of the PSD fraction. Tubulin is a non-synaptic protein, and its levels should be reduced in both synaptoneurosome and PSD preparations. Biochemical characterization of these fractions confirmed that synaptoneurosomes were enriched in synaptotagmin as compared to the homogenates and PSDs (Fig. 4). Moreover, the postsynaptic protein, PSD95 was significantly enriched in the PSD samples isolated from both protocols, as compared to synaptoneurosome and homogenate samples (Fig. 4B). Western blot analyses also indicated the presence of CaMKII in all of our samples with the highest levels present in the PSD fraction. The levels of the non-synaptic protein tubulin as well as the glial marker GFAP were diminished in both synaptoneurosomes and PSDs as compared to hippocampal homogenates (Fig. 4).
Fig. 4.

Expression of presynaptic and postsynaptic markers in homogenate, synaptoneurosome, and PSD preparations. (A) Representative Western blot analysis of homogenate (H), synaptoneurosome (S), and PSDs (P) isolated using fixed rotor and swing bucket protocols. Equal amounts of protein (7.5 μg/lane for PSD-95, tubulin, αCaMKII, and GFAP, 10 μg/lane for the detection of synaptotagmin) were loaded in each sample (n = 8). (B) Group data (mean ± S.E.M., n = 8) of synaptotagmin and PSD 95 immunoreactivity in Western blots of mouse hippocampus. Immunoreactivity was normalized to the homogenate. ‘*’ denotes statistical significance (p < 0.05 by Student’s t-test).
PSD samples obtained from the swing bucket protocol contained less synaptoneurosome contamination than the PSD samples obtained using a fixed angle rotor protocol. The biochemical characterization of these fractions suggests that this technique yields purified synaptoneurosome and PSD fractions. Taken together, these data suggest that these isolation methods yielded highly enriched PSDs from the adult mouse hippocampus that were almost totally devoid of membrane contamination.
4. Discussion
The present results demonstrate a simple and rapid procedure for the isolation of PSDs from a discrete amount of adult mouse hippocampus. In the interest of reducing the amount of starting material needed to isolate PSDs, we have adapted standard procedures (Whittaker, 1965) that isolate PSDs from various brain regions of dog (Carlin et al., 1980; Cohen et al., 1977; Wu et al., 1986), guinea pig cerebral cortex (Hollingsworth et al., 1985), or rat cortices (Quinlan et al., 1999), so that small amounts of mouse hippocampus could be used.
Previous methods have used large animals because large quantities of starting material were needed (Carlin et al., 1980; Cohen et al., 1977; Wu et al., 1986). Synaptosomes previously were isolated from whole brain and used to obtain PSDs. Synaptosome yields were sufficient enough to produce adequate amounts of PSDs. However, using these procedures to isolate PSDs from mouse hippocampus would require a large number of animals. To address this problem, we used an alternative source for PSDs (synaptoneurosomes) which can be isolated in high yields and requires smaller quantities of starting material. Synaptoneurosomes are biochemically comparable to synaptosomes and can be easily isolated using a filtration method (Hollingsworth et al., 1985; Johnson et al., 1997). In this report, we used less than 200 mg of mouse hippocampi to obtain first synaptoneurosomes and then PSDs, with a final yield of approximately 60–70 μg of PSD material. This amount of sample is sufficiently large to be useful in a variety of neurochemical assays. Our method is easily and quickly performed by two sequential filtrations, a low speed centrifugation, and three high speed centrifugations including a sucrose gradient (Fig. 1).
Electron micrographs of isolated synaptoneurosome fractions from mouse hippocampus showed little cell body content and enriched synaptic structures. Synaptoneurosome and PSDs micrographs (Figs. 2 and 3) appeared comparable to electron micrographs reported in previous studies obtained from larger amounts of material (Carlin et al., 1980; Cohen et al., 1977; Cotman et al., 1974; Hollingsworth et al., 1985; Johnson et al., 1997; Matus et al., 1980). PSD electron micrographs showed a high purity for PSDs with little membrane contamination (Fig. 3). The membrane contamination observed here could be a result of the “sticky” quality of the PSDs rather than the isolation procedure (Matus et al., 1980).
In addition to the morphological characteristics of the synaptoneurosome and PSD fractions, a Western blot protein profile of our preparations was performed. Two methods were developed to optimize purity and efficiency of PSD isolation. The first protocol used a fixed angle rotor and the second protocol used a swing bucket rotor. To determine the efficiency of the isolation procedure, antibodies against proteins found predominantly either presynaptically (synaptotagmin), or postsynaptically (PSD95), or in both regions (CaMKII) were chosen. According to our Western blot data, synaptoneurosomes and PSD preparations were practically absent of glial material. Both protocols were successful in isolating PSDs as indicated by the significant enrichment of PSD95 in the PSD fraction. However, the fixed angle rotor protocol contained moderate amounts of synaptoneurosomal contamination as indicated by the presence of synaptotagmin in the PSD fraction (Fig. 4). The swing bucket rotor protocol decreased contamination found in the former protocol producing significantly less contamination than the fixed rotor protocol. Thus, swing bucket and fixed angle rotors can be used to isolate PSDs with great consistency.
In conclusion, our procedure appears to be fast, reliable, and convenient for the isolation of synaptoneurosomes and PSDs from a very small amount of brain tissue. Our protocol also offers an alternative to PSD isolation procedures that require multiple detergent washes that may result in the loss of some PSD proteins (Kennedy, 1997). Reducing the amount of starting material required for isolating PSDs facilitates and broadens the scope of specimens that can be used to study molecular changes at the synapse. For example, our protocol may enable isolation of PSDs from tissue cultures. Additionally, this protocol could be used to study changes in the synapse resulting from behavioral, pharmacological, or electrophysiological experiments.
Acknowledgments
This work was supported by NIH grant NS048037 (M.V.T) and NS34007 (E.K.). Special thanks to Dr. Michael Mancini and Claire Haueter from the Department of Molecular & Cellular Biology at Baylor College of Medicine for their assistance in the electron microscopy tissue preparations, preparation of photomicrographs and use of the electron microscope.
References
- Akert K, Moor H, Pfenninger K, Sandri C. Contributions of new impregantion methods and freeze-etching to the problems of synaptic fine structure. Prog Brain Res. 1969;31:223–40. doi: 10.1016/S0079-6123(08)63241-0. [DOI] [PubMed] [Google Scholar]
- Bloom FE. Correlating structure and function of synaptic ultrastructure. In: Schmitt FO, editor. The neurosciences: second study program. New York: The Rockefeller University Press; 1970. p. 729. [Google Scholar]
- Bradford MM. A rapid and sensitive method for the quantitation of microgram quantities of protein utilizing the principle of protein-dye binding. Anal Biochem. 1976:248–54. doi: 10.1016/0003-2697(76)90527-3. [DOI] [PubMed] [Google Scholar]
- Carlin RK, Grab DJ, Cohen RS, Siekevitz P. Isolation and characterization of postsynaptic densities from various brain regions: enrichment of different types of postsynaptic densities. J Cell Biol. 1980;86:831–43. doi: 10.1083/jcb.86.3.831. [DOI] [PMC free article] [PubMed] [Google Scholar]
- Cohen RS, Blomberg F, Berzins K, Siekevitz P. The structure of postsynaptic densities isolated from dog cerebral cortex. I. Overall morphology and protein composition. J Cell Biol. 1977;74:181–203. doi: 10.1083/jcb.74.1.181. [DOI] [PMC free article] [PubMed] [Google Scholar]
- Cotman CW, Banker G, Churchill L, Taylor D. Isolation of postsynaptic densities from rat brain. J Cell Biol. 1974;63:441–55. doi: 10.1083/jcb.63.2.441. [DOI] [PMC free article] [PubMed] [Google Scholar]
- Daly JW, NcNeal E, Partington C, Neuwirth M, Creveling CR. Accumulations of cyclic AMP in adenine-labeled cell-free preparations from guinea pig cerebral cortex: role of a-adrenergic and H1-histaminergic receptors. J Neurochem. 1980;35:326–37. doi: 10.1111/j.1471-4159.1980.tb06268.x. [DOI] [PubMed] [Google Scholar]
- Elferink LA, Peterson MR, Scheller RH. A role for synaptotagmin (p65) in regulated exocytosis. Cell. 1993;72:153–9. doi: 10.1016/0092-8674(93)90059-y. [DOI] [PubMed] [Google Scholar]
- Garner CC, Nash J, Huganir RL. PDZ domains in synapse assembly and signalling. Trends Cell Biol. 2000:280. doi: 10.1016/s0962-8924(00)01783-9. [DOI] [PubMed] [Google Scholar]
- Hebb CO, Whittaker VP. Intracellular distribution of choline acetylase. J Physiol. 1958;142:187–96. doi: 10.1113/jphysiol.1958.sp006008. [DOI] [PMC free article] [PubMed] [Google Scholar]
- Helfert H, Krenning J, Wilson TS, Hughes LF. Age-related synaptic changes in the anteroventral cochlear nucleus of Fischer-344 rats. Hearing Res. 2003;183:18–28. doi: 10.1016/s0378-5955(03)00194-1. [DOI] [PubMed] [Google Scholar]
- Hollingsworth EB, McNeal ET, Burton JL, Williams RJ, Daly JW, Creveling CR. Biochemical characterization of a filtered synaptoneurosome preparation from guinea pig cerebral cortex: cyclic adenosine 3′:5′-monophosphate-generating systems, receptors, and enzymes. J Neurosci. 1985;5:2240–53. doi: 10.1523/JNEUROSCI.05-08-02240.1985. [DOI] [PMC free article] [PubMed] [Google Scholar]
- Horn AS, Phillipson OT. A noradrenaline sensitive adenylate cyclase in the rat limbic forebrain: preparation, properties and the effects of agonists, adrenolytics, and neuroleptic drugs. Eur J Pharmacol. 1976;45:407–14. doi: 10.1016/0014-2999(76)90002-9. [DOI] [PubMed] [Google Scholar]
- Johnson MW, Chotiner JK, Watson JB. Isolation and characterization of synaptoneurosomes from single rat hippocampal slices. J Neurosci Methods. 1997;77:151–6. doi: 10.1016/s0165-0270(97)00120-9. [DOI] [PubMed] [Google Scholar]
- Kennedy MB. The postsynaptic density at glutamatergic synapses. Trends Neurosci. 1997;20:264–8. doi: 10.1016/s0166-2236(96)01033-8. [DOI] [PubMed] [Google Scholar]
- Kennedy MB, Bennett MK, Erondu NE. Biochemical and immunochemical evidence that the major postsynaptic density protein is a subunit of a calmodulin dependent protein kinase. Proc Natl Acad Sci USA. 1983;80:7357–61. doi: 10.1073/pnas.80.23.7357. [DOI] [PMC free article] [PubMed] [Google Scholar]
- Marrs GS, Green SH, Dailey ME. Rapid formation and remodeling of postsynaptic densities in developing dendrites. Nat Neurosci. 2001;4:1006–13. doi: 10.1038/nn717. [DOI] [PubMed] [Google Scholar]
- Matus A, Pehling G, Ackermann M, Maeder J. Brain postsynaptic densities: the relationship to glial and neuronal filaments. J Cell Biol. 1980;87:346–59. doi: 10.1083/jcb.87.2.346. [DOI] [PMC free article] [PubMed] [Google Scholar]
- Palay SL. Synapses in central nervous system. J Biochem Biophys Cytol. 1956;2(Suppl):193–201. doi: 10.1083/jcb.2.4.193. [DOI] [PMC free article] [PubMed] [Google Scholar]
- Quinlan EM, Olstein DH, Bear MF. Bidirectional, experience-dependent regulation of N-methyl-D-aspartate receptor subunit composition in the rat visual cortex during postnatal development. Proc Natl Acad Sci USA. 1999;96:12876–80. doi: 10.1073/pnas.96.22.12876. [DOI] [PMC free article] [PubMed] [Google Scholar]
- Sheng M. Glutamate receptors put in their place. Nature. 1997;386:221–3. doi: 10.1038/386221a0. [DOI] [PubMed] [Google Scholar]
- Shimizu H, Ichishita H, Miaokami Y. Stimulation of the cell-free adenylate cyclase from guinea pig cerebral cortex by acidic amino acids and veratridine. J Cyclic Nucleotide Res. 1975;1:61–7. [PubMed] [Google Scholar]
- Suzuki T, Okumara-Noji K, Tanaka R, Ogura A, Nakamura K, Kudo Y, et al. Characterization of protein kinase C activities in postsynaptic density fractions prepared from cerebral cortex, hippocampus, and cerebellum. Brain Res. 1993;619:69–75. doi: 10.1016/0006-8993(93)91596-k. [DOI] [PubMed] [Google Scholar]
- Unger C, Hedberg MM, Mustafiz T, Svedberg MM, Nordberg A. Early changes in Aβ levels in the brain of APPswe transgenic mice—implication on synaptic density, α7 neuronal nicotinic acetylcholine- and N-methyl-D-aspartate receptor levels. Mol Cell Neurosci. 2005;30:218–27. doi: 10.1016/j.mcn.2005.07.012. [DOI] [PubMed] [Google Scholar]
- Whittaker VP. The application of subcellular fractionation techniques to the study of brain function. Prog Biophys Mol Biol. 1965;15:39–96. doi: 10.1016/0079-6107(65)90004-0. [DOI] [PubMed] [Google Scholar]
- Whittaker VP. Thirty years of synaptosome research. J Neurocytol. 1993;22:735–42. doi: 10.1007/BF01181319. [DOI] [PubMed] [Google Scholar]
- Wu K, Carlin R, Siekevitz P. Binding of L-[3H]Glutamate to fresh or frozen synaptic membrane and postsynaptic density fractions isolated from cerebral cortex and cerebellum of fresh or frozen canine brain. J Neurochem. 1986;46:831–41. doi: 10.1111/j.1471-4159.1986.tb13047.x. [DOI] [PubMed] [Google Scholar]