Abstract
Aims
Increasingly HMG CoA reductase inhibitors (statins) are being used for primary prevention of vascular disease in patients with a raised cholesterol but at low absolute risk of coronary heart disease (CHD). This study uses clinical trial results to explore the limits of absolute safety for statin use in such patients.
Methods
The major placebo controlled statin outcome trials were identified by automated and manual literature searches. Principal results including all cause mortality in placebo and intervention groups and baseline values of standard coronary risk factors were abstracted for each trial. For the trials identified the reduction in overall mortality with statin treatment for each study was regressed against the underlying CHD risk of the population recruited into that trial using a statistically robust method.
Results
The regression line describing the relationship between mortality benefit and risk suggests that statin use could be associated with an increase in mortality of 1% in 10 years. This would be sufficiently large to negate statin's beneficial effect on CHD mortality in patients with a CHD event risk less than 13% over 10 years.
Conclusions
Absolute safety of statins has not been demonstrated for patients at low risk of CHD. Patients absolute risk of CHD should be calculated before starting statin treatment for primary prevention. Extensions of such treatment to low risk patients should await further evidence of safety.
Keywords: drug safety, hydroxymethylglutaryl-Co A reductase inhibitors, hyperlipidaemia, meta-analysis
Introduction
Before the Scandinavian Simvastatin Survival Study (4S) [1] showed that simvastatin reduced total mortality in patients with coronary heart disease (CHD) there were concerns about the safety of lipid-lowering drug treatment [2]. Earlier trials had shown significant falls in coronary deaths [3] but no reduction in overall mortality. Meta-analyses of the results of trials of cholesterol lowering with drugs other than statins showed a significant increase in noncoronary deaths [4, 5]. One inference from this was that such treatment might cause harm. However, some rejected drug toxicity as the likely mechanism [6], invoking instead random variation, because no single cause of death explained the apparent increase in noncoronary mortality. Following the 4S study additional trials of HMGCoA reductase inhibitors (statins) have shown significant primary [7, 8] or secondary [9, 10] prevention of CHD, but not all have been able to confirm significant reduction in overall mortality. Participants in these trials were at lower risk of CHD than those included in 4S, and any reduction in CHD deaths was perhaps too small to change overall mortality significantly. A recent meta-analysis of statins in primary prevention confirmed the lack of demonstrable benefit in overall mortality and advised risk assessment to select patients for lipid lowering treatment [11]. This raises the question; at what level of coronary risk is the safety of statins assured by the trial evidence available? This analysis attempts to answer that question.
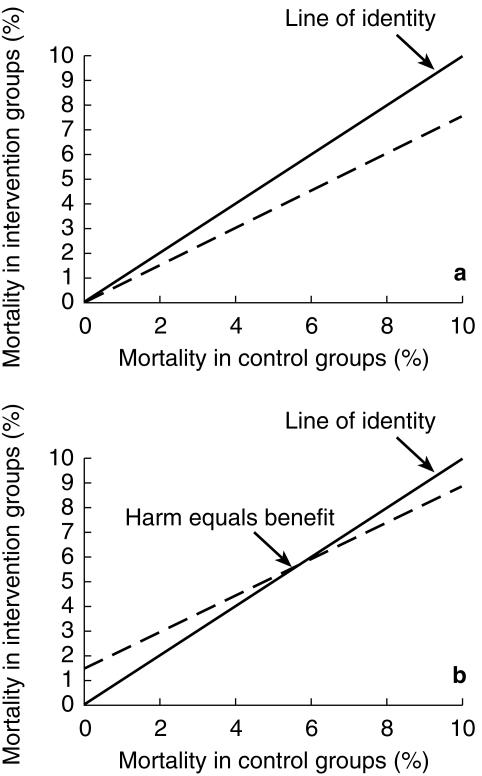
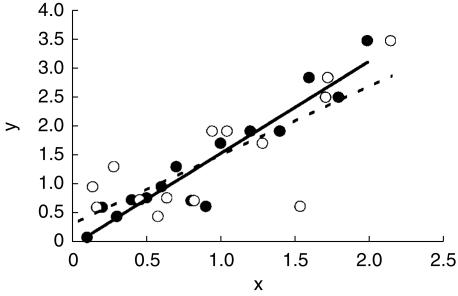
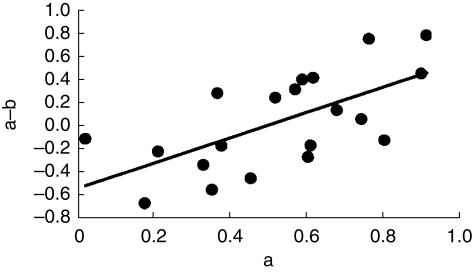
In a parallel situation Hoes and colleagues [12] have suggested that drug treatment of mild hypertension may actually harm people at low risk of cardiovascular disease (CVD). They analysed the results of outcome trials of antihypertensive treatment and showed that a plot of death rates in intervention groups against death rates in placebo groups, a L'Abbe plot, was not parallel to the line of identity, but crossed this at a point to the right of the origin. They interpreted the point of intersection between the line of best fit for the trial data and the line of identity as indicating the level of risk at which harm from antihypertensive treatment equalled its benefit. On this interpretation hypertensive subjects with a risk of death below 6% over 10 years would be harmed by drug treatment. The principles behind the L'Abbe plot and its interpretation are illustrated in Figure 1a, b. Egger & Davey-Smith [13] questioned the validity and interpretation of this analysis on the grounds that the slope of the line of best fit in such a plot will inevitably be less than unity because of regression dilution. This statistical phenomenon is seen in regressions where there is any element of error in the measurement of the independent (x) variable, and is illustrated in Figure 2. They argued that plots of this kind cannot be relied upon to indicate the level of risk at which putative harm due to drug toxicity equals the benefit of drug treatment. An alternative analysis to circumvent regression dilution would be to plot the absolute benefit of drug treatment against the risk of disease observed in the placebo or control groups within studies. Unfortunately such a plot runs into a different statistical problem, that of automatic correlation [14], and indeed had been rejected by Hoes and colleagues on this basis. When benefit is estimated as the difference in event rates between the placebo and intervention groups there is an inevitable mathematical relationship between the event rate in the placebo group and benefit because the placebo event rate is common to both variables. This correlation is automatic and often statistically significant. Figure 3 shows the correlation that results when independent random numbers a and b are used to derive the correlation between variables a−b vs a. Thus these two simple graphical approaches are intuitively attractive and can perhaps be used for exploratory evaluation, but they are considered liable to mislead if tests of statistical significance are applied, as discussed by Altman [15].
Figure 1.
Theoretical L'Abbe plot. Treatment causing neither harm nor benefit follows the line of identity (—). Panel a represents treatment (–) producing 20% relative endpoint reduction, and panel b treatment (…) producing identical benefit but increased mortality independent of underlying risk.
Figure 2.
Illustration of regression dilution. The line of best fit (—) to data where the x-value (•) is measured without error is steeper than the line (–) fitted to the same data with random ‘error’ added to the x-values (○).
Figure 3.
Illustrates automatic correlation. Values for a and b have been taken from a random distribution. Correlation of the difference between the two variables (a−b) with the value of one of the variables (a) is highly significant (P < 0.01) despite only 20 points.
A third approach to define the point at which benefit may equal harm has been proposed by Altman [15], but has not been applied in practice to our knowledge. In this method the estimate of risk employed is not the rate of events observed in the placebo groups of the trials. Rather the risk for the population included in each study is estimated using established predictors of risk and a risk function derived from entirely independent epidemiological or clinical trial populations. The question of automatic correlation does not arise with this approach, as any error in risk prediction will be independent of estimated benefit in the trials, when benefit is calculated as the difference in rates between the active and placebo groups. In such analyses the x-axis can represent any measure of risk, e.g. total mortality, CHD mortality, or total CHD events. The point at which benefit and harm from treatment are balanced will be expressed on the same risk scale. The measure of risk used will then act as a reference risk when interpreting data. Current guidelines use the CHD event rate over 10 years to define policies, and we have therefore used this measure of risk in this analysis for practical purposes.
A prerequisite for this type of analysis is a risk factor equation that is valid for all the trial populations investigated. For the present analysis the risk function had to accommodate patients with and without pre-existing vascular disease, i.e. secondary and primary prevention. Grover [16] has recently published parameters for a logistic regression function that does this and has shown that it accurately predicts the outcome in intervention trials of both antihypertensive and lipid-lowering drug treatment. We have used Grover's [16] risk function to perform the type of analysis suggested by Altman [15], aiming to establish the boundary of possible harm and proven benefit for statin treatment.
Methods
Trial data
The results of prospective randomised placebo controlled trials of statins where the principal hypothesis was primary or secondary prevention of CHD were sought by a Medline search and from a manual search of reviews. Annual death rates in the placebo and intervention groups were calculated for each trial by dividing the total number of deaths in each group by the product of the number of patients studied and the median duration of the trial. The death rates were used to construct a L'Abbe plot, using weighted linear regression to derive the line of best fit. This is presented as a graphical method only to explore the apparent relationship between benefit and underlying risk, and no statistical testing was performed on the parameters of this line. A second graphical exploration of the data was performed by plotting the differences in mortality between treated and control groups (benefit) against control group mortality (risk), as described earlier. The line of best fit was derived by least squares regression for the purposes of data exploration.
The Grover logistic model [16]
Grover and colleagues [16] derived the parameters describing this risk equation by fitting the data from a sample of subjects randomly selected from the Lipid Research Clinic prevalence study population, which had been followed prospectively for an average of 12.2 years [17]. Three separate logistic regression functions were derived to describe the risk of death due to coronary disease, stroke, or all causes. Baseline characteristics that correlated with risk of death in univariate analyses were included in a stepwise logistic regression analysis. Significant predictive factors for CHD death were cigarette smoking, sex, mean arterial pressure, pre-existing cardiovascular disease, age, glucose intolerance and the ratio of low density lipoprotein cholesterol to high density lipoprotein cholesterol (LDL:HDL ratio). Grover and colleagues applied the coefficients from their equation to these baseline risk factors for a cohort to predict the number of CHD deaths expected from the model at the end of the first year. They estimated the total number of nonfatal CHD events in that year as a fixed proportion of predicted CHD deaths and the total number of CHD events as the sum of predicted nonfatal CHD events and CHD deaths. At the start of each new year they reapplied the coefficients to the baseline values for the cohort, changing only the proportion with pre-existing CHD to account for those who had suffered a first CHD event in the preceding year. The predictive Markov model they developed thus was validated by showing that it accurately predicted the outcome in a number of clinical trials when the baseline data on risk factors for subjects in the trials were used as parameters in the model.
Application of model to statin trials
The risk of CHD death in the placebo groups in the statin trials was calculated using the coefficients of the logistic regression equation derived by Grover and the baseline values of the risk factors for each of the trials. Mean arterial pressures (MAP) were not reported in the LIPID study [10] and an estimated value for this was derived from the average of the MAPs in the other trials included. The predicted CHD event risk in each trial was estimated as the CHD death risk predicted by the model for that trial factored by the mean ratio of observed CHD events to observed CHD deaths. This ratio was derived from those trials that presented data for CHD endpoints defined in a manner compatible with current guidelines. Three trials provided such data (CARE [9], TEXCAPS/AFCAPS [8] and LIPID [10]), and the mean ratios of total CHD events to CHD deaths and total CHD events to total mortality in the placebo groups of these studies were 5.1 and 2.84, respectively. Net benefit of statin treatment was calculated as the difference between the total death rates in placebo and intervention groups so as to include both the beneficial effect on CHD mortality and any possible deaths due to drug toxicity.
Statistical testing of the relationship between estimated risk and benefit was derived from a plot of net benefit for each trial against the estimated 10 years CHD event risk in control patients in that trial calculated using mean baseline data and the Grover risk function. Weighted linear regression was used to estimate the best line describing the relation between net benefit from treatment on overall mortality and estimated 10 years risk of CHD events. Variance of the rate of benefit used as weighting factor for the regression was calculated using standard formulae for variance of difference in proportions and variance of a ratio [18, eqn 3.15 p. 91, eqn 4.14 p. 129]. The point of intersection of the line of best fit with the x-axis was taken as the 10 years CHD event risk at which the net benefit from treatment with statins may be balanced by harm. The absolute annual risk of harm associated with drug treatment was estimated from the point of intersection of the line of best fit with the y-axis.
Confidence intervals for the estimate of absolute harm, and for the level of 10 years CHD risk at which harm equals benefit, were generated by random bootstrap methodology [19]. For each trial simulated numbers of deaths were generated for both the placebo and intervention groups from binomial distributions with means taken from that of the observed values using the algorithm BNLDEV [20]. Different random values for the MAP in the LIPID study [10] were generated for each simulation using the algorithm GASDEV [20] with the sampling distribution mean and variance estimated from the MAPs of the remaining studies investigated. For each of 10000 simulated data sets a line of best fit was estimated by weighted least squares regression. The 95% confidence intervals for the intersections with the x and y axes were the ranges that encompassed all but the extreme 2.5% of the ranked intersections of the individual lines of best fit.
Results
Details of five placebo controlled clinical trials [1, 7–10] that met the criteria described, including the mean data used to estimate CHD risk by the method of Grover, are laid out in Table 1. The cholesterol levels in CARE [9] and AFCAPS [8] were lower than in the other studies because of differing inclusion criteria. Trials in patients with pre-existing CHD [1, 9, 10] had much higher annual CHD death rates (1.37% vs 0.24% per year) and greater absolute benefit from treatment on coronary mortality (0.38% vs 0.09% per year) when compared with primary prevention studies [7, 8]. The LIPID [10] and 4S [1] studies reported significant reductions in total mortality with treatment, and the reduction in total mortality observed in the WOSCOPS study [7] was borderline significant.
Table 1.
Demographic details of subjects included in the major intervention studies.
| 4S | WOSCOPS | CARE | AFCAPS/TEXCAPS | LIPID | |
|---|---|---|---|---|---|
| Primary or secondary | 2° | 1° | 2° | 1° | 2° |
| Number (active:placebo) | 2221:2223 | 3302:3293 | 2081:2078 | 3304:3301 | 4512:4502 |
| Drug | Simvastatin | Pravastatin | Pravastatin | Lovastatin | Pravastatin |
| Median duration (years) | 5.4 | 4.9 | 5.0 | 5.2 | 6.0 |
| Observed placebo CHD death rate† | 15.7 | 3.8 | 11.5 | 0.9 | 13.8 |
| Observed total mortality benefit† | 6.2 (CI 2.9, 9.4) | 1.8 (CI 0, 3.6) | 1.6 (CI −1.9, 5.0) | 0.2 (CI −1.6, 1.2) | 5.0 (CI 2.8, 7.3) |
| Mean age (years) | 58.5 | 55.2 | 59.0 | 58.3 | 62.3 |
| Proportion male (%) | 81.5 | 100 | 86 | 85 | 83 |
| Mean BP (mmHg) | 139/84 | 136/84 | 129/79 | 138/78 | * |
| % smokers | 25.5 | 44.0 | 21.0 | 12.5 | 10.0 |
| % diabetes | 4.5 | 1.0 | 14.5 | 2.5 | 9.0 |
| LDL (mmol l−1) | 4.87 | 4.96 | 3.59 | 3.89 | 3.88 |
| HDL (mmol l−1) | 1.18 | 1.14 | 1.01 | 0.95 | 0.93 |
| LDL/HDL ratio | 4.12 | 4.35 | 3.55 | 4.09 | 4.17 |
| Predicted CHD event rate† | 68.6 | 21.4 | 52.6 | 15.3 | 78.1 |
% over 10 years.
data not supplied.
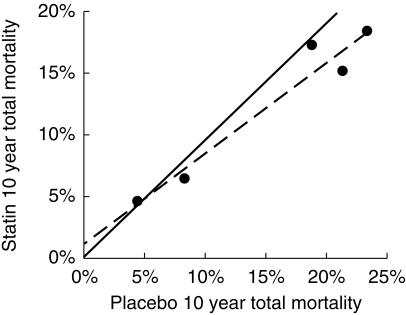
The L'Abbe plot of mortality rates in the intervention groups vs mortality in the placebo groups (Figure 4) showed a linear relation that was not parallel to the line of identity. This suggests that the magnitude of benefit from statin treatment varies with the underlying risk of the population studied. The two lines intersect at a level of placebo risk greater than zero, at a total mortality rate of 4.5% over 10 years, raising the possibility that treatment of those at very low risk of CHD with statins may cause more harm than benefit.
Figure 4.
The L'Abbe plot for the statin outcome trials. The line of best fit intersects with the line of identity at a 10 years death risk of 4.5%. This estimate may be biased by regression dilution (see text and [12]).
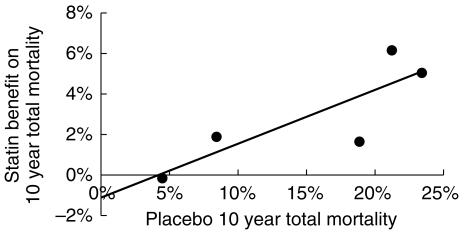
The plot of absolute net benefit (mortality reduction) against observed mortality in the placebo groups (Figure 5) was also consistent with the possibility of a small harmful effect of statin treatment in people at very low risk of death. The line of best fit suggests that treatment with statins might be of no benefit for those at 4.5% risk of CHD death over 10 years, a finding identical to that of the L'Abbe plot.
Figure 5.
Statin net mortality benefit plotted against placebo group mortality for the outcome trials. The line of best fit intersects the x-axis at a 10 years death risk of 4.5%. This estimate may be biased by regression dilution (see text and [13]).
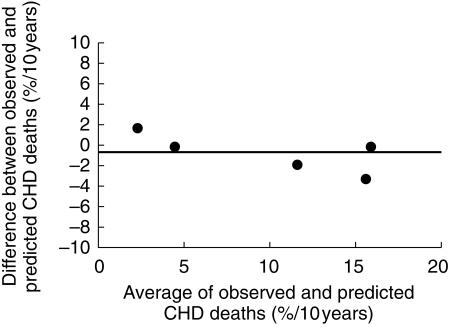
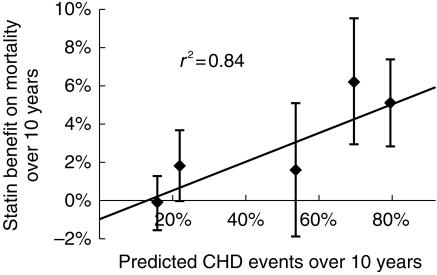
The Grover logistic regression equation provided an acceptable prediction of observed CHD mortality (Figure 6). If anything the equation tended to underestimate risk, particularly for trials in subjects at high risk of CHD death, although this trend was not statistically significant. Using the method suggested by Altman, the observed difference in annual mortality between placebo and intervention groups in the trials was regressed against the 10 years risk of CHD events for the trials estimated using the Grover equation (Figure 7). The line representing benefit from statin treatment intercepted the x-axis at a 10 year CHD event risk of 13%. This 10 years CHD risk (13%) is the best estimate of the risk level at which harm and benefit from statin treatment are balanced, so that a net benefit in overall mortality was seen when the underlying risk of a CHD event was ≥ 13% over 10 years. The 95% confidence interval (CI) for the estimate of CHD event risk associated with zero net benefit (13% over 10 years) was 0–26% over 10 years. The lower confidence interval indicates that statins may not cause harm even to subjects at no or negligible risk of CHD; the upper CI indicates that harm could possibly exceed benefit even when the estimated CHD risk is as great as 26% over 10 years.
Figure 6.
Bland-Altman plot of difference between observed placebo group CHD death rates and that predicted using the Grover equation against their mean. The model tends to underestimate risk especially when the risk of CHD death is high.
Figure 7.
Plot of statin net mortality benefit against predicted CHD event risk. The line of best fit intersects the x-axis at a 10 years CHD event risk of 13%. People at lower risk may not benefit, and might even suffer harm.
The intercept of the line of best fit for benefit from statin treatment with the y-axis is a measure of the possible effect of statins on noncoronary mortality. It can be seen from Figure 7 that statin treatment could increase non-CHD deaths by 1% over 10 years. However the confidence intervals around this estimate show that the intercept is not significantly different from zero, and indicate that statins could reduce noncoronary mortality by 0.6% over 10 years or increase it by as much as 2.6% over 10 years.
The fulcrum point at which the benefit of statin treatment in preventing CHD is balanced numerically by possible harm due to drug toxicity is remarkably consistent for the three methods of analysis examined. The L'Abbe plot (Figure 4) and the simple plot of benefit against placebo risk (Figure 5) both suggest a fulcrum at a pretreatment total mortality risk of 4.5% over 10 years. When this is multiplied by the mean ratio of CHD events to overall mortality observed in the trials, i.e. 2.84, this fulcrum point is equivalent to a CHD event risk of 13% over 10 years, precisely the same as that derived from the plot of benefit against predicted CHD event risk (Figure 7).
Discussion
The method of analysis proposed by Altman and used here to examine benefit and harm from statins is designed to avoid two important sources of error or confounding, namely regression dilution [13] and automatic correlation [14]. The method assumes a linear relationship between the change in overall mortality with statin treatment and underlying CHD risk. The consistency of relative risk reduction by statins across trials, and in subgroup analyses within trials, suggests that the relation between risk and benefit is indeed linear. A second requirement is that the Grover equation predicts CHD event risk accurately. It has been shown to predict the risk of CHD death in a variety of clinical trials [16], and predicted CHD deaths in the placebo groups of the statin outcome trials investigated here (Figure 6). Grover's model predicts CHD event risks (including nonfatal myocardial infarction) indirectly as a multiple of CHD deaths, and not directly, but this did not impair the validity of the Markov model in Grover's study [16] of the accuracy of the method for both CHD events and CHD deaths. Access to individual data may well have improved estimates of variability but none of the risk prediction tools has been validated in estimating individual risk.
In the method proposed by Altman the plot of mortality benefit from statin treatment against the predicted CHD event risk yielded a line of best fit that did not pass through the origin, but intersected the x-axis at a CHD event risk of 13% over 10 years, and the y-axis at a mortality benefit of −1% over 10 years. The intersect with the x-axis, at a CHD risk of 13% over 10 years, defines the best estimate of the CHD risk level at which benefit and harm from statins are equally balanced in terms of all-cause mortality. In clinical terms this level of risk would typically be seen in a male smoker aged 45 years with a systolic blood pressure of 145 mmHg, a total cholesterol of 5.7 mmol l−1 and an HDL of 1.1 mmol l−1. Treatment of people with a CHD risk lower than 13% over 10 years could do more harm than good. The position of the intersect does not prove that statins cause harm, because the lower 95% confidence interval for the best estimate embraces zero. This means that statins could be harmless even when prescribed to people with zero CHD risk. The important question is at what CHD risk do the trial data allow an assumption of safety beyond reasonable doubt. This is indicated by the upper 95% confidence interval for the intercept with the x-axis, which was at a CHD risk of 26% over 10 years. We can conclude from this analysis that benefit from statins will likely outweigh any harm when the pretreatment CHD risk is ≥26% over 10 years. This estimate seems very conservative. In WOSCOPS total mortality was reduced by 22%, and this approached significance in the primary analysis [7] and was significant after adjustment for baseline variables. The CHD risk of people in WOSCOPS averaged 15% over 10 years, and this suggests that the safety of statins is assured at a CHD risk of 15% over 10 years rather than the 26% CHD risk threshold from the present analysis. The intercept of the line of best fit with the y-axis, which was 1% over 10 years, provides a best estimate for harm from statins. Treatment of people with zero CHD risk could increase all-cause mortality by 1% over 10 years. However this does not prove harm from statins, as the lower 95% confidence interval for this intercept is consistent with no harm from statins even when CHD risk is extremely low.
Alternative methods for examining the balance between benefit and harm, the L'Abbe plot and the simple plot of observed benefit against observed risk, are both open to criticism on theoretical grounds, and are generally considered unsuitable for hypothesis testing [15]. In the event the findings with these methods were entirely consistent with the analysis proposed by Altman, which is theoretically sound and free of bias or error. The estimates of the point where benefit from statins might balance any harm as regards all-cause mortality were identical for the L'Abbe plot and the plot of observed benefit vs observed risk. Both methods suggested that benefit and harm were balanced when the pretreatment mortality risk was 4.5% over 10 years. People with a prognosis better than this could possibly be harmed by statin treatment. This estimate of pretreatment risk, 4.5% over 10 years, is precisely equivalent to a CHD event risk of 13% over 10 years, after appropriate adjustment for the ratio of CHD events:total deaths. In other words the findings from the two ‘flawed’ methods were identical to that with the theoretically sound method. This is perhaps coincidental but nevertheless surprising, and suggests that questions about the validity of the L'Abbe plot and the plot of benefit vs risk should perhaps be re-examined. It is possible that measurement error, which is the root cause of the problems with these methods, is negligible because of the large number of patients in the trials. It would be wrong to conclude that these simple methods are universally valid, especially when applied to smaller data sets. However their value should perhaps be examined further.
What are the practical implications of our analysis? It does not show that statins are inherently unsafe in people similar to those included in the outcome trials, but does remind us that their safety has still to be proven in people with very low CHD risk. This is important when considering extension of statin treatment for primary prevention to low levels of CHD risk, for example below 15% over 10 years [21]. Here the emphasis on safety and the impact on overall mortality are paramount because more than 40% of all adults could readily be treated for life in some populations [22]. This is also highly pertinent to those countries that have a very low population CHD risk in relation to standard risk factors, for example Far Eastern or Mediterranean countries. In these countries statin treatment may easily be directed at people who have high cholesterol but an extremely low absolute risk of CHD. A similar problem can also arise when treatment decisions are based on relative risk of CHD, or CHD risk projected to the age of 60 [23], rather than formal estimation of current absolute CHD risk. A high relative, projected or lifetime risk of CHD does not preclude a very low absolute risk of CHD in the short term, especially in women and young men. Any reduction in coronary disease by statin treatment could easily be outweighed by harm related to drug toxicity when such methods of risk assessment are used.
Extremely large trials will be required to demonstrate the safety of statins in terms of overall mortality in subjects at low CHD event risk. Using the assumptions of others who have called for further studies of the safety and efficacy of statins [24] it is estimated that a single trial in 80000 patients might be required, and there must be some doubt whether a trial of this size will ever be performed. Meantime the possibility of risk from statins should be taken into account when guidelines for their use in those at low risk of CHD are formulated. The present analysis, and the outcome of the WOSCOPS trial, suggest that the safety of statins is reasonably assured when the 10 years CHD event risk is ≥15%. Advice to treat at lower levels of CHD risk is advice that goes beyond current evidence for safety. The possibility of lack of benefit or even harm to people at low risk of CHD also underlines the need for accurate methods of formal risk assessment such as the Sheffield table [25], New Zealand chart [26] or Joint Societies chart [27] to estimate the pretreatment risk of CHD.
References
- 1.Scandinavian Simvastatin Survival Study Group. Randomised trial of cholesterol lowering in 4444 patients with coronary heart disease: the Scandinavian Simvastatin Survival Study (4S) Lancet. 1994. pp. 439–446. [PubMed]
- 2.Muldoon MF, Manuck SB, Matthews KA. Lowering cholesterol concentrations and mortality: a quantitative review of primary prevention trials. Br Med J. 1990;301:309–314. doi: 10.1136/bmj.301.6747.309. [DOI] [PMC free article] [PubMed] [Google Scholar]
- 3.The Lipid Research Clinics Coronary Prevention Trial results I. Reduction in coronary heart disease. JAMA. 1984;251:351–364. doi: 10.1001/jama.1984.03340270029025. [DOI] [PubMed] [Google Scholar]
- 4.Gould AL, Rossouw JE, Santanello NC, et al. Cholesterol reduction yields clinical benefit. A new look at old data. Circulation. 1995;91:2274–2282. doi: 10.1161/01.cir.91.8.2274. [DOI] [PubMed] [Google Scholar]
- 5.Davey Smith G, Pekkanen J. Should there be a moratorium on the use of cholesterol lowering drugs? Br Med J. 1992;304:431–434. doi: 10.1136/bmj.304.6824.431. [DOI] [PMC free article] [PubMed] [Google Scholar]
- 6.Law MR, Wald NJ. Commentary on the cholesterol papers. Disagreements are not substantial. Br Med J. 1994;308:1027–1029. doi: 10.1136/bmj.308.6935.1027. [DOI] [PMC free article] [PubMed] [Google Scholar]
- 7.Shepherd J, Cobbe SM, Ford I, et al. Prevention of coronary heart disease with pravastatin in men with hypercholesterolaemia. N Engl J Med. 1995;333:1301–1307. doi: 10.1056/NEJM199511163332001. [DOI] [PubMed] [Google Scholar]
- 8.Downs JR, Clearfield M, Weis S, et al. Primary prevention of acute coronary events with lovastatin in men and women with average cholesterol levels. JAMA. 1998;279:1615–1622. doi: 10.1001/jama.279.20.1615. [DOI] [PubMed] [Google Scholar]
- 9.Sacks FM, Pfeffer MA, Moye LA, et al. The effect of pravastatin on coronary events after myocardial infarction in patients with average cholesterol levels. N Engl J Med. 1996;335:1001–1009. doi: 10.1056/NEJM199610033351401. [DOI] [PubMed] [Google Scholar]
- 10.The Long-term Intervention with Pravastatin in Ischaemic Heart Disease (LIPID) Study Group. Prevention of cardiovascular events and death with pravastatin in patients with coronary heart disease and a broad range of initial cholesterol levels. N Engl J Med. 1998. pp. 1349–1357. [DOI] [PubMed]
- 11.Pignone M, Phillips C, Mulrow C. Use of lipid lowering drugs for primary prevention of coronary heart disease: meta-analysis of randomised trials. Br Med J. 2000;321:1–5. doi: 10.1136/bmj.321.7267.983. [DOI] [PMC free article] [PubMed] [Google Scholar]
- 12.Hoes AW, Grobbee DE, Lubsen J. Does drug treatment improve survival? Reconciling the trials in mild-to-moderate hypertension. J Hypertens. 1995;13:805–811. [PubMed] [Google Scholar]
- 13.Egger M, Davey Smith G. Risks and benefits of treating mild hypertension: a misleading meta-analysis? J Hypertens. 1995;13:813–815. doi: 10.1097/00004872-199507000-00014. [DOI] [PubMed] [Google Scholar]
- 14.Senn S. Response to: Importance of trends in the interpretation of an overall odds ratio in the meta-analysis of clinical trials. Stat Med. 1994;13:293–296. doi: 10.1002/sim.4780130310. [DOI] [PubMed] [Google Scholar]
- 15.Sharp SJ, Thompson SG, Altman DG. The relation between treatment benefit and underlying risk in meta-analysis. Br Med J. 1996;313:735–738. doi: 10.1136/bmj.313.7059.735. [DOI] [PMC free article] [PubMed] [Google Scholar]
- 16.Grover SA, Paquet S, Levinton C, Coupal L, Zowall H. Estimating the benefits of modifying risk factors of cardiovascular disease. Arch Intern Med. 1998;158:655–662. doi: 10.1001/archinte.158.6.655. [DOI] [PubMed] [Google Scholar]
- 17.Grover SA, Palmer CS, Coupal L. Serum lipid screening to identify high-risk individuals for coronary death. The results of the Lipid Research Clinics prevalence cohort. Arch Intern Med. 1994;154:679–684. [PubMed] [Google Scholar]
- 18.Armitage P, Berry G. Statistical Methods in Medical Research. 3. Oxford: Blackwell Scientific; 1994. [Google Scholar]
- 19.Efron B, Gong G. A leisurely look at the Bootstrap, the Jackknife, and Cross-Validation. Am Statistician. 1983;37:36–48. [Google Scholar]
- 20.Press WH, Flannery BP, Teukolsky SA, Vetterling WT. Random Numbers. Numerical Recipes: the Art of Scientific Computing. Cambridge: Cambridge Press; 1986. [Google Scholar]
- 21.Grundy SM. Management of high serum cholesterol and related disorders in patients at risk for coronary heart disease. Am J Med. 1997;102(2S) Suppl:15–22. doi: 10.1016/s0002-9343(97)00462-2. [DOI] [PubMed] [Google Scholar]
- 22.Haq IU, Ramsay LE, Wallis EJ, Isles CG, Ritchie LD, Jackson PR. Population implications of lipid lowering for primary prevention of coronary heart disease: data from 1995 Scottish Health Survey Heart. Heart. 1998;8(Suppl 1):28–28. doi: 10.1136/heart.86.3.289. [DOI] [PMC free article] [PubMed] [Google Scholar]
- 23.Wood D, De Backer G, Faergeman O, Graham I, Mancia G, Pyorala K. Prevention of coronary heart disease in clinical practice. Summary of Recommendations of the Second Joint Task Force of European and Other Societies on Coronary Prevention. Blood Press. 7:262–269. doi: 10.1080/080370598437105. [DOI] [PubMed] [Google Scholar]
- 24.Collins R, Keech A, Peto R, et al. Cholesterol and total mortality: need for larger trials. Br Med J. 1992;304:1689. doi: 10.1136/bmj.304.6843.1689. [DOI] [PMC free article] [PubMed] [Google Scholar]
- 25.Ul Haq I, Ramsay LE, Pickin DM, Yeo WW, Jackson PR, Payne JN. Lipid-lowering for prevention of coronary heart disease: what policy now? Clin Sci. 1996;91:399–413. doi: 10.1042/cs0910399. [DOI] [PubMed] [Google Scholar]
- 26.Dyslipidaemia Advisory Group. National Heart Foundation clinical guidelines for the assessment and management of dyslipidaemia. NZ Med J. 1996. pp. 224–232. [PubMed]
- 27.Durrington PN, McInnes G, Poulter N, Rees A, Wood D, Wray R. Joint British Recommendations on Prevention of Coronary Heart Disease in Clinical Practice. Heart. 1998;80(Suppl 2):S1–S29. [PMC free article] [PubMed] [Google Scholar]


