

Abstract
Background and purpose:
At present there are few data regarding the rate and extent of brain–blood partitioning of the opioid active metabolite of morphine, morphine-6-glucuronide (M6G). In this study the cerebral kinetics of M6G were determined, after a short-term intravenous infusion, in chronically instrumented conscious sheep.
Experimental approach:
Five sheep received an intravenous infusion of M6G 2.2 mg kg-1 over a four-minute period. Non-linear mixed-effects analysis, with hybrid physiologically based kinetic models, was used to estimate cerebral kinetics from the arterio-sagittal sinus concentration gradients and cerebral blood flow measurements.
Key results:
A membrane limited model was selected as the final model. The blood-brain equilibration of M6G was relatively slow (time to reach 50% equilibration of the deep compartment 5.8 min), with low membrane permeability (PS, population mean, 2.5 ml min-1) from the initial compartment (V1, 13.7 ml) to a small deep distribution volume (V2) of 18.4 ml. There was some between-animal variability (%CV) in the initial distribution volume (29%), but this was not identified for PS or V2.
Conclusion and Implications:
Pharmacokinetic modelling of M6G showed a delayed equilibration between brain and blood of a nature that is primarily limited by permeability across the blood-brain-barrier, in accordance with its physico-chemical properties.
Keywords: M6G (morphine-6-glucuronide), pharmacokinetics, drug distribution, blood–brain barrier, cerebral blood flow, sheep physiological model
Introduction
Morphine is still, 200 years after its first isolation from opium, considered the gold standard in pain treatment. Morphine is characterized by its long onset of effect (30 min) and moderate duration of action (4–6 h). The cerebral kinetics of morphine have recently been investigated in sheep and found to be characterized by a significant membrane limitation and slow cerebral equilibration (Upton et al., 2003).
The clinical use of morphine is complicated by the presence of the active metabolite morphine-6-glucuronide (M6G). The potency of M6G compared to morphine and its contribution to analgesia following morphine administration have been debated for more than two decades. At present the analgesic equipotency ratio after acute administration of M6G, at doses associated with few side effects, is considered to be 1:3–4, whereas the potency ratio after chronic administration remains to be established (Peat et al., 1991; Thomson et al., 1995; Cann et al., 2002; Romberg et al., 2003, 2004; Skarke et al., 2003; Kilpatrick and Smith, 2005).
For many opioids there is a time delay in effect with regard to maximum plasma concentration. For morphine and other opioids and anaesthetics, it has been proposed that this delay in effect is similar in magnitude to the time required for equilibration of blood and central nervous system (CNS) concentrations (Upton et al., 1997b). This delay in effect can also be the result of drug distribution within brain tissue or rate limiting mechanisms at the receptor level (Bouw et al., 2001). The delay in cerebral equilibration may imply that the cerebral kinetics of an opioid becomes an important factor in determining the optimal opioid for clinical use. For example, an opioid used for treating acute or breakthrough pain should possess a rapid time to onset of effect, while in the treatment of chronic pain a longer duration of action is advantageous.
In human studies, it has been shown that the ratio of plasma volume to total volume of M6G is approximately five times higher than the ratio for morphine. M6G has a 6–15 times lower volume of distribution at steady-state and 5–15 times lower clearance (Hanna et al., 1991; Lötsch et al., 1998). The physico-chemical properties of M6G (log DpH 7.4 −0.8 at 25°C (Avdeef, 1996) and approximately 0 at 37°C (Van Crugten et al., 1991)) indicate that it should not readily penetrate the blood–brain barrier (BBB). However, studies in rats and humans show that M6G penetrates the BBB and is distributed in various regions of the brain such as the cortex, brain extracellular fluid (ECF), and cerebrospinal fluid (CSF) (Shimomura et al., 1971; Chapman, 1990; Hanna et al., 1990; Frances et al., 1992; Aasmundstad et al., 1995; Bickel et al., 1996; Wu et al., 1997; Stain-Texier et al., 1999; Bouw et al., 2001; Lötsch et al., 2002; Tunblad et al., 2005).
Shimomura et al. (1971) showed that after an intraperitoneal injection of M6G in rats only conjugated morphine was detected in the brain, which suggests that M6G penetrates into the brain unchanged and is not converted to free morphine (Shimomura et al., 1971). In an isolated, perfused brain preparation, it was shown that the uptake of M6G, after an intravenous bolus injection, was (unidirectional and) low compared to that of morphine (Bickel et al., 1996; Wu et al., 1997). Using microdialysis, Bouw et al. (2001) showed that half of the duration between administration of M6G and its antinociceptive effect is due to transport across the BBB. Also Aasmundstad et al. (1995) and Stain-Texier et al. (1999) have used the microdialysis method to show that M6G penetrates into the brain after systemic administration and once in the brain M6G almost exclusively accumulates in the extracellular space. While these studies have provided important insights into the cerebral kinetics and dynamics of M6G, the data are often difficult to equate quantitatively to clinical practice, where M6G has shown promise as a post-operative analgesic when administered either intravenously or subcutaneously (Hanna et al., 2005; van Dorp et al., 2006). We have previously used a sheep preparation to examine the cerebral kinetics and dynamics of drugs used in the peri-operative period (Upton et al., 1997a, 2003). Physiological pharmacokinetic-pharmacodynamic models developed in sheep have been adapted to assess the clinical behaviour of these drugs in man (Upton and Ludbrook, 2005). Hence, the aim of this study was to determine the cerebral kinetics of M6G, after a short intravenous infusion, in chronically instrumented, conscious sheep.
Methods
Animal preparation
Sheep were chosen as an experimental animal as the relative perfusion of their brain and the control of cerebral blood flow (CBF) are similar to that in humans (Upton et al., 1994; Doolette et al., 1999). All experimental procedures were approved by the Animal Ethics Committee at the University of Adelaide and were conducted in accordance with the Australian Code of Practice for the Care and Use of Animals for Scientific Purposes. The surgical procedures for preparing the sheep and the details about the experiment have been described previously (Upton et al., 1994, 1997a). Briefly, female Merino sheep of similar age and body mass (mean weight 44.3±5.0 kg) were used. Instrumentation was performed under general anaesthesia. Catheters were chronically implanted with their tips in the abdominal aorta (for sampling of arterial blood), in the right atrium (for drug administration and measurement of cardiac output (CO)), and in the dorsal sagittal sinus (for cerebral venous blood sampling) (Doolette et al., 1999). A Doppler transducer was placed over the sagittal sinus using a previously validated method to quantify the relative changes in CBF (Upton et al., 1994; Doolette et al., 1999). After recovery from anaesthesia, the sheep were housed in floor pens for a least a day before the study and their catheters maintained with a saline/heparin lock (0.9%/50 IU ml−1).
Study design
On different study days 5 sheep received an intravenous infusion of M6G 2.2 mg kg−1 over a 4-min period. On the day of the study the instrumented sheep was placed in a non-weight-bearing sling inside a metabolic crate and prepared for physiological measurements and blood sampling. After 5 min of baseline measurements, the infusion was commenced at time zero. M6G dihydrate (CeNeS Limited, Cambridge, UK) 4 mg ml−1 was prepared in 0.9% isotonic saline by a pharmacist on the same day the study was performed. Infusion rate was adjusted according to the weight of each sheep. The procedures below were performed during each study.
Blood sampling
Before drug infusion, blank blood was obtained for use in the calibration curves for the quantification of M6G. Simultaneous blood samples of 2 ml volume were collected from the arterial and sagittal sinus catheters at 0.5, 1, 1.5, 2, 3, 4, 4.5, 5, 5.5, 6, 8, 10, 15, 20, 30, 45, 60 and 75 min after start of infusion. The blood samples were collected in 10 ml tubes with heparin as an anticoagulant. After the study the blood was centrifuged at 3250 r.p.m. for 10 min and plasma was separated. The blood samples were stored at room temperature for <90 min before separation of plasma. The plasma samples were stored at −20°C until analysis.
Blood gas, cardiac output and CBF measurements
The CBF index was continuously monitored using a computerized data acquisition system. The relative changes were quantified using Doppler flow probe and a flow meter (Bioengineering, University of Iowa, IA, USA). The recording of the parameter was commenced 5 min before drug infusion (baseline) and throughout the study period.
CO was measured in triplicate immediately before the drug infusion, and at 4, 10, 30 and 60 min after the start of the infusion, using a thermodilution method (Runciman et al., 1984). The values were averaged to obtain the mean at each time point. Additional arterial blood samples were taken at 0, 4, 10 and 30 min for blood gas measurements (ABL System 625, Radiometer, Sweden).
High-performance liquid chromatography and assay validation
Plasma samples containing M6G were assayed using a validated high-performance liquid chromatography (HPLC) assay. All assays were calibrated using eight-point standard curves prepared in plasma separated from blood taken from the same animal before drug administration. As a validation procedure, inter-assay variability was monitored with quality controls (QC) before assaying the plasma samples.
The chromatography conditions for the quantification of M6G were adapted from a previous method by Milne et al. (1991), which described the quantification of M6G in plasma. Analysis was performed with a Shimadzu (Kyoto, Japan) HPLC system equipped with LC-10AS pump, a SCL-10A VP system controller, SPD-10A VP UV–Vis detector, SIL-10A auto injector, and a Nova-Pak 4 μ C18 5 × 100 mm column with a Waters radial compression module (Waters Assoc., Lane Cove, Australia). The mobile phase (1 l) comprised 25% acetonitrile, 0.01 M NaH2PO4 and 230 mg l−1 lauryl sulphate (sodium salt), adjusted to pH 2.6 with 85% orthophosphoric acid.
M6G plasma samples were processed using solid phase extraction using Sep-Pak C18 cartridges (Waters Assoc., Lane Cove, Australia). Briefly, in 10 ml flat bottom plastic tubes 1 ml of plasma and 70 μl of hydromorphone HCL (internal standard) were made alkaline with 3 ml of 500 mM bicarbonate buffer pH 9.3. The tubes were vortexed briefly. The cartridges were conditioned by 10 ml of methanol filtered under vacuum followed by 10 ml Milli-Q water. The plasma samples were filtered at maximum rate of 1.5 ml min−1 through the cartridges, which was subsequently washed with 20 ml of 5 mM bicarbonate buffer pH 9.3 at rate of 1.5 ml min−1 followed by 1 ml of Milli-Q water at one drop per second until the cartridges were dry. This step was repeated. Finally, 200 μl was transferred to an auto injector vial and 100 μl was injected in the HPLC system. Blank plasma samples containing standards (0.25–25 μg ml−1, n=8 standards), and QC were included in each run to monitor assay performance and were prepared in duplicate at two different concentrations: low (LQC, 1.0 μg ml−1) and high (HQC, 10 μg ml−1). The extraction recovery was 96.8±7.6% for M6G (n=5) and 96.8±4.0% for the internal standard (n=4).
Over six assay days, the mean r2 value was 0.998±0.003 (n=6), while inter-assay accuracy and precision (mean±s.d.) were 99.3±12.5% (LQC) and 96.5±9.6% (HQC). Similarly, intra-assay (n=6 replicate samples) accuracy and precision were 99.1±7.4 (LQC) and 105.8±6.6 (HQC). The assay was both precise and accurate at the limit of quantification (0.25 μg ml−1) with inter-assay accuracy and precision being 98.8±7.6% (n=8).
Pharmacokinetic analysis
In general terms, a hybrid modelling of kinetics was employed. Empirical forcing functions were used to represent inputs into the brain, and curve fitting of the output of the brain to physiological realistic models used to determine model parameters. The cerebral kinetics of M6G were defined using a non-linear mixed effect approach using NONMEM (version V, level 1.1) with linear interpolation of arterial and CBF inputs for individual sheep, and the conditional first-order approximation (FOCE) with interaction analysis. Structural parameters were assigned a log–normal distribution across the population, and a combined additive and proportional residual error models were also tested. Model comparisons were made using the objective function returned by NONMEM with the log-likelihood ratio test, and standard diagnostic plots.
Three different physiologically based kinetic models of the brain were fitted to the sagittal sinus M6G concentrations obtained. The basic forms of the equations describing these models have been published previously (Huang et al., 1998; Upton et al., 2003). They are repeated below for convenience. Cin and Cout are the afferent arterial and efferent sagittal sinus drug concentrations of the brain, respectively, and QCBF is CBF (Figure 1):
A single flow-limited compartment defined by a single distribution volume and CBF:

A single flow-limited compartment with an apparent first-order loss (PSloss) representing either deep distribution or metabolism:

A two-compartment membrane-limited model with a permeability term (PS) representing distribution into a deep compartment:
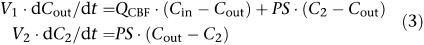
Figure 1.

Graphical representation of kinetic models: (a) flow limited model (Equation 1), (b) single flow-limited compartment with an apparent first order loss of drug (Equation 2), and (c) a two-compartment membrane limited model with a permeability term describing distribution into a deep compartment (Equation 3).
where V1 is the volume of the first compartment of the brain (which includes blood), and V2 and C2 are the volume of, and concentration in, the second compartment of the brain (if appropriate). The permeability-surface area coefficient (PS) is a term describing loss or exchange of drug from the first compartment. In the case of Equation (2), PS represents a unidirectional loss of drug, such as metabolism or deep distribution, which is essentially irreversible. In the case of Equation (3), PS represents the effective inter-compartmental clearance of drug between the two compartments.
Calculated variables
Model parameters were used to calculate secondary variables to facilitate comparison with values reported in the literature for other opioids. Brain equilibration times for M6G were calculated by using the final cerebral kinetic model and parameter values to simulate the time course of the brain concentrations for a step increase in the afferent arterial blood concentration from 0 to 1. The time required for the blood (compartment 1) and brain (compartment 2) concentration to reach 50 and 95% of the arterial blood concentration were calculated.
The apparent permeability of the BBB (PS) was compared with the typical CBF in a sheep (40 ml min−1) (Doolette et al., 1999). The apparent brain:plasma partition coefficient was calculated from V2 and a nominal real volume of 63 ml for the region of the brain drained by the sagittal-sinus catheter (70% of 90 ml, whole brain) (Doolette et al., 1999).
Drug retention (R%) in the brain was calculated as follows:
where the total arterial (AUCart) and sagittal sinus (AUCsag) area under the blood concentration–time curves to 75 min were calculated using the trapezoidal rule. The drug retention indicates the amount of drug that had entered the brain via the arterial blood, but had not left the brain via the efferent venous blood by the end of the period of interest. Retention in the brain could be the result of metabolism or deep distribution from which efflux is relatively slow.
Statistical analysis
GraphPad Prism (GraphPad Software version 4.02. for Windows, GraphPad Software, San Diego, CA, USA) was used for all statistical analyses. In the case of CBF, which was continuously measured at 1 s intervals, a 10 s moving average from each individual animal was calculated at each of the pharmacokinetic blood sampling time points. Cardiac output (CO) and relative changes from baseline (100%) in CBF were calculated as mean and 95% confidence intervals (CI). Statistically significant changes from baseline were tested using one-way repeated measures ANOVA with Bonferroni's Multiple Comparison Test with time as the repeated measure. A α-value of 0.05 was set for statistically significant differences. All data are presented as mean±s.d. or mean (95% CI).
Results
In individual animals both CBF and CO showed some changes from baseline during M6G infusion. However, no statistically significant time-effect could be demonstrated (P=0.93 for CBF, P=0.22 for CO).
Pharmacokinetic data
Figure 2 shows the mean observed plasma concentrations of M6G. Only a very small amount of M6G was extracted across the brain. The mean (95% CI) peak arterial concentration of M6G was 33.4 μg ml−1 (18.4–48.4 μg ml−1) at 4 min, while sagittal sinus Cmax was 30. 9 μg ml−1 (17.8–44.0 μg ml−1) at 4 min. Maximal concentration gradient of M6G across the brain was during the early infusion period at 1 min.
Figure 2.

The sagittal-sinus plasma concentrations (open circles) of M6G obtained from five sheep. Data are shown as mean at each time point. Dotted lines are 95% CI, the solid thin line is the fitted sagittal-sinus concentrations, while the solid thick line represents simulated concentrations in the deep brain tissue compartment.
Initial analyses indicated that the data were heteroscedastic, and that an additive error model was not supported. Furthermore, while between-animal variability was identified for the initial distribution volume (V1), this was not the case for V2 or PS. As a consequence, inter-animal variability was removed from these parameters (without a decrease in model fit) and a proportional error model only was employed to obtain the most parsimonious model. The results of the kinetic modelling are summarized in Table 1. R% of M6G in the brain was minimal (9.8% after 75 min).
Table 1.
Model parameter estimates for brain kinetics of M6G in 5 sheep
| Model | V1 (ml) | PS (ml/min) | V2 (ml) | Residual error (% CV) |
|---|---|---|---|---|
| Flow-limited | ||||
| Parameter value | 14.5 (26%) | — | — | 35 (14%) |
| Inter-animal variability (%CV) | 29 (93%) | — | — | |
| Flow-limited with lossa | ||||
| Parameter value | 14.5 | 2.2 × 10⁻⁹ | — | 35 |
| Inter-animal variability (%CV) | 29 | — | — | |
| Membrane-limited | ||||
| Parameter value | 13.7 (27%) | 2.5 (85%) | 18.4 (50%) | 35 (14%) |
| Inter-animal variability (%CV) | 29 (90%) | — | — |
Data are the value of the population estimate, with data in parentheses indicating the % s.e. of the parameter estimate indicating the reliability of the parameter estimate.
Covariance step failed and % SE of parameter estimates are not available.
The flow-limited model adequately described the data with a population average (value (% s.e. of estimate)) distribution volume of 14.5 (26%) ml with between-animal variability (%CV) 29 (93%)%, and residual unexplained variability of 35 (14%)%. Addition of an irreversible loss (at least over the time-frame of the study) in the flow-limited with loss model was not supported by the data. This model collapsed into a flow-limited model as the loss term (PS) was estimated to be very small (<1 × 10⁻⁶ ml min−1), while all other model parameters were identical to the flow-limited model. In contrast, the membrane-limited model identified low permeability (PS=2.5 (85%) ml min−1) from the V1 (13.7 (27%) ml) compartment into a deep tissue compartment (V2 18.4 (50%) ml). Between-animal variability in V1 was 29 (90%)%, and residual unexplained variability was 35 (14%)%. Although the membrane-limited model did not afford a statistical improvement in model fit (P>0.5), this was still selected as the most appropriate model, based upon the known pharmacology/physiology of M6G entry into the brain tissue, and the approximate 10% retention of M6G in the brain at 75 min which would not be the case for a flow-limited model with a volume of 15 ml and a CBF of 40 ml min−1.
The times to reach 50 and 95% equilibration of the first compartment after M6G administration were 0.3 and 2.5 min, respectively. For the deep compartment, the times were 5.8 and 23.9 min, respectively. Assuming a nominal real volume of the region of the brain drained by the sagittal sinus catheter of 63 ml, the volume of the deep compartment equates to a brain:plasma partition coefficient of approximately 0.3.
Discussion
Cerebral pharmacokinetic data
A membrane-limited model was considered to be the most appropriate model to describe the cerebral kinetics of M6G in sheep. Morphine has previously been studied using the same model (Upton et al., 2003) and it was demonstrated that the membrane-limited model best described morphine. Comparing the two opioids using the numbers from Upton et al. (2003), the permeability of M6G across the BBB was relatively low (2.5 versus 7.4 ml min−1), as was its cerebral distribution volume (18.4 versus 92.4 ml). This is in agreement with results by others, who also found a lower rate of penetration into the brain for M6G compared to morphine in both animals and humans (Frances et al., 1992; Björkman et al., 1995; Bickel et al., 1996; Wu et al., 1997; Stain-Texier et al., 1999; Bouw et al., 2001; Meineke et al., 2002). The threefold lower permeability is further in agreement with the findings from human studies showing a reduced M6G potency relative to morphine by about a factor of 4 (Skarke et al., 2003).
The relatively slow permeation of M6G through the BBB was followed by a short time to 50% equilibration of the deep compartment (5.8 min) in comparison with morphine (10.3 min) (Upton et al., 2003). Similar results were found by Stain-Texier et al. (1999) using a microdialysis technique; they found time to maximum concentration in the cortex and whole brain to be only 15 min in rats. In addition, Björkman et al. (1995) showed that rapid and extensive brain uptake occurs within the first 5 min after intravenous administration of morphine, M3G and M6G in pigs. However, the ke0 s for onset/offset of morphine effect estimated by Sarton et al. (2003) and for M6G effect estimated by Romberg et al. (2004) contrasts with the above findings and indicates that a very large part of the delay in analgesic effect is not related to passage across the BBB. This has also have been suggested by Bouw et al. (2001), but in relation to neuronal dynamics. In the present model, the brain tissue is a ‘lumped' compartment. The various subregions of the brain such as ECF and CFS in which opioid receptors may vary in density are beyond the scope of the present work, as the methods used assess the global brain concentrations of the drug and therefore comparisons to results obtained from microdialysis techniques are not possible.
The sheep preparation employed is arguably more representative of human cerebral kinetics than other species, such as rodents, due to a similar CBF g−1 tissue to humans (sheep 0.44 ml min−1 per g brain (Upton et al., 1997a), humans 0.54 ml min−1 per g brain). In contrast, rodents have CBF g−1 tissue several-fold greater. As a consequence identification of a membrane limitation to brain entry will be markedly over-represented in small rodents as drug delivery to the brain is very high compared to a (presumably) similar permeability per gram tissue. As cerebral kinetics depends on the fundamental physiological properties of the brain and its relative blood flow, an animal model that has similar cerebral physiology to humans is an advantage.
Intravenous administration of morphine has been shown to induce analgesia faster than M6G in both animal (Milne et al., 1993; Illum et al., 1996) and human studies (Hanna et al., 1991; Osborne et al., 1992; Penson et al., 2002). However, the duration of the antinociceptive effects of M6G seems to be longer (Gardmark and Hammarlund-Udenaes, 1998) and it has been suggested that this longer duration of effect of M6G might partly be explained by its slower passage into and out of the brain compartment (Frances et al., 1992). Bouw et al. (2001) concluded from the results of their study that half of the delay in the effect of M6G can be explained by transport across the BBB, and suggested that the other half is due to drug distribution within brain tissue or rate limiting mechanisms at the receptor level. In the present study, the antinociceptive effect of M6G was not determined; however, the low permeablity coefficient found supports the slower onset of analgesia found by others.
Conclusion
The pharmacokinetic modelling of M6G showed a delayed equilibration between brain and blood of a nature that is primarily limited by permeability across the BBB, in accordance with its physico-chemical properties.
Acknowledgments
We thank Daniel Barratt for assistance with the M6G assays. M6G was kindly provided by CeNeS Limited, Cambridge, UK.
Abbreviations
- AUCart
Total arterial area under the blood concentration-time curves
- AUCsag
total sagittal sinus area under the blood concentration-time curves
- BBB
blood–brain barrier
- C2
concentration of the second compartment of the brain
- Cin
afferent arterial drug concentrations of the brain
- Cout
efferent sagittal sinus drug concentrations of the brain
- CBF
cerebral blood flow
- CI
confidence intervals
- CNS
central nervous system
- CO
cardiac output
- CSF
cerebrospinal fluid
- ECF
extracellular fluid
- HPLC
high-performance liquid chromatography
- M6G
morphine-6-glucuronide
- PS
a term describing loss or exchange of drug from the first compartment
- QC
quality controls
- QCBF
cerebral blood flow
- R%
drug retention
- V1
volume of the first compartment of the brain (which includes blood)
- V2
volume of the second compartment of the brain
Conflict of interest
The authors state no conflict of interest.
References
- Aasmundstad TA, Mørland J, Paulsen RE. Distribution of morphine 6-glucuronide and morphine across the blood–brain barrier in awake, freely moving rats investigated by in vivo microdialysis sampling. J Pharmacol Exp Ther. 1995;275:435–441. [PubMed] [Google Scholar]
- Avdeef A. Octanol-, chloroform-, and propylene glycol dipelargonat-water partitioning of morphine-6-glucuronide and other related opiates. J Med Chem. 1996;39:4377–4381. doi: 10.1021/jm960073m. [DOI] [PubMed] [Google Scholar]
- Bickel U, Schumacher OP, Kang Y-S, Voigt K. Poor permeability of morphine-3-glucuronide and morphine-6-glucuronide through the blood–brain barrier in the rat. J Pharmacol Exp Ther. 1996;278:107–113. [PubMed] [Google Scholar]
- Björkman S, Åkeson J, Helfer M, Fyge Å, Gustafsson LL. Cerebral uptake of morphine in the pig calculated from arterio-venous plasma concentration gradients: an alternative to tissue microdialysis. Life Sci. 1995;57:2335–2345. doi: 10.1016/0024-3205(95)02228-b. [DOI] [PubMed] [Google Scholar]
- Bouw MR, Xie R, Tunblad K, Hammarlund-Udenaes M. Blood–brain barrier transport and brain distribution of morphine-6-glucuronide in relation to the antinociceptive effect in rats – pharmacokinetic/pharmacodynamic modelling. Br J Pharmacol. 2001;134:1796–1804. doi: 10.1038/sj.bjp.0704406. [DOI] [PMC free article] [PubMed] [Google Scholar]
- Cann C, Curran J, Milner T, Ho B. Unwanted effects of morphine-6-glucoronide and morphine. Anaestesia. 2002;57:1200–1203. doi: 10.1046/j.1365-2044.2002.02624_2.x. [DOI] [PubMed] [Google Scholar]
- Chapman DJ. Analysis and pharmacokinetics of morphine and morphine-6-glucuronide 1990University of Surrey, UK; PhD Thesis [Google Scholar]
- Doolette DJ, Upton RN, Grant C. Agreement between ultrasonic doppler venous outflow and Kety and Schmidt estimates of cerebral blood flow. Clin Exp Pharmacol Physiol. 1999;26:736–740. doi: 10.1046/j.1440-1681.1999.03109.x. [DOI] [PubMed] [Google Scholar]
- Frances B, Gout R, Monsarrat B, Cros J, Zajac J-M. Further evidence that morphine-6β-glucuronide is a more potent opioid agonist than morphine. J Pharmacol Exp Ther. 1992;262:25–31. [PubMed] [Google Scholar]
- Gardmark M, Hammarlund-Udenaes M. Delayed antinociceptive effect following morphine-6-glucuronide administration in the rat – pharmacokinetic/pharmacodynamic modelling. Pain. 1998;74:287–296. doi: 10.1016/s0304-3959(97)00180-2. [DOI] [PubMed] [Google Scholar]
- Hanna MH, Peat SJ, Woodham M, Knibb A, Fung C. Analgesic efficacy and CSF pharmacokinetics of intrathecal morphine-6-glucuronide: comparison with morphine. Br J Anaesth. 1990;64:547–550. doi: 10.1093/bja/64.5.547. [DOI] [PubMed] [Google Scholar]
- Hanna MH, Peat SJ, Knibb AA, Fung C. Disposition of morphine-6-glucuronideand morphine in healthy volunteers. Br J Anaesth. 1991;66:103–107. doi: 10.1093/bja/66.1.103. [DOI] [PubMed] [Google Scholar]
- Hanna MH, Elliott KM, Fung M. Randomized, double-blind study of the analgesic efficacy of morphine-6-glucuronide versus morphine sulfate for postoperative pain in major surgery. Anesthesiology. 2005;102:815–821. doi: 10.1097/00000542-200504000-00018. [DOI] [PubMed] [Google Scholar]
- Huang YF, Upton RN, Zheng D, Mclean C, Gray EC, Grant C. The enantiomer-specific kinetics and dynamics of verapamil after rapid intravenous administration to sheep: physiological analysis and modeling. J Pharmacol Exp Ther. 1998;284:1048–1057. [PubMed] [Google Scholar]
- Illum L, Davis SS, Pawula M, Fisher AN, Barrett DA, Farraj NF, et al. Nasal administration of morphine-6-glucuronide in sheep – a pharmacokinetic study. Biopharm Drug Dispos. 1996;17:717–724. doi: 10.1002/(SICI)1099-081X(199611)17:8<717::AID-BDD985>3.0.CO;2-I. [DOI] [PubMed] [Google Scholar]
- Kilpatrick GJ, Smith TW. Morphine-6-glucuronide: actions and mechanisms. Med Res Rev. 2005;25:521–544. doi: 10.1002/med.20035. [DOI] [PubMed] [Google Scholar]
- Lötsch J, Schmidt R, Vetter G, Schmidt H, Niederberger E, Geisslinger G, et al. Increased CNS uptake and enhanced antinociception of morphine-6-glucuronide in rats after inhibition of P-glycoprotein. J Neurochem. 2002;83:241–248. doi: 10.1046/j.1471-4159.2002.01177.x. [DOI] [PubMed] [Google Scholar]
- Lötsch J, Weiss M, Kobal G, Geisslinger G. Pharmacokinetics of morphine-6-glucuronide and its formation from morphine after intravenous administration. Clin Pharmacol Ther. 1998;63:629–639. doi: 10.1016/S0009-9236(98)90086-8. [DOI] [PubMed] [Google Scholar]
- Meineke I, Fudenthar S, Hofmann U, Schaeffeler E, Mikus G, Schwab M, et al. Pharmacokinetic modelling of morphine, morphine-3-glucuronide and morphine-6-glucuronide in plasma and cerebrospinal fluid of neurosurgical patients after short-term infusion of morphine. Br J Clin Pharmacol. 2002;54:592–603. doi: 10.1046/j.1365-2125.2002.t01-1-01689.x. [DOI] [PubMed] [Google Scholar]
- Milne RW, Nation RL, Reynolds GD, Somogyi AA, Van Crugten JT. High-performance liquid chromatographic determination of morphine and its 3- and 6-glucuronide metabolites: improvements to the method and application to stability studies. J Chromatograph. 1991;565:457–464. doi: 10.1016/0378-4347(91)80410-e. [DOI] [PubMed] [Google Scholar]
- Milne RW, Sloan DA, McLean CF, Mather LE, Nation RL, Runciman WB, et al. Disposition of morphine and its 3- and 6-glucuronide metabolites during morphine infusion in the sheep. Drug Metab Dispos. 1993;21:1151–1156. [PubMed] [Google Scholar]
- Osborne R, Thompson P, Joel S, Trew D, Patel SS, levin M. The analgesic activity of morphine-6-glucuronide. Br J Pharmacol. 1992;34:130–138. doi: 10.1111/j.1365-2125.1992.tb04121.x. [DOI] [PMC free article] [PubMed] [Google Scholar]
- Peat SJ, Hanna MH, Woodham M, Knibb A, Ponte J. Morphine-6-glucuronide: effects on ventilation in normal volunteers. Pain. 1991;45:101–104. doi: 10.1016/0304-3959(91)90170-3. [DOI] [PubMed] [Google Scholar]
- Penson RT, Joel SP, Roberts M, Gloyne A, Beckwith S, Slevin ML. The bioavailability and pharmacokinetics of subcutaneous, nebulized and oral morphine-6-glucuronide. Br J Clin Pharmacol. 2002;53:347–354. doi: 10.1046/j.1365-2125.2002.01554.x. [DOI] [PMC free article] [PubMed] [Google Scholar]
- Romberg R, Olofsen E, Sarton E, den Harting J, Taschner PEM, Dahan A. Pharmacokinetic-pharmacodynamic modeling of morphine-6-glucuronide-induced analgesia in healthy volunteers. Anesthesiology. 2004;100:120–133. doi: 10.1097/00000542-200401000-00021. [DOI] [PubMed] [Google Scholar]
- Romberg R, Olofsen E, Sarton E, Teppema L, Dahan A. Pharmacodynamic effect of morphine-6-glucuronide versus morphine on hypoxic and hypercapnic breathing in healthy volunteers. Anesthesiology. 2003;99:788–798. doi: 10.1097/00000542-200310000-00008. [DOI] [PubMed] [Google Scholar]
- Runciman WB, Ilsley AH, Mather LE, Carapetis R, Rao MM. A sheep preparation for studying interactions between blood flow and drug disposition. I: Physiological profile. Br J Anaesth. 1984;56:1015–1028. doi: 10.1093/bja/56.9.1015. [DOI] [PubMed] [Google Scholar]
- Sarton E, Olofsen E, Romberg R, den Harting J, Kest B, Nieuwenhuijs D, et al. Sex differences in morphine analgesia. Anesthesiology. 2003;93:1245–1254. doi: 10.1097/00000542-200011000-00018. [DOI] [PubMed] [Google Scholar]
- Shimomura K, Kamata O, Ueki S, Ida S, Oguri K, Yoshimura H, et al. Analgesic effect of morphine glucuronides. Tohoku J Exp Med. 1971;105:45–52. doi: 10.1620/tjem.105.45. [DOI] [PubMed] [Google Scholar]
- Skarke C, Darimont J, Schmidt H, Geisslinger G, Lötsch J. Analgesic effects of morphine and morphine-6-glucuronide in an transcutaneous electric pain model in healthy volunteers. Clin Pharmacol Ther. 2003;73:107–121. doi: 10.1067/mcp.2003.5. [DOI] [PubMed] [Google Scholar]
- Stain-Texier F, Boschi G, Sandouk P, Scherrmann J-M. Elevated concentrations of morphine 6-beta-D-glucuronide in brain extracellular fluid despite low blood–brain barrier permeability. Br J Pharmacol. 1999;128:917–924. doi: 10.1038/sj.bjp.0702873. [DOI] [PMC free article] [PubMed] [Google Scholar]
- Thomson PI, Joel S, John L, Wedzicha JA, Maclean M, Slevin M. Respiratory depression following morphine and morphine-6-glucuronide in normal subjects. Br J Clin Pharmacol. 1995;40:145–152. [PMC free article] [PubMed] [Google Scholar]
- Tunblad K, Hammarlund-Udenaes M, Jonsson EN. Influence of probenecid on the delivery of morphine-6-glucuronide to the brain. Eur J Pharm Sci. 2005;24:49–57. doi: 10.1016/j.ejps.2004.09.009. [DOI] [PubMed] [Google Scholar]
- Upton RN, Grant C, Ludbrook GL. An ultrasonic Doppler venous outflow method for the continuous measurement of cerebral blood flow in conscious sheep. J Cereb Blood Flow Metab. 1994;14:680–688. doi: 10.1038/jcbfm.1994.85. [DOI] [PubMed] [Google Scholar]
- Upton RN, Ludbrook GL, Gray EC, Grant C. The cerebral pharmacokinetics of meperidine and alfentanil in conscious sheep. Anesthesiology. 1997a;86:1317–1325. doi: 10.1097/00000542-199706000-00013. [DOI] [PubMed] [Google Scholar]
- Upton RN, Ludbrook GL, Martinez AM, Grant C, Milne RW. Cerebral and lung kinetics of morphine in conscious sheep after short intravenous infusions. Br J Anaesth. 2003;90:750–758. doi: 10.1093/bja/aeg131. [DOI] [PubMed] [Google Scholar]
- Upton RN, Ludbrook GL. A physiologically based, recirculatory model of the kinetics and dynamics of propofol in man. Anesthesiology. 2005;103:344–352. doi: 10.1097/00000542-200508000-00018. [DOI] [PubMed] [Google Scholar]
- Upton RN, Semple TJ, Macintyre PE. Pharmacokinetic optimisation of opioid treatment in acute pain therapy. Clin Pharmacokinet. 1997b;33:225–244. doi: 10.2165/00003088-199733030-00005. [DOI] [PubMed] [Google Scholar]
- Van Crugten JT, Sallustio BC, Nation RL, Somogyi AA. Renal tubular transport of morphine, morphine-6-glucuronide, and morphine-3-glucuronide in the isolated perfused rat kidney. Drug Metab Dispos. 1991;19:1087–1092. [PubMed] [Google Scholar]
- van Dorp ELA, Romberg R, Sarton E, Bovill JG, Dahan A. Morphine-6-glucuronide: morphine's successor for postoperative pain relief. Anesth Analg. 2006;102:1789–1797. doi: 10.1213/01.ane.0000217197.96784.c3. [DOI] [PubMed] [Google Scholar]
- Wu D, Kang Y-S, Bickel U, Pardridge WM. Blood–brain barrier permeability to morphine-6-glucuronide is markedly reduced compared to morphine. Drug Metab Dispos. 1997;25:768–771. [PubMed] [Google Scholar]