

Abstract
Patient-specific measures derived from quantitative computed tomography (QCT) scans are currently being developed as a clinical tool for vertebral strength prediction. QCT-based measurement techniques vary greatly in structural complexity and generally fall into one of three categories: 1) bone mineral density (BMD), 2) “mechanics of solids” (MOS) models, such as minimum axial rigidity (the product of axial stiffness and vertebral height), or 3) three dimensional finite element (FE) models. There is no clear consensus as to the relative performance of these measures due to differences in experimental protocols, sample sizes and demographics, and outcome metrics. The goal of this study was to directly compare the performance of QCT-based assessment techniques of varying degrees of structural sophistication in predicting experimental vertebral compressive strength. Eighty-one human thoracic vertebrae (T6 – T10) from 44 donors cadavers (F = 32, M = 12; 85 + 8 y.o., max = 97 y.o., min = 54 y.o.) were QCT scanned and destructively tested in uniaxial compression. The QCT scans were processed to generate FE models and various BMD and MOS measures, including trabecular bone mineral density (tBMD), integral bone mineral density (iBMD), and axial rigidity. Bone mineral density was weakly to moderately predictive of compressive strength (R2 = 0.16 and 0.62 for tBMD and iBMD, respectively). Ex vivo vertebral strength was strongly correlated with both axial rigidity (R2 = 0.81) and FE strength measurements (R2 = 0.80), and the predictive capabilities of these two metrics were statistically equivalent (p > 0.05 for differences between FE and axial rigidity). The results of this study indicate that non-invasive predictive measures of vertebral strength should include some level of structural sophistication, specifically, gross geometric and material property distribution information. However, for uniaxial compression of isolated vertebrae, which is the current biomechanical testing paradigm for new non-invasive strength assessment techniques, QCT-based FE and axial rigidity measures are equivalent predictors of experimental strength. However, before abandoning the FE method in favor of more simplistic techniques, future work should investigate the performance of the FE method versus MOS measures for more physiologically representative loading conditions, e.g., anterior bending or in situ loading with intervertebral discs intact.
Keywords: osteoporosis, fracture, vertebra, finite element, quantitative computed tomography
Introduction
Non-invasive assessment of vertebral strength is critical for the effective treatment of osteoporosis. The current clinical standard, which is site-specific bone mineral density (BMD) assessment using dual energy x-ray aborptiometry (DXA) (1, 4), is only moderately effective in predicting the occurrence of vertebral fractures (11). Numerous researchers have speculated that DXA is an inaccurate measure of vertebral fracture risk potential because it is structurally simplistic, i.e., it reflects only volume averaged material properties, and they have focused their efforts on developing more sophisticated mechanical models of vertebral body fractures (2, 8, 9, 14, 15, 19, 23, 36). These patient-specific models are generated from quantitative computed tomography (QCT) scans and can be classified as: 1) relatively simplistic “mechanics of solids” (MOS) models (2, 8, 9, 14, 36), such as minimum axial rigidity and stiffness, or 2) three dimensional finite element (FE) models (8, 9, 15, 19, 23). Clinical use of such techniques is still under investigation as there is no clear evidence that these methods have better outcomes than DXA-BMD in vivo.
There have been numerous experimental studies of the ability of BMD and MOS to predict vertebral strength (2, 5, 12-14, 17, 18, 25, 27, 28, 33, 35); however, there is no clear consensus as to the relative performance of these measures. This may be due to inter-study differences in sample sizes (N = 11 (27) to N = 378 (24)), testing protocols (isolated vertebral bodies versus functional spinal units), and outcome measures (ultimate axial force versus ultimate axial stress) (Table 1). In general, there is evidence that DXA-BMD is a moderately good predictor of experimental vertebral strength, with R2 values in the range 0.46 – 0.83 (see Table 1). QCT trabecular bone mineral density (tBMD) is a somewhat weaker predictor (R2 = 0.08 – 0.67, see Table 1), but correlations with experimental strength improve if tBMD is normalized by minimum transverse plane cross sectional area (Amin) (5, 14, 33).
Table 1.
Results from the literature for DXA and QCT measures vs. ex vivo vertebral strength.
| Author | No. samples | Age | Specimen Type | Scan Type | Independent variable | Dependent Variable | R2 |
|---|---|---|---|---|---|---|---|
| Edmondston[15] | 250 | 29 – 88 | Isolated
vertebrae |
DXA
QCT |
BMD
tBMD |
Fu, σu | 0.46, 0.28
0.67, 0.53 |
| Brinckmann[4] | 98 | 19 - 79 | Spinal
sections |
QCT | iBMD
IBMD x Amin |
Fu | 0.38
0.64 |
| Moro[13] | 11 | 48 - 87 | Spinal
sections |
DXA | BMD | Fu | 0.69 |
| Eriksson[5] | 73 | 59 - 94 | Isolated
vertebrae |
QCT | iBMD
iBMD x Amin |
Fu | 0.23
0.55 |
| Singer[20] | 306 | 29 - 89 | Isolated
vertebrae |
QCT | tBMD
iBMD tBMD x Amin |
Fu | 0.08
0.74 0.69 |
| McBroom[19] | 40 | 63 - 99 | Isolated
vertebrae |
QCT | TBMD | Fu | 0.46 |
| Ebbesen[16] | 101 | 18 - 96 | Isolated
vertebrae |
DXA | BMD
tBMD |
Fu, σu | 0.83, 0.71
0.61, 0.76 |
| Cheng[14] | 62 | 68 + 16 | Isolated
vertebrae |
DXA
QCT QCT |
BMD
tBMD tBMD x Amin |
Fu, σu | 0.64, 0.40
0.40, 0.50 0.61, 0.40 |
| Mosekilde[12] | 30 | 43 - 95 | Isolated
vertebrae |
QCT | TBMD | Fu, σu | 0.52, 0.30 |
| Lochmuller[22] | 126 | 82 + 9 | Spinal
sections |
DXA
QCT |
BMD
tBMD |
Fu | 0.62
0.48 |
| Eckstein[34] | 39 | 79 + 11 | Spinal
sections |
QCT | TBMD | Fu | 0.66 |
QCT = quantitative computed tomography
DXA = dual x-ray absorptiometry
Fu = ex vivo ultimate axial compressive force
σu = ex vivo ultimate axial compressive strength
Spinal sections = two or more vertebrae with discs
Amin = minimum transverse plane cross sectional area
BMD = DXA-measured bone mineral density using anterior-posterior projection
tBMD = trabecular bone mineral density,
iBMD = integral bone mineral density, including vertebral cortex and endplates
Finite element (FE) models derived from QCT scans are a promising alternative to BMD and MOS techniques since these models automatically incorporate bone geometry and material heterogeneity (8, 15, 19) and may be used to simulate various loading conditions (7-9, 32). Studies have shown that QCT-based finite element predictions of vertebral strength better discriminate between osteoporotic and non-osteoporotic individuals (15) and well predict the experimental strength of lumbar vertebrae (8). Crawford et al., (8) found that QCT-based finite element stiffness was a better predictor of vertebral compressive strength (R2 = 0.86) than either trabecular bone mineral density (tBMD) (R2 = 0.53) or axial rigidity (R2 = 0.65). Although this result is promising for the continued development of the finite element technique, the data set used in this study was extremely small (N = 13), and only a subset of the possible BMD and MOS metrics were used for comparison. Thus, the relative performance of the QCT-based FE technique as compared to BMD and MOS is still unknown.
The purpose of this study was to directly compare the performance of three QCT-based techniques, namely, BMD, MOS, and FE, in predicting experimental vertebral strength. Our biomechanical test method was uniaxial compression testing on isolated vertebral bodies. This method is the testing paradigm for new non-invasive strength assessment techniques (5, 12-14, 25, 28, 33) because it ensures well-defined, repeatable loading conditions. Radiographic information was taken exclusively from QCT scans, and our predictive measures were a subset of those most frequently used in the literature (2, 8, 9, 14, 36). Lastly, we tested a large number of samples (N = 81 with 4 excluded from analysis) from a high-risk fracture region (T6 to T10) (6) of predominantly female, elderly donors in order to lend statistical credibility to our findings regarding the relative abilities of these QCT-based techniques to predict osteoporotic fractures in vivo.
Materials and Methods
Specimen Preparation
Intact thoracolumbar spines (T1-L5) were extracted from 44 fresh-frozen cadavers (F = 32, M = 12; 85 + 8 y.o., max = 97 y.o., min = 54 y.o.). All donors were screened by a trained clinician to ensure that they had no history of spine trauma or pathologies that are known to affect bone quality, e.g., metastatic cancer or hyper and hypo-thyroidism, or bone morphology, e.g., pre-existing vertebral fractures or scoliosis. Eighty-one thoracic vertebrae (T6 – T10 with 35% T10, 20% T7, 20% T8, 20% T9, and 5% T6) were extracted from the intact spinal sections by cutting through the intervertebral discs with a dissection knife and disarticulating the posterior elements with an autopsy saw. The remaining spinal levels from the thoracolumbar sections were designated for donor-matched mechanical testing in alternate loading modes, e.g., anterior bending of isolated vertebrae or in situ testing with intact discs (3).
The vertebrae were cleaned of the surrounding soft tissue, and the posterior elements were transected at the pedicles using a hacksaw. The vertebral bodies were potted in polymethylmethacrylate (PMMA) using a custom built jig that ensured that the loading surfaces were plano-parallel. Specially designed potting cups were used to create uniformly shaped, minimally thick layers of PMMA (1 mm to 3 mm thickness) on the vertebral endplates (Figure 1a). The geometry and uniformity of the PMMA layers facilitated the application of uniform loading conditions by minimizing inter-specimen differences in stiffness due to compliance in the PMMA layer. After potting, all specimens were wrapped in saline-soaked gauze and stored at –20 degrees Celsius for up to six months before testing. To minimize the risk of bone damage, specimens were thawed only once in air to room temperature, and both QCT scanning and mechanical testing were conducted within a 12-hour time period with no re-freezing.
Figure 1.
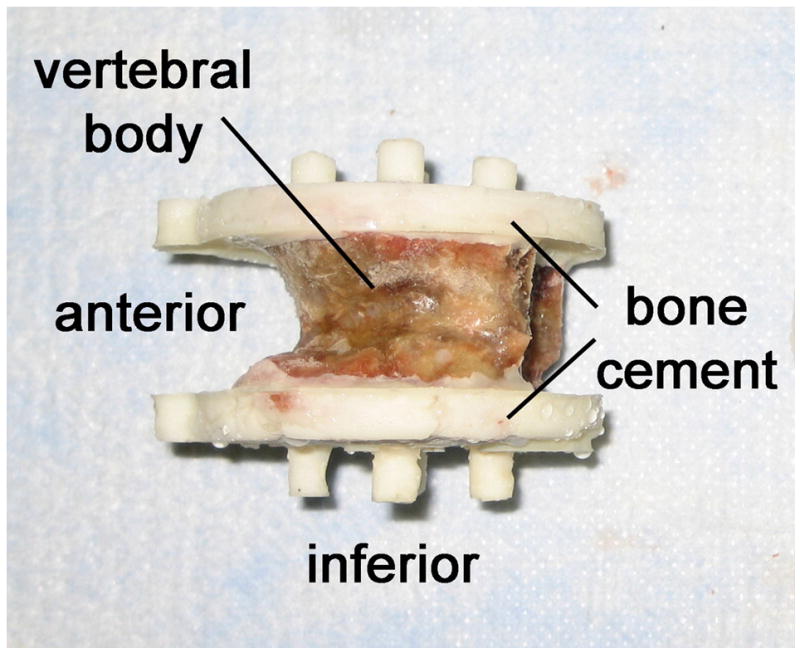
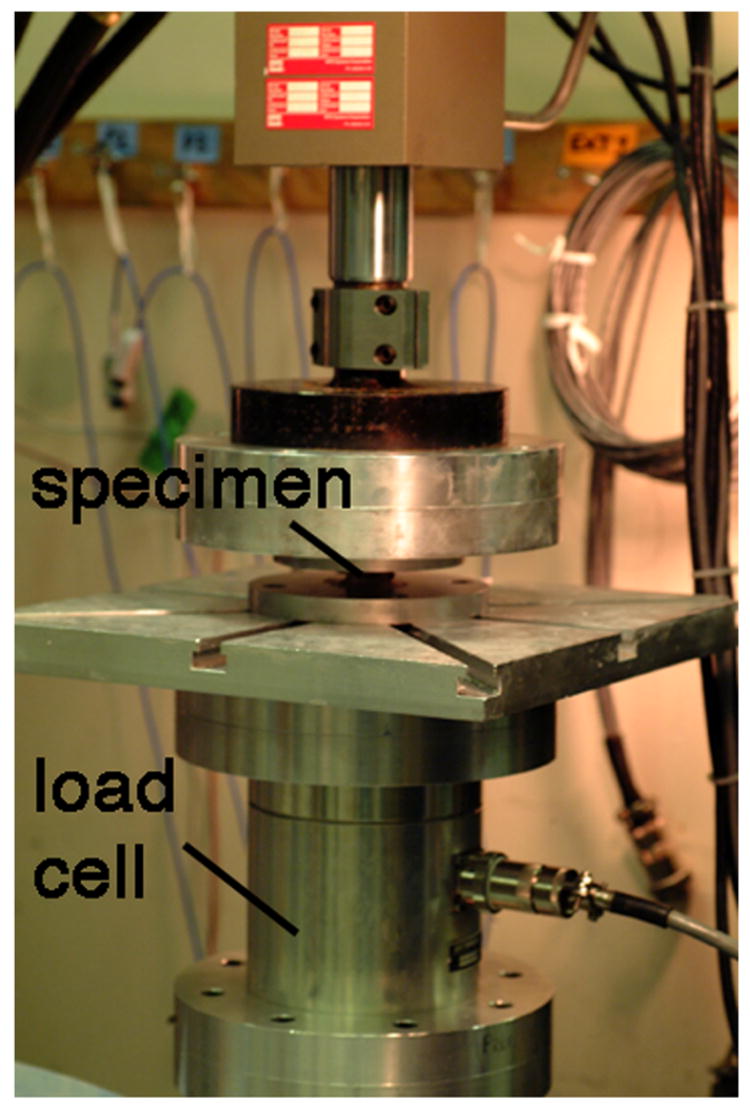
(a) A thoracic vertebral body that has been prepared for mechanical testing. (b) Experimental set-up for destructive testing of isolated vertebral bodies in uniaxial compression.
QCT Scanning
The potted vertebrae were scanned on a clinical resolution QCT machine (Phillips MX800 CT Scanner, 140 kV, 400 mA/slice, 1 x 1 x 1 mm/pixel resolution). The vertebrae were scanned after being potted in bone cement to allow for explicit incorporation of the bone cement layer in the finite element models. During QCT scanning, approximately 30 specimens at a time were submerged in a custom-built, saline-filled tank that held each vertebra in a prone position. A solid calibration phantom (Mindways 2100, Mindways, San Francisco, CA) was placed beneath the tank and used to map grayscale values to bone mineral density. The aggregate QCT scans were separated into files for each vertebra, and a simple thresholding technique was used to segment the bone from the background.
Mechanical Testing
Uniaxial compression tests were performed on each specimen at room temperature using a servohydraulic load frame (858 mini-bionix, MTS, Eden Prairie, MN) and a high-capacity load cell (AMTI MC6-5000, Advanced Mechanical Technology, Inc., Watertown, MA) (Figure 1b). In order to ensure precision and consistency in the applied loading conditions, specimens were mounted into the testing frame as follows. First, the outer surfaces of the bone cement layers were coated in cyanoacrylate, and the superior end of the specimen was pressed into the loading platen rigidly attached to the servohydraulic actuator. While lowering the actuator, the inferior specimen cup was repositioned on an x-y table to allow the specimen to engage in the cup under a compressive preload of 50 N. The x-y position of the inferior cup was then locked into place. This protocol ensured that: 1) the outer surfaces of the specimen (the bone cement layers) were loaded in pure axial compression with no Poisson expansion, and 2) the initial testing condition was 50 N axial compression with no transverse shear.
In order to properly seat the bone cement layers in the test platens, preconditioning was conducted using protocol previously established by Kopperdahl et al. (21). This consisted of 10 cycles of 100 N to 250 N compressive force at 0.1 Hz (21). Immediately following preconditioning, specimens were destructively tested in displacement-control at 1 mm/minute until ultimate force was achieved. Experimental vertebral strength (FEXP) was defined as the axial force at the ultimate point in the whole bone force-displacement curve. Axial stiffness (KEXP) was calculated for each specimen using the methods of Kopperdahl et al. (21). This method involved taking the maximum of the tangent moduli at each point in the force-deformation curve.
QCT-based BMD and MOS Measurements
For each specimen, various BMD and MOS measurements were obtained using custom-built code (IDL v 6.1, ITT Industries, Boulder, CO). First, a thresholding algorithm was applied to segment the bone cement from underlying cortical and trabecular bone. Then, the average trabecular bone mineral density (tBMD) and its standard deviation (std. tBMD) were determined over a maximally-sized elliptical region of interest within the centrum (Figure 2). Integral bone mineral density (iBMD) was computed over the entire bone volume, including the cortical shell and endplates, and minimum axial cross sectional area (Amin) was also determined. Lastly, BMD values were mapped to principal elastic modulus values using the following empirical relationship for trabecular bone (Table 2) (20):
Figure 2.
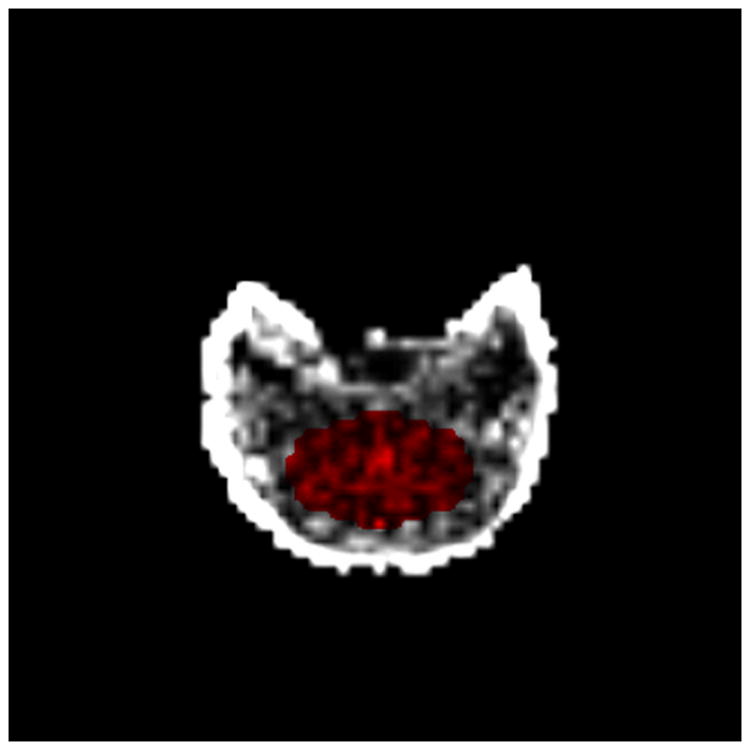
The elliptical region of interest (shown in red) for determining QCT-based trabecular bone mineral density (tBMD).
Table 2.
Equations used to calculate QCT-based “mechanics of solids” (MOS) measures of vertebral strength.
| Measure | Method of Calculation |
|---|---|
| (EA)tBMD | EtBMD Aminwhere EtBMD = −34.7 + 3.23(tBMD) |
| (EA)iBMD | EiBMD Aminwhere EiBMD = −34.7 + 3.23(iBMD) |
| (EA)min | min[(EA)l]where |
E = Young’s modulus, modulus-density relationship from Kopperdahl et al. [25]
Amin = Minimum transverse plane cross-sectional area
Ek, Ak = Young’s modulus and cross-sectional area, respectively, associated with a given pixel, k
l = axial slice number
| Eq.1 |
where E = principal elastic modulus (MPa) and BMD = QCT-based bone mineral density in mg/cm3 of hydroxyapatite.
Axial rigidity was computed in three different ways (see Table 2): 1) the product of the tBMD-based modulus and the minimum cross sectional area, (EA)tBMD, 2) the product of the iBMD- based modulus and the minimum cross sectional area, (EA)iBMD, and 3) the minimum of the axial rigidities across all transverse planes in the vertebral body, (EA)min. The latter method required mapping BMD to principal elastic modulus on a pixel-by-pixel basis, computing axial rigidity for each QCT axial slice, and taking the minimum axial rigidity across all of the slices.
QCT-based Finite Element Models
The QCT scans were also used to develop finite element models for each vertebral body (8, 10). In order to facilitate comparisons with results in the literature, our FE models were generated following the protocol established by Crawford et al. (8) and Homminga et al. (19). Hexahedral meshes of 1 mm (isotropic) element size were generated directly from the QCT scans using a custom-built algorithm (8, 19) (Figure 3). Since the PMMA on the vertebral endplates was QCT scanned along with the vertebra, this material was automatically identified and explicitly modeled (E=2.5 GPa, ν=0.3)(22). The vertebral bone was assumed to be a transversely isotropic, linearly elastic-perfectly plastic material. Material properties were assigned on an element- specific basis using previously established density-modulus and density-strength relationships for vertebral trabecular bone (20). Because the clinical resolution QCT scans used in this study did not produce a discrete image of the cortical shell, elements along the periphery of the bone were treated as trabecular bone in assigning material properties.
Figure 3.
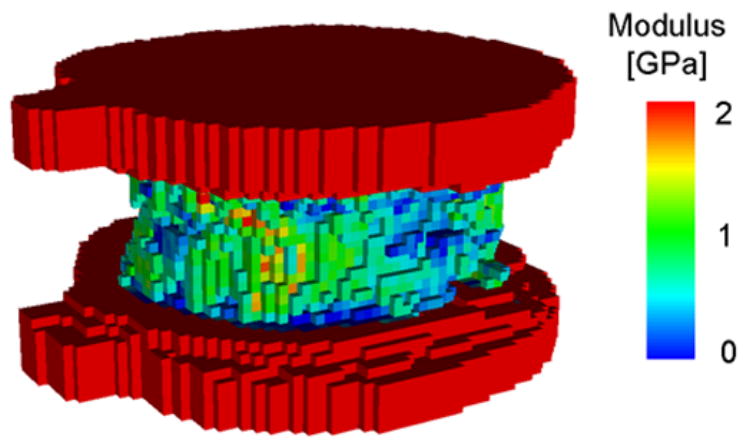
A QCT-based finite element model of a human thoracic vertebral body. The bone cement layer is explicitly modeled and used for application of the boundary conditions.
The boundary conditions for the finite element models were precisely prescribed in order to match the experimental loading conditions. The external loading surfaces of each bone cement layer were automatically identified. The superior loading surface was prescribed a uniform inferior axial displacement corresponding to 3% apparent-level strain (based on the axial height of the vertebral body portion of the FE mesh). All other rotational and translational degrees of freedom for the superior surface were constrained to be rigid. For the inferior surface, all six degrees of freedom were constrained because the experimental loading conditions did not allow for Poisson expansion of the bone cement layer. Large deformation finite element analyses were conducted using commercial software (Abaqus v6.2, Abaqus, Inc., Pawtucket, RI). Net axial force was calculated for each solution increment by integrating nodal reaction forces on the inferior loading surface, and axial displacement for a single node on the superior loading surface was also recorded. Using the whole bone force-deformation curve, vertebral strength was defined as the axial force at 3% apparent strain as per Crawford et al. (7). FE-based whole bone axial stiffness (KFE) was calculated as net axial force divided by displacement for the first solution increment in the non-linear analysis. Preliminary FE analyses indicated that this is a valid assumption because the first solution increment is primarily elastic (less than 1% by volume of the model elements have yielded).
Statistical Analyses
Statistical analyses were performed using commercially available software (JMP v5.0, SAS Institute, Inc., Cary, NC). A multiple linear regression was used to determine if age, sex, and spinal level were related to experimental vertebral strength and stiffness. The predictive abilities of BMD, MOS, and FE measures assessed using multiple, simple linear regressions. The correlation coefficients of these regressions (R2) were calculated both in their raw and sample size-adjusted forms (adj. R2). R2 values were statistically compared by using a Fisher Z-transform. P = 0.05 was considered the cut-off for significance in all statistical analyses.
Results
Four vertebrae were excluded from the test set for the following reasons: operator errors during mechanical testing (2 specimens), evidence of pre-existing fracture on QCT scan (1 specimen), and artifacts on QCT scan (1 specimen). For the remaining specimens (N = 77), the majority of the vertebrae sustained loads of approximately 2000 N before failure (1709 N and 3166 N, 25th and 75th quartiles, respectively). Age and spinal level were not significant predictors of vertebral strength (p > 0.1 grouping by gender and p > 0.1 not grouping by gender). Strength for vertebrae from female donors was 2084 + 788 N, while strength for male donors was significantly higher at 3866 + 1861 N (p < 0.01).
Bone mineral density measures were poorly to moderately related to ex vivo vertebral body strength and stiffness (Table 3). tBMD was much less strongly correlated with vertebral strength than iBMD (adj. R2 = 0.16 vs. 0.62, p < 0.01 for both regressions). The inclusion of the standard deviation in tBMD had no statistically significant effect in improving the predictive capabilities of average tBMD measures for either stiffness or strength (p > 0.05 for both correlations using restricted-vs-full F-test; JMP v5.0, SAS Institute, Inc., Cary, NC).
Table 3.
Statistically significant correlations between QCT-derived measures and experimental vertebral values (p < 0.01 for all correlations; JMP v5.0, SAS Institute, Inc., Cary, NC). Correlations unadjusted for age, sex, and level.
| Strength | Stiffness | |||||
|---|---|---|---|---|---|---|
| Measure | R2 | Adj. R2 | RMSE [kN] | R2 | Adj. R2 | RMSE [kN] |
| tBMD | 0.17 | 0.16 | 1.37 | 0.12 | 0.11 | 1.14 |
| iBMD | 0.63 | 0.62 | 0.92 | 0.27 | 0.26 | 1.04 |
| (EA)tBMD | 0.42 | 0.41 | 1.14 | 0.26 | 0.25 | 1.05 |
| (EA)iBMD | 0.76 | 0.76 | 0.73 | 0.33 | 0.32 | 0.99 |
| (EA)min | 0.81 | 0.81 | 0.65 | 0.38 | 0.37 | 0.96 |
| FE* | 0.80 | 0.80 | 0.67 | 0.28 | 0.27 | 1.03 |
FE stiffness values (KFE) used for correlation with experimental stiffness (KEXP); FE strength values used for correlation with experimental vertebral strength
QCT-based axial rigidity was better correlated with experimental measures than BMD. The method of measuring axial rigidity affected the predictive capabilities drastically (see Table 3). Axial rigidity based on tBMD was better correlated with vertebral strength and stiffness than tBMD alone, and the same was true for iBMD-based axial rigidity. The strongest predictor of vertebral strength was (EA)min (Figure 4a, adj. R2 = 0.81, p < 0.001), which was determined from evaluating each transverse plane QCT slice independently. (EA)min was also the best predictor of experimental stiffness (adj. R2 = 0.37, p < 0.001), although it was far less strongly correlated with stiffness than with strength.
Figure 4.
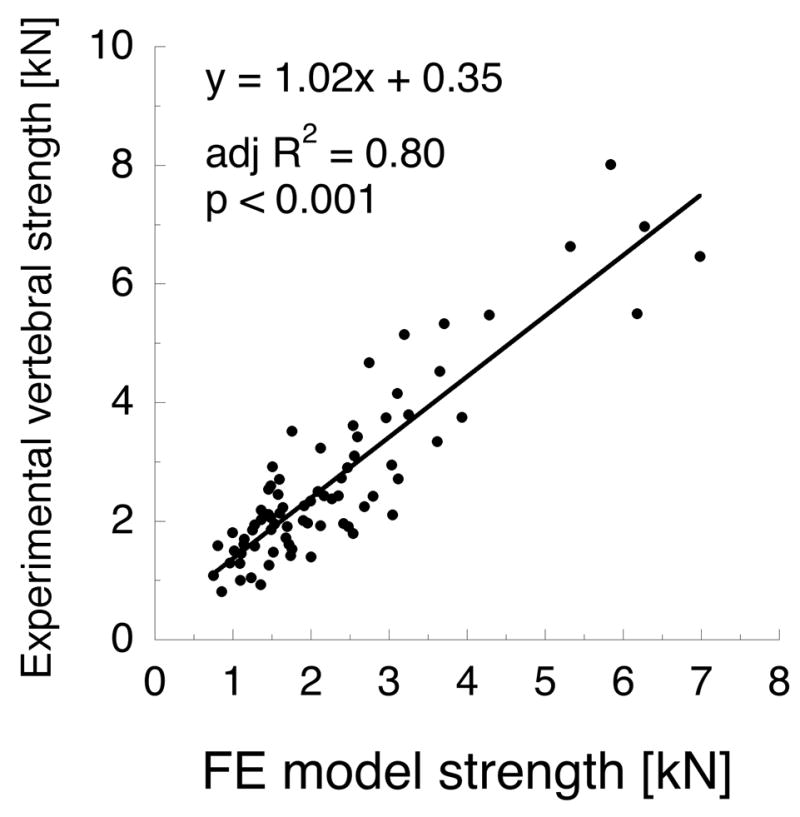
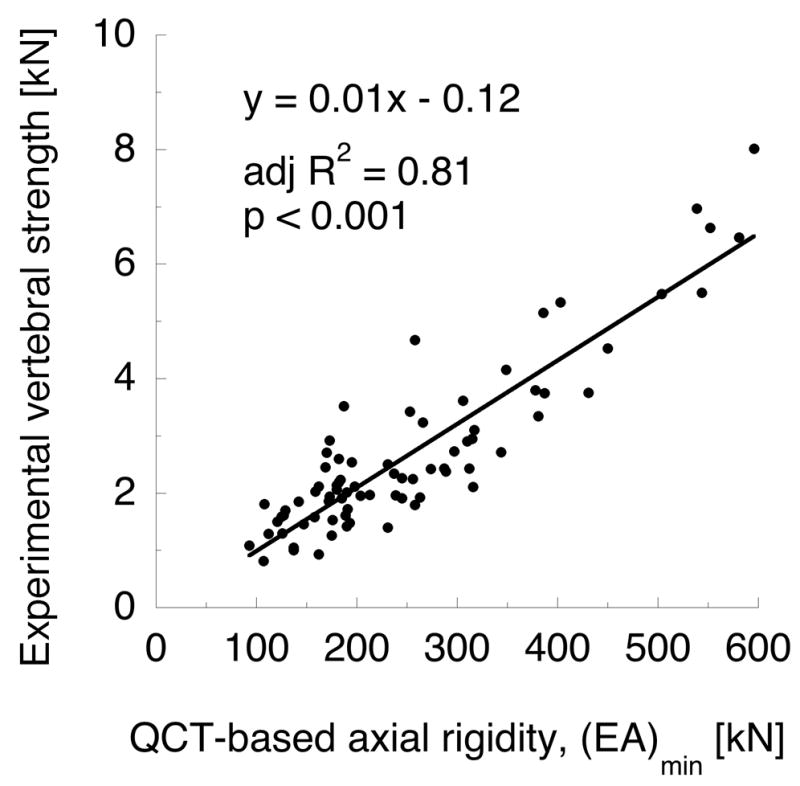
(a) QCT-based axial rigidity (b) and finite element strength metrics are comparable predictors of vertebral strength in axial compression (N = 77). Axial rigidity is computed on a per-slice basis across all transverse planes in the vertebra, as described in Table 3.
QCT-based finite element model calculations of vertebral strength were strongly correlated with experimental vertebral strength (see Figure 4b, adj. R2 = 0.80, p < 0.001). However, the strength of this correlation was statistically equivalent to that of (EA)min (p > 0.05 for difference in adj. R 2); and (EA)min and FE strength were strongly related (adj. R2 = 0.94, p < 0.001). Axial stiffness from FE models (KFE) poorly predicted experimental stiffness (adj. R2 = 0.27, p < 0.001); and the strength of the regression between KFE and experimental stiffness was significantly less than (AE)min and experimental stiffness (p < 0.01 for difference in adj. R2). Lastly, experimental strength and stiffness were only modestly correlated (Figure 5a; adj. R2 = 0.44, p < 0.001), but FE strength and stiffness were strongly correlated (Figure 5b; adj. R2 = 0.92, p < 0.001).
Figure 5.
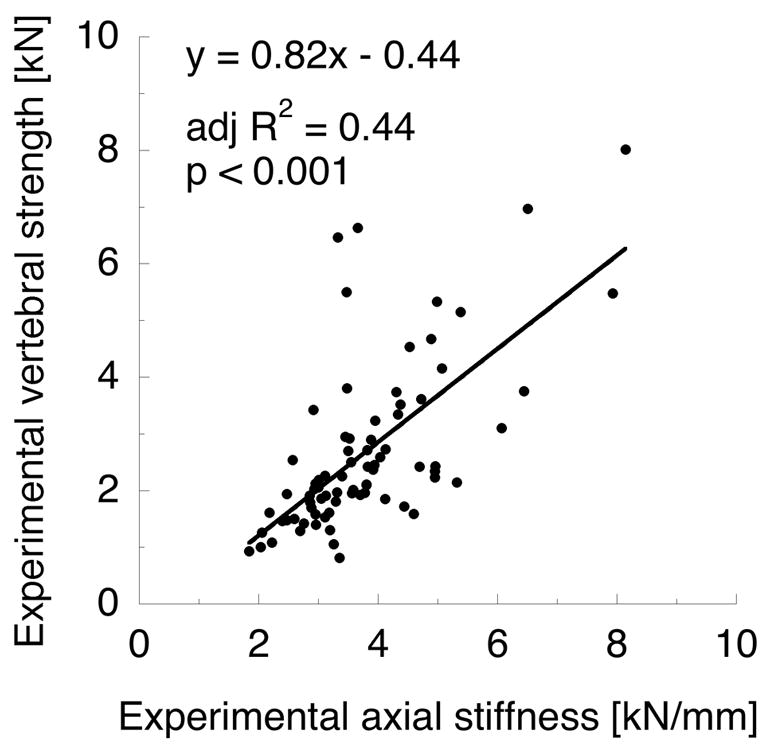

(a) Experimental strength and stiffness are modestly correlated. (b) QCT-based FE strength and stiffness are strongly correlated.
Discussion
The results of this study strongly suggest that non-invasive measures of vertebral strength should incorporate both geometry and material property distribution information. For compressive loading on isolated vertebral bodies, which is a simplistic, well defined loading condition, trabecular bone mineral density measures alone accounted for only 16% of the variability in experimental strength, while integral bone mineral density, which incorporated some degree of material heterogeneity by including the cortical shell and endplates, accounted for 62% of the variability in strength. Under more complex loading conditions, such as those experienced by the vertebra in vivo, we would expect that both BMD measures would be even worse predictors of experimental strength since this measure cannot be adapted for different loading modes. By comparison, QCT-based slice-by-slice axial rigidity and finite element strength measures accounted for 80% of the scatter in experimental strength. Furthermore, these models are more robust, as both MOS and FE approaches can be adapted for different loading conditions. For instance, beam theory can be applied to MOS models in order to simulate bending loads, and a variety of boundary conditions can be applied to FE models.
Our findings are in agreement with the literature regarding the efficacy of the BMD and MOS measures in predicting experimental vertebral strength. The strength of our tBMD regression is low (R2 = 0.16) when compared with other studies (5, 12, 13, 25, 28), but it is still within the range reported in the literature (R2 = 0.08 (33) to 0.67 (13)). This weak regression may be due to the fact that our elderly test population (86 ± 5 y.o.) has low bone density. Since bone density is preferentially lost in the centrum (29) and the load bearing effects of the cortical shell (15, 19, 25) are not incorporated into these models, tBMD may not be able to distinguish between individuals with high cortical bone mass – and thus high compressive strength – and individuals with low cortical bone mass. This would also explain why iBMD is a much better predictor of strength for this test set and why our iBMD R2 value is more in line with the literature (R2 = 0.38 (2) to 0.74 (33)). Lastly, the predictive strength of axial rigidity measurements in our study (R2 = 0.41 to 0.81) was in agreement with a prior investigation (R2 = 0.65) (8).
Our data are also in agreement with the one study in the literature, specifically, that of Crawford et al. (8), regarding the ability of the QCT-based FE technique to predict vertebral strength in compression. However, unlike this previous study, our results do not indicate that the FE technique is superior to the MOS approach. Crawford et al. (8) found that FE-calculated axial strength predicts experimental strength with an R2 value of 0.86. This is comparable to our study (R2 = 0.80), especially considering the drastic differences in sample size (N = 13 for Crawford et al. (8) vs. N = 77 for our study) and the fact that increased sample size naturally results in more scatter about the best-fit linear regression. Furthermore, in making their comparison between FE and MOS techniques, Crawford et al. (8) used the most simplistic axial stiffness measure, namely, the product of tBMD and minimum cross sectional area, (EA)tBMD, which, we found to be the stiffness measure least strongly correlated with experimental strength. Given that the vertebral body is heterogeneous and geometrically irregular, our method of computing axial rigidity on a slice-by-slice basis is logically the better predictor of strength. Lastly, Crawford et al. (8) asserted that the current QCT-based FE technique is a mechanistic model of the vertebral body. However, our results indicate that FE is not a good predictor of whole bone elastic behavior. Specifically, FE stiffness is weakly correlated with experimental stiffness (adj. R2 = 0.27, p < 0.001). Also, experimental stiffness and strength are only modestly correlated (adj. R2 = 0.44, p < 0.001), but FE models show a strong correlation between stiffness and strength (adj. R2 = 092, p < 0.001). Although BMD and MOS measures are similarly poor predictors of experimental stiffness (adj. R2 = 0.11 – 0.37, p < 0.01 for all measures), these techniques were never asserted to be “mechanistic” and are only representative of the loading state at failure. For instance, QCT-based axial rigidity measures were calculated using either minimum cross sectional area or minimum slice-by-slice axial rigidity, which assumes that the vertebra will fail in a single cross-sectional plane.
There are several strengths to our approach to determining the relative efficacy of current non-invasive vertebral strength assessment techniques. First, our study examined the efficacy of numerous, currently used non-invasive structural measures that spanned the entire range of structural complexity, from the relatively simplistic BMD measures to nonlinear, three-dimensional FE models. Because each non-invasive measurement was applied to all specimens in our test population, we were able to make direct comparisons between techniques without the complicating effects of inter-specimen variability. Second, the MOS and FE methods used in this study were based on physical principles and therefore have a better potential for predicting strength under alternate loading conditions. Several studies (5, 13, 14, 17) have examined the ability of BMD and geometric measures to predict vertebral compressive strength; however, they did not combine these measures to form a structural parameter, such as axial rigidity, but rather used them as independent variables in a multiple linear regression. While this may give higher R2 values, the resulting relationship for predicting strength is empirical and may not apply to other test populations or loading modes. Similarly, several studies have derived the input parameters for the finite element technique, namely, cortical (23) and trabecular bone (7) material properties, by calibrating these parameters on a subset of specimens. While this technique is scientifically valid, it may give an inflated view of the performance of this technique since the calibrated models may not perform as well for other test sets or loading modes.
Our study also has some limitations. First, our test population was exclusively thoracic vertebrae (T6-T10) from predominantly female, elderly donors (85 + 8 y.o.). Although this is a narrowly focused demographic, our study design is supported by epidemiological data. Specifically, vertebral fractures typically develop between T6 and L3 (6, 26), with most frequently fractured sites at T8, T9, and L1 (6). Thus, the thoracic specimens tested in this study - 75% of which are between the T8 and T10 levels – are appropriate for investigating clinical fracture strength. With regard to donor age and sex, risk of vertebral fracture is higher for women (31) and more than doubles between the 7th and 8th decades of life (6). Therefore, our specimens are representative of a very at-risk population, unlike previous studies which had upwards of 50% male donors (2, 5, 12-14, 17, 18, 25, 27, 28, 33, 35) and donors as young as 18 years old (12). Lastly, since we are examining vertebral strength prediction from a structural perspective, age, sex, and spinal level are not explicitly incorporated into our models and could only affect our results if it resulted in narrow BMD ranges, which was not the case. A second limitation of our study is the presence of non-trivial (> 2 mm) osteophytes in 30% of our specimens, which is expected because our test population is elderly (30), and we are using thoracic vertebrae (34). Although osteophytes change the vertebral geometry, our preliminary analyses concluded that they were structurally insignificant because including the presence of osteophytes as a predictor variable did not affect the results (p > 0.05). A final limitation of our study is that the material model used in the FE analyses does not precisely simulate the mechanical response of vertebral bone. First, the elastic behavior of the bone was based on empirical density-modulus relationships from compression tests on relatively large sections of vertebral trabecular bone (20). The validity of applying these relationships to smaller bone volumes, e.g., 1 mm cubic “voxels” as in this study, has not yet been established. Second, post-yield behavior, i.e., strain softening was not incorporated into our FE models and, unlike experimental behavior, these models did not reach an ultimate sustainable force. Lastly, our FE models did not include an explicit cortical shell because the clinical-resolution QCT scans blurred the shell into the surrounding trabecular bone and the automated hexahedral meshing algorithm pixilated the curved periphery of the vertebra. All three of these limitations in our FE modeling strategy may have affected the ability of this technique to accurately predict experimental results. However, these assumptions are standard practice in patient-specific finite element modeling (8, 9, 15, 19); and the purpose of this study was to compare the predictive capabilities of currently-used QCT-based measures.
The results of this study are important clinically because they address the issue of whether research efforts in developing a more accurate method for predicting osteoporotic vertebral fractures should be directed towards creating more sophisticated structural models of the vertebrae. Our results show that some level of structural sophistication is needed in non-invasive predictive measures, specifically, the inclusion of both gross geometric and material property distribution information. However, simple “mechanics of solids” measures are comparable to finite element models in predicting vertebral strength in uniaxial compression. For this testing paradigm, both strength measurement techniques perform very well, accounting for approximately 80% of the variability in bone strength. This suggests that the vertebra behaves as a simple uniaxial spring in compression and that the use of a complex, three-dimensional finite element model may not be justified for this loading condition. However, because in vivo loading conditions are multiaxial and non-uniform (16, 36), future work is needed to examine the robustness of the MOS and FE techniques under more, physiologically-representative loading modes, e.g., anterior bending and in situ loading with surrounding intervertebral discs.
Acknowledgments
Funding for this project was provided by NIH AR49828 (Tony M. Keaveny, PI) and a Chancellor’s Fellowship from the University of California at Berkeley (Jenni M. Buckley). Cadaveric tissue was provided by the UC San Francisco Willed Body Program and the National Disease Research Interchange (NDRI). Initial QCT image processing was conducted by Jon Camp and Phillip Edwards at the Biomedical Imaging Resource, Mayo Clinic Rochester, MN. A portion of the FE mesh generation code was developed by Atul Gupta, M.S., and was used with his permission. All experiments and FE simulations were conducted in the UC San Francisco Orthopaedic Bioengineering Laboratory (Jeffrey C. Lotz, PI). The authors would like to thank Eric Wong and Bethany Baumbach for help with specimen preparation.
Footnotes
Publisher's Disclaimer: This is a PDF file of an unedited manuscript that has been accepted for publication. As a service to our customers we are providing this early version of the manuscript. The manuscript will undergo copyediting, typesetting, and review of the resulting proof before it is published in its final citable form. Please note that during the production process errors may be discovered which could affect the content, and all legal disclaimers that apply to the journal pertain.
References
- 1.Bates DW, Black DM, Cummings SR. Clinical use of bone densitometry - Clinical applications. Jama-Journal of the American Medical Association. 2002;288:1898–1900. doi: 10.1001/jama.288.15.1898. [DOI] [PubMed] [Google Scholar]
- 2.Brinckmann P, Biggemann M, Hilweg D. Prediction of the compressive strength of human lumbar vertebrae. Spine. 1989;14:606–10. [PubMed] [Google Scholar]
- 3.Buckley JM. Mechanical Engineering PhD. Berkeley, CA: University of California at Berkeley; 2006. Non-invasive strength assessment of human thoracolumbar vertebrae; p. 201. [Google Scholar]
- 4.Cawte SA, Pearson D, Green DJ, Maslanka WB, Miller CG, Rogers AT. Cross-calibration, precision and patient dose measurements in preparation for clinical trials using dual energy X-ray absorptiometry of the lumbar spine. Br J Radiol. 1999;72:354–62. doi: 10.1259/bjr.72.856.10474496. [DOI] [PubMed] [Google Scholar]
- 5.Cheng XG, Nicholson PHF, Boonen S, Lowet G, Brys P, Aerssens J, VanderPerre G, Dequeker J. Prediction of vertebral strength in vitro by spinal bone densitometry and calcaneal ultrasound. Journal of Bone and Mineral Research. 1997;12:1721–1728. doi: 10.1359/jbmr.1997.12.10.1721. [DOI] [PubMed] [Google Scholar]
- 6.Cooper C, Atkinson EJ, O'Fallon WM, Melton LJ. Incidence of clinically diagnosed vertebral fractures: a population-based study in Rochester, Minnesota, 1985-1989. Journal of Bone and Mineral Research. 1992;7:221–227. doi: 10.1002/jbmr.5650070214. [DOI] [PubMed] [Google Scholar]
- 7.Crawford RP, Brouwers J, Keaveny TM. Accurate Prediction of Vertebral Strength using Voxel-Based Non-Linear Finite Element Models. Trans Ortho Res Soc. 2004;29:1123. [Google Scholar]
- 8.Crawford RP, Cann CE, Keaveny TM. Finite element models predict in vitro vertebral body compressive strength better than quantitative computed tomography. Bone. 2003;33:744–50. doi: 10.1016/s8756-3282(03)00210-2. [DOI] [PubMed] [Google Scholar]
- 9.Crawford RP, Keaveny TM. Relationship between axial and bending behaviors of the human thoracolumbar vertebra. Spine. 2004;29:2248–55. doi: 10.1097/01.brs.0000142435.90314.3b. [DOI] [PubMed] [Google Scholar]
- 10.Crawford RP, Rosenberg WS, Keaveny TM. Quantitative computed tomography-based finite element models of the human lumbar vertebral body: effect of element size on stiffness, damage, and fracture strength predictions. J Biomech Eng. 2003;125:434–8. doi: 10.1115/1.1589772. [DOI] [PubMed] [Google Scholar]
- 11.Cummings SR, Bates D, Black DM. Clinical use of bone densitometry - Scientific review. Jama-Journal of the American Medical Association. 2002;288:1889–1897. doi: 10.1001/jama.288.15.1889. [DOI] [PubMed] [Google Scholar]
- 12.Ebbesen EN, Thomsen JS, Beck-Nielsen H, Nepper-Rasmussen HJ, Mosekilde L. Vertebral bone density evaluated by dual-energy X-ray absorptiometry and quantitative computed tomography in vitro. Bone. 1998;23:283–90. doi: 10.1016/s8756-3282(98)00091-x. [DOI] [PubMed] [Google Scholar]
- 13.Edmondston SJ, Singer KP, Day RE, Price RI, Breidahl PD. Ex vivo estimation of thoracolumbar vertebral body compressive strength: the relative contributions of bone densitometry and vertebral morphometry. Osteoporos Int. 1997;7:142–8. doi: 10.1007/BF01623690. [DOI] [PubMed] [Google Scholar]
- 14.Eriksson SA, Isberg BO, Lindgren JU. Prediction of vertebral strength by dual photon absorptiometry and quantitative computed tomography. Calcified Tissue International. 1989;44:243–50. doi: 10.1007/BF02553758. [DOI] [PubMed] [Google Scholar]
- 15.Faulkner KG, Cann CE, Hasegawa BH. Effect of bone distribution on vertebral strength: assessment with patient-specific nonlinear finite element analysis. Radiology. 1991;179:669–74. doi: 10.1148/radiology.179.3.2027972. [DOI] [PubMed] [Google Scholar]
- 16.Granhed H, Jonson R, Hansson T. Mineral-Content and Strength of Lumbar Vertebrae - a Cadaver Study. Acta Orthopaedica Scandinavica. 1989;60:105–109. doi: 10.3109/17453678909150105. [DOI] [PubMed] [Google Scholar]
- 17.Haidekker MA, Andresen R, Werner HJ. Relationship between structural parameters, bone mineral density and fracture load in lumbar vertebrae, based on high-resolution computed tomography, quantitative computed tomography and compression tests. Osteoporos Int. 1999;9:433–40. doi: 10.1007/s001980050168. [DOI] [PubMed] [Google Scholar]
- 18.Hansson T, Roos B. The influence of age, height, and weight on the bone mineral content of lumbar vertebrae. Spine. 1980;5:545–51. doi: 10.1097/00007632-198011000-00010. [DOI] [PubMed] [Google Scholar]
- 19.Homminga J, Weinans H, Gowin W, Felsenberg D, Huiskes R. Osteoporosis changes the amount of vertebral trabecular bone at risk of fracture but not the vertebral load distribution. Spine. 2001;26:1555–61. doi: 10.1097/00007632-200107150-00010. [DOI] [PubMed] [Google Scholar]
- 20.Kopperdahl DL, Morgan EF, Keaveny TM. Quantitative computed tomography estimates of the mechanical properties of human vertebral trabecular bone. Journal of Orthopaedic Research. 2002;20:801–805. doi: 10.1016/S0736-0266(01)00185-1. [DOI] [PubMed] [Google Scholar]
- 21.Kopperdahl DL, Pearlman JL, Keaveny TM. Biomechanical consequences of an isolated overload on the human vertebral body. Journal of Orthopaedic Research. 2000;18:685–690. doi: 10.1002/jor.1100180502. [DOI] [PubMed] [Google Scholar]
- 22.Lewis G. Properties of acrylic bone cement: state of the art review. J Biomed Mater Res. 1997;38:155–82. doi: 10.1002/(sici)1097-4636(199722)38:2<155::aid-jbm10>3.0.co;2-c. [DOI] [PubMed] [Google Scholar]
- 23.Liebschner MA, Kopperdahl DL, Rosenberg WS, Keaveny TM. Finite element modeling of the human thoracolumbar spine. Spine. 2003;28:559–65. doi: 10.1097/01.BRS.0000049923.27694.47. [DOI] [PubMed] [Google Scholar]
- 24.Lochmuller EM, Burklein D, Kuhn V, Glaser C, Muller R, Gluer CC, Eckstein F. Mechanical strength of the thoracolumbar spine in the elderly: prediction from in situ dual-energy X-ray absorptiometry, quantitative computed tomography (QCT), upper and lower limb peripheral QCT, and quantitative ultrasound. Bone. 2002;31:77–84. doi: 10.1016/s8756-3282(02)00792-5. [DOI] [PubMed] [Google Scholar]
- 25.McBroom RJ, Hayes WC, Edwards WT, Goldberg RP, White AA. Prediction of vertebral body compressive fracture using quantitative computed tomography. Journal of Bone and Joint Surgery. 1985;67-A:1206–1214. [PubMed] [Google Scholar]
- 26.Melton LJ, Kan SH, Frye MA, Wahner HW, O'Fallon WM, Riggs BL. Epidemiology of vertebral fractures in women. Am J Epidemiology. 1989;129:1000–1011. doi: 10.1093/oxfordjournals.aje.a115204. [DOI] [PubMed] [Google Scholar]
- 27.Moro M, Hecker AT, Bouxsein ML, Myers ER. Failure load of thoracic vertebrae correlates with lumbar bone mineral density measured by DXA. Calcified Tissue International. 1995;56:206–9. doi: 10.1007/BF00298611. [DOI] [PubMed] [Google Scholar]
- 28.Mosekilde L, Bentzen SM, Ortoft G, Jorgensen J. The predictive value of quantitative computed tomography for vertebral body compressive strength and ash density. Bone. 1989;10:465–70. doi: 10.1016/8756-3282(89)90080-x. [DOI] [PubMed] [Google Scholar]
- 29.Mosekilde L, Mosekilde L. Sex differences in age-related changes in vertebral body size, density and biomechanical competence in normal individuals. Bone. 1990;11:67–73. doi: 10.1016/8756-3282(90)90052-z. [DOI] [PubMed] [Google Scholar]
- 30.Pye SR, Reid DM, Adams JE, Silman AJ, O'Neill TW. Radiographic features of lumbar disc degeneration and bone mineral density in men and women. Ann Rheum Dis. 2006;65:234–8. doi: 10.1136/ard.2005.038224. [DOI] [PMC free article] [PubMed] [Google Scholar]
- 31.Riggs BL, Melton L., Jr The worldwide problem of osteoporosis: insights afforded by epidemiology. Bone. 1995;17:505S–511S. doi: 10.1016/8756-3282(95)00258-4. [DOI] [PubMed] [Google Scholar]
- 32.Silva MJ, Keaveny TM, Hayes WC. Load sharing between the shell and centrum in the lumbar vertebral body. Spine. 1997;22:140–150. doi: 10.1097/00007632-199701150-00004. [DOI] [PubMed] [Google Scholar]
- 33.Singer K, Edmondston S, Day R, Breidahl P, Price R. Prediction of thoracic and lumbar vertebral body compressive strength: correlations with bone mineral density and vertebral region. Bone. 1995;17:167–74. doi: 10.1016/s8756-3282(95)00165-4. [DOI] [PubMed] [Google Scholar]
- 34.Sornay-Rendu E, Munoz F, Duboeuf F, Delmas PD. Disc space narrowing is associated with an increased vertebral fracture risk in postmenopausal women: the OFELY Study. J Bone Miner Res. 2004;19:1994–9. doi: 10.1359/JBMR.040904. [DOI] [PubMed] [Google Scholar]
- 35.Vesterby A, Mosekilde L, Gundersen HJG, Melsen F, Mosekilde L, Holem K, Sorensen S. Biologically meaningful determinants of the in vitro strength of lumbar vertebrae. Bone. 1991;12:219–224. doi: 10.1016/8756-3282(91)90044-j. [DOI] [PubMed] [Google Scholar]
- 36.Whealan KM, Kwak SD, Tedrow JR, Inoue K, Snyder BD. Noninvasive imaging predicts failure load of the spine with simulated osteolytic defects. J Bone Joint Surg Am. 2000;82:1240–51. doi: 10.2106/00004623-200009000-00004. [DOI] [PubMed] [Google Scholar]