

Abstract
Polychlorinated biphenyls (PCBs) and some organochlorine pesticides, which continue to be measurable in a high proportion of samples from the general population, have been found to alter thyroid hormone levels in animals and humans. However, studies of these relationships in adult men are limited and results across studies have been inconsistent. In the present study, we measured serum levels of 57 PCB congeners, dichlorodiphenyldichloroethylene (p,p′-DDE, a stable metabolite of DDT), and hexachlorobenzene (HCB), as well as free T4, total T3, and TSH, in 341 adult men recruited from an infertility clinic from 2000-2003. In multivariate linear regression, there were positive associations between p,p′-DDE and both free T4 and total T3, and an inverse association between p,p′-DDE and TSH. Conversely, for PCBs there was only a suggestive inverse association between PCB 153 and total T3 when potential confounding variables were considered. However, when results were additionally adjusted for p,p′-DDE, inverse associations with T3 were significant for PCB 138, PCB 153, sum of PCBs and three different PCB groupings, and HCB, while the positive associations between p,p′-DDE and T3 also remained. In conclusion, serum concentrations of PCBs, p,p′-DDE and HCB were associated with circulating thyroid hormone levels in adult men.
Keywords: DDE, hexachlorobenzene, hormone, PCB, thyroid
INTRODUCTION
Thyroid hormones affect virtually every tissue in the human body (Vander et al. 1998), and an imbalance in thyroid hormone levels can lead to a wide range of clinical conditions (Nussey and Whitehead 2001). Although the consequences of sub-clinical changes in thyroid hormones are currently not well understood (Boelaert and Franklyn 2005; Surks et al. 2004), factors associated with any alteration in thyroid hormone levels are of concern. Several environmental agents, most notably organochlorine pesticides and polychlorinated biphenyls (PCBs), have been found to influence thyroid hormone activity and metabolism (Zoeller 2005; Qatani et al. 2005; Bogazzi et al. 2003).
PCBs are a class of synthetic, persistent, lipophilic, halogenated aromatic compounds that were widely used in industrial and consumer products for decades until the late 1970’s. As a result of their extensive use and persistence, PCBs remain ubiquitous environmental contaminants. The general population is exposed primarily through ingestion of contaminated foods (e.g., fish, meat, and dairy products), as PCBs bioaccumulate up the food chain. However, exposure may also occur through dermal contact (soil and house dust) and inhalation (indoor air in residential buildings and workplaces, as well as outdoor air). For example, in the 1960s-1970s PCBs were used in sealants for commercial building construction, and high levels of PCBs have been found to remain in the caulking of some public buildings which may lead to contamination of indoor air and dust (Herrick et al. 2004).
Like PCBs, the organochlorine pesticides 1,1,1-trichloro-2,2-bis(p-chlorophenyl)ethane (DDT) and hexachlorobenzene (HCB) are no longer used in the US, but exposures still occur due to their strong persistence in the environment. A major environmental and biologic metabolite of DDT, 1,1-dichloro-2,2-bis(p-chlorophenyl)ethylene (p,p′-DDE), is also of concern for its toxicity in laboratory studies and because it is more persistent than DDT (ATSDR 2002a). Pesticides can be especially persistent in indoor environments, and recent studies have measured DDT and DDE in air and dust from US residences (Colt et al. 2004; Rudel et al. 2003). PCBs and organochlorine pesticides have long biological half-lives, and can be measured in the body months or years after an exposure has occurred (Maroni et al. 2000). As a result of their persistence and ubiquity, measurable levels of serum PCBs and organochlorine pesticides are found in a high proportion of the general population (Longnecker et al. 1997). Recently, the Second National Report on Human Exposure to Environmental Chemicals (NHANES 1999-2000) found detectable levels of p,p,′-DDE in over 90 percent of the general US population (CDC 2003).
There is much animal data on the potential for PCBs, p,p′-DDE and HCB to alter thyroid hormones (ATSDR 2002a; 2002b; 2000). In addition, several human studies have investigated associations between levels of these compounds in the body and thyroid hormone levels (Takser et al. 2005; Schell et al. 2004; Bloom et al. 2003; Hagmar 2003; Pelletier et al. 2002; Hagmar et al. 2001a; 2001b; Persky et al. 2001; Sala et al. 2000; Longnecker et al. 2000; Osius et al. 1999; Koopman-Esseboom et al. 1994; Emmett et al. 1988). However, study populations have differed greatly and results have not been consistent across studies. The present study was designed to investigate the association between serum levels of PCBs, p,p′-DDE, and HCB and circulating levels of thyroxine (T4), triiodothyronine (T3) and thyrotrophin (TSH) in adult men.
METHODS
Study subjects were men who were partners in subfertile couples seeking infertility diagnosis from the Vincent Burnham Andrology lab at Massachusetts General Hospital in Boston between January 2000 and May 2003. Consecutive eligible men between 20 and 54 years of age who presented to the Andrology Laboratory were recruited to participate. Of those approached, approximately 65 percent consented. Most men that declined to participate in the study cited lack of time on the day of their clinic visit as the reason for not participating. The study was approved by the Human Studies Institutional Review Boards of the Massachusetts General Hospital, Harvard School of Public Health, and University of Michigan.
Thyroid Hormones and TSH
One non-fasting blood sample was drawn between 9 am and 4 pm. Blood samples were centrifuged and serum stored at -80 °C until analysis. Free T4, Total T3, and TSH concentrations were determined in serum by microparticle enzyme immunoassay using an automated immunoassay system (AxSYM, Abbott Diagnostics, Abbott Park, IL USA). The assay sensitivity for free T4 and total T3 were 0.01 ng/dL and 0.15 ng/mL, respectively. The interassay CVs for both hormones were less than nine percent. For TSH, the ultrasensitive hTSH II assay was used with a functional sensitivity of 0.03 micro-international units per liter (μIU/L), and interassay CVs of less than eight percent.
Serum PCB, p,p′-DDE and HCB
Measurement of PCBs, p,p′-DDE and HCB in serum was conducted by the Organic Chemistry Analytical Laboratory, Harvard School of Public Health, and has been described previously (Hauser et al. 2003). Briefly, serum extracts were analyzed by gas chromatography with electron capture detection (GC/ECD) and quantified based on the response factors to an internal standard. Target analytes included 57 individual PCB congeners, p,p′-DDE, and HCB. Since PCB, p,p′-DDE and HCB partition according to the lipid content of tissues, and serum lipid levels vary between fasting and non-fasting states, a correction for serum lipids is needed for the valid interpretation of serum levels (Phillips et al. 1989). Thus, levels were also reported after standardizing for serum lipids as units of ng/g total lipids to allow for comparison with other studies. Percent lipid was measured for each serum sample gravimetrically by weighing an aliquot of sample extract evaporated to dryness.
Method detection limits (MDL) were determined as recommended by the US Environmental Protection Agency (EPA 1984). The MDL values for all PCB congeners were <0.05 ng/g, with most of the congeners <0.01 ng/g. The MDL for p,p′-DDE was higher because unfortified serum had high p,p′-DDE concentrations at 6.3 ng/g.
Statistical Analysis
Data analysis was performed using SAS version 9.1 (SAS Institute Inc., Cary, NC, USA). We chose to explore the relationship between thyroid hormones and three individual PCB congeners (PCBs 118, 138, and 153), as well as ΣPCBs. Analyses using the other individual PCB congeners were not conducted. In addition, an analysis of the relationship between thyroid hormones and groupings of PCBs was conducted based on structural and biological activity as previously proposed (Wolff et al. 1997). PCBs were grouped as follows: group 1, potentially estrogenic and weak phenobarbitol inducers (congeners 44, 49, 52, 101, 187, 174, 177, 157/201); group 2, potentially antiestrogenic and dioxin-like (congeners 95/66, 74, 77/110, 105/141, 118, 156, 167, 128, 138, 170); and group 3, Phenobarbital, CYP1A, and CYP2B inducers (congeners 99, 153, 180, 196/203, 183). Relationships between thyroid hormones and p,p′-DDE and HCB were also explored.
Multivariate linear regression was used to explore relationships between thyroid hormones and serum concentrations of PCBs, p,p′-DDE and HCB. The use of serum levels of lipophilic compounds standardized by serum lipids (by dividing serum concentration of the compound of interest by serum lipids) as an independent variable in epidemiologic models was recently shown to be highly prone to bias (Schisterman et al. 2005). Thus, we regressed thyroid hormone concentrations on wet weight serum levels of PCBs, p,p′-DDE and HCB and adjusted for serum lipids as a covariate. This non-standardized but ″adjusted″ approach displayed the least susceptibility to bias in most scenarios within a large simulation study (Schisterman et al. 2005). Concentrations of T4 and T3 closely approximated normality and were modeled untransformed, while the distribution of TSH concentration was transformed using the natural logarithm (ln) for statistical analyses. Serum PCB, p,p′-DDE and HCB concentrations were also ln-transformed in the statistical analysis. Inclusion of covariates (those under consideration included age, race, BMI, smoking, and timing of blood sample by season and time of day) was based on statistical and biologic considerations (Kleinbaum et al. 1998). To improve interpretability, the regression coefficients were back-transformed and expressed as a change in hormone levels for an interquartile range (IQR) increase in serum PCB or pesticide levels. For T4 and T3 (which were not ln-transformed) this was determined as the difference between the regression coefficient (which represented a change in thyroid hormone corresponding to an ln-unit change in contaminant level) multiplied by the ln-transformed 75th percentile contaminant concentration and the regression coefficient multiplied by the ln-transformed 25th percentile contaminant concentration. For TSH (which was ln-transformed), this was determined by dividing the 75th and 25th percentile concentrations followed by exponentiation of the resulting value to the power equal to the regression coefficient. In secondary sensitivity analyses, we assessed non-linear relationships by regressing the hormones on quintiles of exposure while adjusting for other covariates of interest.
RESULTS
Of the 358 men with PCB, p,p′-DDE and HCB measured in serum, we also had thyroid hormone and TSH levels in all but two of the men. In addition, fifteen subjects taking hormone medications were excluded. Among the remaining 341 subjects, the majority were white (84%) and had never smoked (72%). The mean (SD) age and BMI were 36 (5.3) years and 28 (5.1), respectively. The PCB congeners of interest, along with p,p′-DDE and HCB, were above the MDL in all samples. Distributions of lipid standardized and unadjusted (wet weight) concentrations of PCBs, p,p′-DDE and HCB are presented in table 1, and distributions of the thyroid hormones and TSH measured in serum are presented in table 2.
Table 1.
Table 1a. Distribution of lipid-standardized serum levels of p,p′-DDE, HCB and PCBs (ng/g lipid). N=341.
Table 1b. Distribution of p,p′-DDE, HCB and PCBs (ng/g of serum) and serum lipids (%). N=341.
| Geometric | Selected Percentiles |
|||||||
|---|---|---|---|---|---|---|---|---|
| Mean | 5th | 10th | 25th | 50th | 75th | 90th | 95th | |
| PCB-118 | 12.3 | 4.37 | 5.79 | 7.66 | 12.2 | 18.6 | 28.0 | 33.3 |
| PCB-138 | 33.2 | 14.3 | 17.0 | 22.2 | 31.2 | 47.1 | 74.6 | 91.6 |
| PCB-153 | 42.6 | 18.1 | 22.3 | 27.8 | 40.4 | 60.4 | 91.2 | 122 |
| Σ PCB | 222 | 98.1 | 122 | 153 | 212 | 308 | 436 | 566 |
| Σ Estrogenic PCBs (Group 1) | 16.1 | 6.83 | 7.91 | 10.6 | 15.7 | 22.4 | 33.4 | 45.0 |
| Σ Dioxin-like PCBs (Group 2) | 80.6 | 37.7 | 43.3 | 54.8 | 74.4 | 116 | 166 | 215 |
| Σ Enzyme-inducing PCBs (Group 3) | 90.6 | 37.1 | 47.0 | 60.0 | 87.8 | 129 | 181 | 257 |
| p,p′-DDE | 236 | 87.7 | 104 | 141 | 204 | 329 | 613 | 1230 |
| HCB | 15.6 | 8.52 | 9.44 | 11.7 | 14.9 | 20.1 | 27.4 | 35.5 |
| Geometric |
Selected Percentiles |
|||||||
| Mean | 5th | 10th | 25th | 50th | 75th | 90th | 95th | |
| PCB-118 | 0.060 | 0.022 | 0.026 | 0.036 | 0.060 | 0.096 | 0.14 | 0.18 |
| PCB-138 | 0.16 | 0.058 | 0.080 | 0.11 | 0.16 | 0.24 | 0.35 | 0.44 |
| PCB-153 | 0.21 | 0.075 | 0.10 | 0.14 | 0.20 | 0.30 | 0.45 | 0.55 |
| Σ PCB | 1.08 | 0.41 | 0.57 | 0.74 | 1.06 | 1.56 | 2.27 | 2.65 |
| Σ Estrogenic PCBs (Group 1) | 0.078 | 0.027 | 0.037 | 0.054 | 0.075 | 0.11 | 0.17 | 0.21 |
| Σ Dioxin-like PCBs (Group 2) | 0.22 | 0.097 | 0.11 | 0.15 | 0.22 | 0.33 | 0.48 | 0.60 |
| Σ Enzyme-inducing PCBs (Group 3) | 0.29 | 0.10 | 0.14 | 0.19 | 0.29 | 0.41 | 0.58 | 0.71 |
| p,p′-DDE | 1.14 | 0.38 | 0.48 | 0.67 | 0.97 | 1.69 | 2.88 | 5.94 |
| HCB | 0.075 | 0.039 | 0.045 | 0.057 | 0.074 | 0.098 | 0.13 | 0.16 |
| Serum lipids (%) | 0.48 | 0.23 | 0.29 | 0.39 | 0.51 | 0.64 | 0.76 | 0.85 |
Table 2.
Distribution of serum hormone levels (n=341)
| Hormone | Mean | Selected Percentiles |
||||||
|---|---|---|---|---|---|---|---|---|
| 5th | 10th | 25th | 50th | 75th | 90th | 95th | ||
| Free T4 (ng/dL) | 1.29 | 0.95 | 1.00 | 1.10 | 1.25 | 1.43 | 1.61 | 1.73 |
| Total T3 (ng/mL) | 0.98 | 0.72 | 0.77 | 0.83 | 0.96 | 1.09 | 1.22 | 1.29 |
| TSH(μIU/mL) | 1.68 | 0.59 | 0.78 | 1.04 | 1.44 | 1.94 | 2.71 | 3.57 |
p,p′DDE was moderately correlated with HCB and individual PCB congeners and groupings (Spearman correlation coefficients (r) ranged from 0.4 to 0.5; p-values < 0.05), while correlations between PCB congeners were high (r=0.6 to 0.8; p-values < 0.05). Age was inversely associated with both T4 and T3 (r = -0.23 and -0.18, respectively; p-values <0.05), while BMI was positively associated with TSH (r = 0.14; p-value < 0.05). Serum lipids were associated with BMI (r = 0.34), free T4 (r = -0.17), TSH (r = 0.14) and wet weight concentrations of all environmental compounds of interest (r ranged from 0.32 for p,p′-DDE to 0.43 for HCB; all p-values <0.05). Current smokers had higher median concentrations of total T3 but lower concentrations of TSH (1.07 ng/mL T3 and 1.1 μIU/mL TSH, respectively) than former (0.98 ng/mL and 1.4 μIU/mL) or never (0.96 ng/mL and 1.5 μIU/mL) smokers (p-values < 0.05 in students t-test). Samples collected in winter had median T4 concentrations slightly lower than those collected in spring, summer or fall (1.2 versus 1.3 ng/dL; p-value < 0.05). For the environmental compounds of interest, some of the demographic variables were associated with serum concentrations. Age was associated with serum concentrations of all compounds, with Spearman correlation coefficients ranging from 0.15 for HCB to 0.47 for Group 3 PCBs (all p-values < 0.05). Median wet weight ΣPCB concentrations were slightly lower in blood samples collected in the morning (0.98 ng/g serum) than those collected in the afternoon (1.09 ng/g; p-value < 0.05). Median PCB 118 concentrations were higher in samples collected in the winter (0.068 ng/g serum) compared to spring, summer or fall (0.054 ng/g; p-value < 0.05), and the median concentration of HCB was slightly higher in current smokers (0.092 ng/g serum) than nonsmokers (0.073 ng/g; p-value < 0.05).
For lipid-standardized serum concentrations, median p,p′-DDE concentrations were also slightly higher in blood samples collected in the morning (208 ng/g lipid) than those collected in the afternoon (198 ng/g lipid), but unlike the unadjusted (whole weight) analysis medians did not differ by smoking status and PCB 118 levels did not vary by season.
Results from bivariate (crude) and multivariate (adjusted) regression are presented in table 3. All regression coefficients in table 3 were adjusted for serum lipids as an independent variable (Schisterman et al. 2005). Many of the crude regression coefficients differed from coefficients that were adjusted for age, BMI, smoking and time of day blood sample was collected. In the crude results, PCB 138, PCB 153, ΣPCBs, and all three PCB groupings were inversely associated with total T3 and had similar coefficients. When the results were adjusted for the covariates of interest, only a suggestive inverse association between PCB 153 and total T3 remained, where an IQR increase in PCB 153 was associated with a 2.54 percent decline in total T3, (95% confidence interval [CI] -5.56% to 0.48%). Conversely, p,p′-DDE was associated with increased free T4 and total T3, and inversely associated with TSH in the adjusted results. Based on the median values of these hormones (1.25 ng/dL, 0.96 ng/mL and 1.44 μIU/mL, respectively), an IQR increase in p,p′-DDE was associated with a 2.89 percent increase in T4 (95%CI 0.37% to 5.48%), a 3.47 percent increase in T3 (95%CI 1.16% to 5.88%), and a 7.65% decline in TSH (95%CI -14.4% to -0.46%).
Table 3.
Crude† and adjusted‡ coefficients (95% CI) for a change in thyroid hormone level§ associated with an interquartile range increase in serum PCB, DDE, or HCB#. N=341.
| Analyte# | Crude† | Adjusted‡ | ||||
|---|---|---|---|---|---|---|
| Free T4†† | Total T3†† | TSH‡‡ | Free T4†† | Total T3†† | TSH‡‡ | |
| PCB118 | -0.015 (-0.057, 0.028) | -0.010 (-0.040, 0.022) | 0.98 (0.89, 1.09) | -0.010 (-0.055, 0.035) | -0.002 (-0.034, 0.026) | 0.93 (0.84, 1.04) |
| PCB138 | -0.010 (-0.047, 0.027) | -0.036 (-0.054, -0.001)** | 0.94 (0.86, 1.03) | 0.015 (-0.025, 0.054) | -0.018 (-0.046, 0.011) | 0.92 (0.84, 1.01)* |
| PCB153 | -0.007 (-0.043, 0.030) | -0.036 (-0.062, -0.009)** | 0.93 (0.86, 1.02) | 0.027 (-0.014, 0.067) | -0.024 (-0.053, 0.005)* | 0.92 (0.84, 1.01)* |
| ΣPCB | -0.017 (-0.055, 0.021) | -0.036 (-0.063, -0.008)** | 0.94 (0.86, 1.03) | 0.017 (-0.025, 0.060) | -0.022 (-0.053, 0.008) | 0.93 (0.84, 1.03) |
| Group1 | -0.009 (-0.041, 0.024) | -0.025 (-0.049, -0.001)** | 0.94 (0.87, 1.02) | 0.018 (-0.017, 0.056) | -0.015 (-0.041, 0.011) | 0.94 (0.86, 1.02) |
| Group2 | -0.018 (-0.058, 0.022) | -0.032 (-0.060, -0.002)** | 0.95 (0.87, 1.05) | 0.008 (-0.035, 0.051) | -0.022 (-0.053, 0.009) | 0.93 (0.84, 1.03) |
| Group3 | -0.014 (-0.052, 0.023) | -0.038 (-0.065, -0.011)** | 0.95 (0.87, 1.03) | 0.025 (-0.018, 0.068) | -0.024 (-0.055, 0.007) | 0.95 (0.85, 1.05) |
| p,p-DDE | 0.017 (-0.014, 0.048) | 0.022 (0.000, 0.044)* | 0.93 (0.87, 1.00)* | 0.036 (0.005, 0.068)** | 0.033 (0.011, 0.056)** | 0.92 (0.86, 1.00)** |
| HCB | 0.011 (-0.027, 0.049) | -0.015 (-0.043, 0.012) | 0.95 (0.87, 1.04) | 0.021 (-0.018, 0.060) | -0.018 (-0.046, 0.010) | 0.95 (0.87, 1.04) |
p<0.1
p<0.05
†Adjusted for serum lipids (%) as a covariate.
‡Adjusted for serum lipids (%), age, BMI, current smoking, and time of blood draw (morning vs. afternoon).
§Log-transformation of TSH concentration was used. Free T4 and Total T3 concentrations were modeled untransformed.
In all models ln-transformations of serum concentrations of organochlorine pesticides / PCBs were used.
Coefficient represents the change in hormone level for an IQR change in pesticide/PCB concentration after back-transformation of the pesticide/PCB concentrations. For an IQR change in pesticide/PCB concentration, a coefficient equal to 0 indicates no change in hormone level, a coefficient < 0 indicates a decrease in hormone level, and a coefficient > 0 indicates an increase in hormone level.
Coefficient represents a multiplicative change in hormone level for an IQR change in pesticide/PCB concentration after back-transformation of both hormone and pesticide/PCB concentrations. For an IQR change in pesticide/PCB concentration, a coefficient equal to 1.0 indicates no change in hormone level, a coefficient < 1.0 indicates a multiplicative decrease in hormone level, and a coefficient > 1.0 indicates a multiplicative increase in hormone level.
When multiple regression models for p,p′-DDE and thyroid hormones were also adjusted for serum levels of HCB and PCBs, the previously observed associations remained and effect estimates for p,p′-DDE were stable. On the other hand, when multiple regression models for HCB, PCBs and total T3 were adjusted for serum levels of p,p′-DDE, effect estimates for HCB and PCBs became stronger (table 4). For example, the coefficient for PCB 153 in the adjusted model was -0.024 ng/mL (table 3), equivalent to a 2.5 percent decline in total T3. When p,p′-DDE was added to the model, the coefficient became -0.038 ng/mL (Table 4), equivalent to a 4.0 percent decline in total T3 (95%CI -7.0 to -0.9%). Despite the moderate correlation between p,p′-DDE and HCB or PCBs there was no evidence of collinearity (i.e. standard errors and 95% confidence intervals did not become inflated). When an interaction term for p,p′-DDE and HCB or PCBs (e.g., p,p′-DDE*HCB) were also added to the models there was no evidence of interaction. Lastly, results of the quintile analyses are presented in figures 1 and 2. Several but not all observed relationships were monotonic as serum contaminant levels increased. However, there was still suggestive evidence of dose-response trends among the associations that did not appear to be monotonic.
Table 4.
Adjusted† regression coefficients (95% CI) for change in Total T3 associated with an interquartile range increase in serum contaminant levels when also adjusted for p,p′-DDE concentration. N=341.
| Analyte | Analyte Coefficient (95% CI) | p,p′-DDE Coefficient (95% CI) |
|---|---|---|
| PCB118 | -0.020 (-0.053, 0.015) | 0.038 (0.014, 0.062)** |
| PCB138 | -0.032 (-0.061, -0.003)** | 0.041 (0.018, 0.064)** |
| PCB153 | -0.038 (-0.067, -0.008)** | 0.041 (0.018, 0.065)** |
| ΣPCB | -0.034 (-0.066, -0.004)** | 0.039 (0.016, 0.062)** |
| Group1 | -0.028 (-0.055, -0.002)** | 0.041 (0.018, 0.065)** |
| Group2 | -0.033 (-0.065, -0.002)** | 0.039 (0.016, 0.062)** |
| Group3 | -0.032 (-0.062, -0.001)** | 0.037 (0.014, 0.060)** |
| HCB | -0.034 (-0.062, -0.005)** | 0.042 (0.018, 0.066)** |
p<0.1
p<0.05
Adjusted for p,p′-DDE concentration, serum lipids, age, BMI, current smoking, and time of blood draw (morning vs. afternoon).
Figure 1.
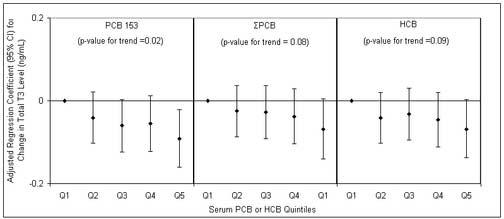
Regression coefficients (diamonds) and 95% confidence intervals for a change in total T3 associated with increasing quintiles of selected PCBs (PCB 153 and ΣPCB) or HCB in serum. Adjusted for serum lipids, log-transformed p,p′-DDE, age, BMI, smoking and time of blood draw.
Figure 2.
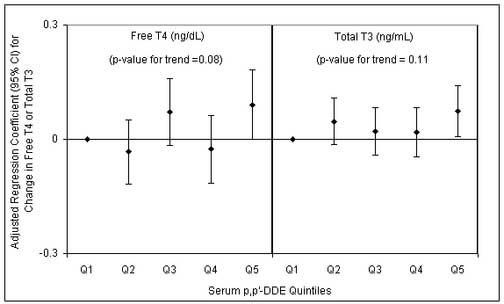
Regression coefficients (diamonds) and 95% confidence intervals for a change in free T4 or total T3 associated with increasing quintiles of serum p,p′-DDE. Adjusted for serum lipids, age, BMI, smoking and time of blood draw.
Because most studies standardize contaminant concentrations for lipid content prior to analyzing the data, we conducted a secondary analysis using lipid-standardized values in the multivariate models. Overall results were similar to those presented, although a few of the associations were slightly weaker (results not shown). These slight differences may reflect the introduction of additional measurement error when using lipid-standardized values.
DISCUSSION
In the present study we found inverse associations between total T3 and serum levels of HCB, PCB 153, and all PCB congener groupings (ΣPCBs, estrogenic PCBs, dioxin-like PCBs, and CYP inducing PCBs) when also taking into account each individual′s p,p′-DDE concentration. We also found that p,p′-DDE was associated with increased free T4 and total T3, and inversely associated with TSH. Studies on adverse health effects associated with small changes in thyroid hormones in humans are limited (Boelaert and Franklyn 2005; Surks et al. 2004), and the changes found in the present study may not be clinically important at the individual level. However, due to the pervasiveness of exposure to these compounds there may be consequences related to small changes in thyroid hormone levels among entire subsets of the population.
Serum levels of environmental chemicals in the present study were comparable to those reported in the most recent Third National Report on Human Exposure to Environmental Chemicals (CDC 2005). In samples collected from US males age 12 and older in years 2000-2001, lipid standardized p,p′-DDE had a median of 245 ng/g lipid compared to a median of 204 ng/g lipid in the present study. Likewise, lipid adjusted PCB 138 and PCB 153 had median levels of 20.1 ng/g lipid and 28.5 ng/g lipid in males from the Third National Report compared to 14.3 ng/g lipid and 18.1 ng/g lipid in the present study, respectively. HCB was measured in less than 5 percent of samples in the Third Report, so the distribution could not be compared with that in the present study.
Findings from previous human studies have been conflicting. Human studies on PCBs and thyroid hormones are rather numerous, while studies of p,p′-DDE and thyroid hormones are limited. Studies in men on the relationship of thyroid hormones with both PCBs and p,’p-DDE is limited. Consistent with our results, a small study among 16 obese men that underwent a 15-week weight loss program reported that T3 levels were significantly and inversely related to plasma concentrations of several PCB congeners and HCB (Pelletier et al. 2002). The associations for PCBs remained after adjusting for confounding by weight loss, as weight loss is independently associated with decreased T3 and with increased concentrations of lipophilic compounds, such as organochlorines, that are released from adipose tissue during fat mobilization which leads to increased concentrations in circulating blood. Conversely, a study of 110 Swedish fishermen reported no associations between PCBs, HCB, DDT or p,p′-DDE and thyroid hormones (Hagmar et al. 2001a), while a study of 178 U.S. men that had fished in the Great Lakes reported an inverse association between PCBs and total T4 but no association with total T3 (Persky et al. 2001).
Although relationships between these compounds and thyroid status in children, women, or pregnant women may not be comparable to results in men, we briefly describe this literature since it represents the majority of studies in humans. Consistent with our results was a recent Canadian study of 149 pregnant women found a significant inverse relationship between low, environmental levels of HCB, PCB 153 and ΣPCBs in plasma and total T3, but no associations with free T4 and TSH (Takser et al. 2005). Likewise, inverse associations between PCBs and T3 levels were also previously observed in the wives of Swedish fishermen (Hagmar et al. 2001b) and in German schoolchildren (Osius et al. 1999), while another study among Dutch women reported an inverse association with T3 that was also accompanied by an inverse association with T4 and a positive association with TSH (Sala et al. 2001). Other studies have reported an inverse association between PCBs, and T4 and/or a positive association between PCBs and TSH, with no association between PCBs and total T3 (Schell et al. 2004; Hagmar 2003; Persky et al. 2001; Emmett et al. 1988), while another reported no associations between PCBs and thyroid hormones among 160 neonates from North Carolina from 1978 to 1982 (Longnecker et al. 2000).
Our observation of an association between p,p′-DDE and increased free T4 and total T3, and decreased TSH, appears to be unique. Inconsistent with our findings were results from two other human studies that found no associations between p,p′-DDE and thyroid hormones in adult men (Hagmar et al. 2001a; Persky et al. 2001). Also inconsistent with our results but consistent with what they reported for HCB and PCBs, Takser et al. (2005) found an inverse association between p,p′-DDE and total T3 with no associations between p,p′-DDE and free T4 or TSH in pregnant women. Based on the limited amount of available human data, the association between p,p′-DDE and thyroid hormones needs to be explored in other epidemiologic studies to support or refute our findings.
No association between HCB and thyroid hormones was reported in one study among Swedish fishermen (Hagmar et al. 2001a), while several other human studies have reported associations. A study among 608 adults in Spain living near an organochlorine factory that produced HCB found a significant inverse association between serum HCB levels and total T4 (Sala et al. 2001). Total T3 levels were not measured in the study. Interestingly, however, they found no associations between HCB and free T4 or TSH. Using preliminary data from 66 men in the New York State Angler Cohort Study, Bloom et al. (2003) also reported an inverse relationship between serum HCB levels and total T4. The study did not measure free T4, total T3 or TSH. In addition, as described earlier, inverse associations between plasma HCB levels and total T3 were reported in obese men following participation in a weight loss program (Pelletier et al. 2002) and among pregnant women (Takser et al. 2005). Finally, although animal (rat) studies on HCB and thyroid function primarily show declines in T4 and increases in TSH (ATSDR 2002b), a study among hamsters dosed with HCB found a marked decrease in T3 levels (and significant increase in sodium iodide uptake) while T4 levels remained unchanged (Smith et al. 1987).
There are several postulated mechanisms for the effect of PCBs and organochlorine pesticides on thyroid hormone levels. For example, PCBs may activate the nuclear receptor constitutive androstane receptor (CAR) which in turn induces enzymes involved in thyroid hormone metabolism, including uridine 5′-diphosphate-glucuronosyltransferase (UGT) and sulfotransferase (SULT). This may lead to increased hepatic metabolism of thyroid hormones and altered levels of thyroid hormones (Qatanani et al. 2005). Environmental contaminants may also affect the binding of thyroid hormones to thyroid receptors, resulting in an alteration in the expression of genes sensitive to thyroid hormones (Bogazzi et al. 2003). This may then affect thyroid hormone metabolism and alter circulating thyroid hormone levels. However, these mechanisms are most likely to manifest as altered T4 and TSH levels due to compensatory production/secretion of T4 or TSH to maintain homeostasis. The majority of T3 in humans is derived from the enzymatic removal of an iodine atom from T4 by deiodinases (Vander et al. 1998; Nussey and Whitehead 2001), signifying that a decrease in T3 should also be accompanied by a decrease in T4. Also, altered thyroid hormone levels give rise to increased or decreased TSH secretion from the anterior pituitary through negative feedback, so studies that observe altered levels of thyroid hormones should also see inversely altered levels of TSH. Thus, the results reported for PCBs and HCB in the present study suggest an alternative mechanism that affects T3 in a more isolated manner.
It is now thought that environmental chemicals have very complex interactions with the thyroid hormone receptor, producing complex effects on hormone signaling (Zoeller 2005). Thus, it is reasonable that mechanisms explaining the inverse association of HCB and PCBs with total T3, but which were not accompanied by associations with T4 or TSH, are unclear at this time. Takser et al. (2005) discussed several potential but unproven mechanisms in an attempt to explain the independent inverse associations of T3 with PCBs and organochlorine pesticides, namely that they may affect the deiodination of thyroid hormones by inducing or increasing type 3 deiodinase expression leading to increased T3 degradation; or, due to their structural similarities to thyroid hormones, these environmental contaminants may bind to thyroid hormone binding proteins (thyroid-binding globulin, transthyretin, and/or albumin) which may ultimately alter circulating T3 levels. Our findings that p,p′-DDE was associated with increased T4 and total T3, but decreased TSH, may suggest a reverse effect of DDT or p,p′-DDE on one or more of these mechanisms, such as inhibition of deiodinase activity. More studies involving PCBs and organochlorine pesticides and these potential pathways are needed for a better understanding of how these chemicals may affect thyroid hormone levels in humans. Similar to the study by Takser et al. (2005), a limitation of the present study was the measurement of only free T4, total T3 and TSH. Future studies should also measure total T4 and free T3 levels which may provide additional mechanistic clues.
In conclusion, we found inverse relationships between total T3 and PCBs and HCB in adult men, results which were consistent with recent studies among obese men and pregnant women as well as earlier studies of fishermen′s wives and schoolchildren. However, these results are inconsistent with a number of other human studies that reported associations with only T4 and/or TSH, or found no associations with any thyroid hormones. In contrast, we found p,p′-DDE was associated with increased free T4, increased total T3 and decreased TSH, findings which have not been reported elsewhere in previous studies. Future studies should aim to elucidate these associations.
Acknowledgments
This work was supported by grants ES09718 and ES00002 from the National Institute of Environmental Health Sciences (NIEHS), National Institutes of Health (NIH).
Abbeviations
- BMI
body mass index
- CYP
cytochrome P450
- DDT
1,1,1-trichloro-2,2-bis(p-chlorophenyl)ethane
- HCB
hexachlorobenzene
- MDL
method detection limit
- NHANES
national health and nutrition examination survey: p,p′-DDE, 1,1-dichloro-2,2-bis(p-chlorophenyl)ethylene
- PCB
polychlorinated biphenyl
- T3
triiodothyronine
- T4
thryoxine
- TSH
thyroid stimulating hormone (thyrotrophin)
- US
United States
Footnotes
Publisher's Disclaimer: This is a PDF file of an unedited manuscript that has been accepted for publication. As a service to our customers we are providing this early version of the manuscript. The manuscript will undergo copyediting, typesetting, and review of the resulting proof before it is published in its final citable form. Please note that during the production process errors may be discovered which could affect the content, and all legal disclaimers that apply to the journal pertain.
REFERENCES
- ATSDR . Toxicological Profile for DDT, DDE and DDD. Agency for Toxic Substances and Disease Registry; Atlanta, GA: 2002a. [PubMed] [Google Scholar]
- ATSDR . Toxicological Profile for Hexachlorobenzene. Agency for Toxic Substances and Disease Registry; Atlanta, GA: 2002b. [PubMed] [Google Scholar]
- ATSDR . Toxicological Profile for Polychlorinated Biphenyls (PCBs) Agency for Toxic Substances and Disease Registry; Atlanta, GA: 2000. [PubMed] [Google Scholar]
- Bloom MS, Weiner JM, Vena JE, Beehler GP. Exploring associations between serum levels of select organochlorines and thyroxine in a sample of New York state sportsmen: the New York State Angler Cohort Study. Environ Res. 2003;93:52–66. doi: 10.1016/s0013-9351(02)00085-3. [DOI] [PubMed] [Google Scholar]
- Boelaert K, Franklyn JA. Thyroid hormone in health and disease. J Endocrinol. 2005;187:1–15. doi: 10.1677/joe.1.06131. [DOI] [PubMed] [Google Scholar]
- Bogazzi F, Raggi F, Ultimieri F, Russo D, Campomori A, McKinney JD, Pinchera A, Bartalena L, Martino E. Effects of a mixture of polychlorinated biphenyls (Aroclor 1254) on the transcriptional activity of thyroid hormone receptor. J Endocrinol Invest. 2003;26:972–8. doi: 10.1007/BF03348194. [DOI] [PubMed] [Google Scholar]
- CDC . Second National Report on Human Exposure to Environmental Chemicals. Centers for Disease Control and Prevention; Washington, DC: 2003. [Google Scholar]
- CDC . Third National Report on Human Exposure to Environmental Chemicals. Centers for Disease Control and Prevention; Washington, DC: 2005. [Google Scholar]
- Colt JS, Lubin J, Camann D, Davis S, Cerhan J, Severson RK, Cozen W, Hartge P. Comparison of pesticide levels in carpet dust and self-reported pest treatment practices in four US sites. J Expo Anal Environ Epidemiol. 2004;14:74–83. doi: 10.1038/sj.jea.7500307. [DOI] [PubMed] [Google Scholar]
- Emmett EA, Maroni M, Jefferys J, Schmith J, Levin BK, Alvares A. Studies of transformer repair workers exposed to PCBs: II. Results of clinical laboratory investigations. Am J Ind Med. 1988;14:47–62. doi: 10.1002/ajim.4700140107. [DOI] [PubMed] [Google Scholar]
- EPA . Definition and procedure for the determination of the method detection limit, revision 1.11 49. U.S. Environmental Protection Agency; Washington, DC: 1984. [Google Scholar]
- Hagmar L. Polychlorinated biphenyls and thyroid status in humans: a review. Thyroid. 2003;13:1021–8. doi: 10.1089/105072503770867192. [DOI] [PubMed] [Google Scholar]
- Hagmar L, Bjork J, Sjodin A, Bergman A, Erfurth EM. Plasma levels of persistent organohalogens and hormone levels in adult male humans. Arch Environ Health. 2001a;56:138–43. doi: 10.1080/00039890109604065. [DOI] [PubMed] [Google Scholar]
- Hagmar L, Rylander L, Dyremark E, Klasson-Wehler E, Erfurth EM. Plasma concentrations of persistent organochlorines in relation to thyrotropin and thyroid hormone levels in women. Int Arch Occup Environ Health. 2001b;74:184–8. doi: 10.1007/s004200000213. [DOI] [PubMed] [Google Scholar]
- Hauser R, Chen Z, Pothier L, Ryan L, Altshul L. The relationship between human semen parameters and environmental exposure to polychlorinated biphenyls and p,p′-DDE. Environ Health Perspect. 2003;111:1505–11. doi: 10.1289/ehp.6175. [DOI] [PMC free article] [PubMed] [Google Scholar]
- Herrick RF, McClean MD, Meeker JD, Baxter LK, Weymouth GA. An unrecognized source of PCB contamination in schools and other buildings. Environ Health Perspect. 2004;112:1051–3. doi: 10.1289/ehp.6912. [DOI] [PMC free article] [PubMed] [Google Scholar]
- Kleinbaum DG, Kupper LL, Muller KE, Nizam A. Applied regression analysis and other multivariate methods. 3rd ed. Brooks/Cole Publishing Company; Pacific Grove, CA: 1998. Selecting the best regression equation. [Google Scholar]
- Koopman-Esseboom C, Morse DC, Weisglas-Kuperus N, Lutkeschipholt IJ, Van der Paauw CG, Tuinstra LG, Brouwer A, Sauer PJ. Effects of dioxins and polychlorinated biphenyls on thyroid hormone status of pregnant women and their infants. Pediatr Res. 1994;36:468–73. doi: 10.1203/00006450-199410000-00009. [DOI] [PubMed] [Google Scholar]
- Longnecker MP, Gladen BC, Patterson DG, Jr., Rogan WJ. Polychlorinated biphenyl (PCB) exposure in relation to thyroid hormone levels in neonates. Epidemiology. 2000;11:249–54. doi: 10.1097/00001648-200005000-00004. [DOI] [PubMed] [Google Scholar]
- Longnecker MP, Rogan WJ, Lucier G. The human health effects of DDT (dichlorodiphenyltrichloroethane) and PCBS (polychlorinated biphenyls) and an overview of organochlorines in public health. Annu Rev Public Health. 1997;18:211–44. doi: 10.1146/annurev.publhealth.18.1.211. [DOI] [PubMed] [Google Scholar]
- Maroni M, Colosio C, Ferioli A, Fait A. Biological Monitoring of Pesticide Exposure: a review. Introduction. Toxicology. 2000;143:1–118. doi: 10.1016/s0300-483x(99)00152-3. [DOI] [PubMed] [Google Scholar]
- Nussey S, Whitehead S. Endocrinology: an integrated approach. Bios Scientific Publishers Ltd; Oxford: 2001. [PubMed] [Google Scholar]
- Osius N, Karmaus W, Kruse H, Witten J. Exposure to polychlorinated biphenyls and levels of thyroid hormones in children. Environ Health Perspect. 1999;107:843–9. doi: 10.1289/ehp.99107843. [DOI] [PMC free article] [PubMed] [Google Scholar]
- Pelletier C, Doucet E, Imbeault P, Tremblay A. Associations between weight loss-induced changes in plasma organochlorine concentrations, serum T(3) concentration, and resting metabolic rate. Toxicol Sci. 2002;67:46–51. doi: 10.1093/toxsci/67.1.46. [DOI] [PubMed] [Google Scholar]
- Persky V, Turyk M, Anderson HA, Hanrahan LP, Falk C, Steenport DN, Chatterton R, Jr., Freels S. The effects of PCB exposure and fish consumption on endogenous hormones. Environ Health Perspect. 2001;109:1275–83. doi: 10.1289/ehp.011091275. [DOI] [PMC free article] [PubMed] [Google Scholar]
- Phillips DL, Pirkle JL, Burse VW, Bernert JT, Jr., Henderson LO, Needham LL. Chlorinated hydrocarbon levels in human serum: effects of fasting and feeding. Arch Environ Contam Toxicol. 1989;18:495–500. doi: 10.1007/BF01055015. [DOI] [PubMed] [Google Scholar]
- Qatanani M, Zhang J, Moore DD. Role of the constitutive androstane receptor in xenobiotic-induced thyroid hormone metabolism. Endocrinology. 2005;146:995–1002. doi: 10.1210/en.2004-1350. [DOI] [PubMed] [Google Scholar]
- Rudel RA, Camann DE, Spengler JD, Korn LR, Brody JG. Phthalates, alkylphenols, pesticides, polybrominated diphenyl ethers, and other endocrine-disrupting compounds in indoor air and dust. Environ Sci Technol. 2003;37:4543–53. doi: 10.1021/es0264596. [DOI] [PubMed] [Google Scholar]
- Sala M, Sunyer J, Herrero C, To-Figueras J, Grimalt J. Association between serum concentrations of hexachlorobenzene and polychlorobiphenyls with thyroid hormone and liver enzymes in a sample of the general population. Occup Environ Med. 2001;58:172–7. doi: 10.1136/oem.58.3.172. [DOI] [PMC free article] [PubMed] [Google Scholar]
- Schell LM, Gallo MV, DeCaprio AP, Hubicki L, Denham M, Ravenscroft J. Thyroid function in relation to burden of PCBs, p,p ′-DDE, HCB, mirex and lead among Akwesasne Mohawk youth: a preliminary study. Environ Toxicol Phar. 2004;18:91–99. doi: 10.1016/j.etap.2004.01.010. [DOI] [PubMed] [Google Scholar]
- Schisterman EF, Whitcomb BW, Louis GM, Louis TA. Lipid adjustment in the analysis of environmental contaminants and human health risks. Environ Health Perspect. 2005;113:853–7. doi: 10.1289/ehp.7640. [DOI] [PMC free article] [PubMed] [Google Scholar]
- Smith AG, Dinsdale D, Cabral JR, Wright AL. Goitre and wasting induced in hamsters by hexachlorobenzene. Arch Toxicol. 1987;60:343–9. doi: 10.1007/BF00295753. [DOI] [PubMed] [Google Scholar]
- Surks MI, Ortiz E, Daniels GH, Sawin CT, Col NF, Cobin RH, Franklyn JA, Hershman JM, Burman KD, Denke MA, Gorman C, Cooper RS, Weissman NJ. Subclinical thyroid disease: scientific review and guidelines for diagnosis and management. Jama. 2004;291:228–38. doi: 10.1001/jama.291.2.228. [DOI] [PubMed] [Google Scholar]
- Takser L, Mergler D, Baldwin M, de Grosbois S, Smargiassi A, Lafond J. Thyroid hormones in pregnancy in relation to environmental exposure to organochlorine compounds and mercury. Environ Health Perspect. 2005;113:1039–45. doi: 10.1289/ehp.7685. [DOI] [PMC free article] [PubMed] [Google Scholar]
- Vander A, Sherman J, Luciano D. Human physiology: the mechanisms of body function. Seventh edition McGraw-Hill; Boston: 1998. [Google Scholar]
- Wolff MS, Camann D, Gammon M, Stellman SD. Proposed PCB congener groupings for epidemiological studies. Environ Health Perspect. 1997;105:13–4. doi: 10.1289/ehp.9710513. [DOI] [PMC free article] [PubMed] [Google Scholar]
- Zoeller RT. Environmental chemicals as thyroid hormone analogues: new studies indicate that thyroid hormone receptors are targets of industrial chemicals? Mol Cell Endocrinol. 2005;242:10–5. doi: 10.1016/j.mce.2005.07.006. [DOI] [PubMed] [Google Scholar]