Abstract
Simultaneous or prior exposure to one chemical may alter the concurrent or subsequent response to another chemical, often in unexpected ways. This is particularly true when the two chemicals share common mechanisms of action. The present study uses the paradigm of prior exposure to study the interactive toxicity between inorganic mercury (Hg2+) and trichloroethylene (TRI) or its metabolite S-(1,2-dichlorovinyl)-L-cysteine (DCVC) in rat and human proximal tubule. Pretreatment of rats with a subtoxic dose of Hg2+ increased expression of glutathione S-transferase-α1 (GSTα1) but decreased expression of GSTα2, increased activities of several GSH-dependent enzymes, and increased GSH conjugation of TRI. Primary cultures of rat proximal tubular (rPT) cells exhibited both necrosis and apoptosis after incubation with Hg2+. Pretreatment of human proximal tubular (hPT) cells with Hg2+ caused little or no changes in GST expression or activities of GSH-dependent enzymes, decreased apoptosis induced by TRI or DCVC, but increased necrosis induced by DCVC. In contrast, pretreatment of hPT cells with TRI or DCVC protected from Hg2+ by decreasing necrosis and increasing apoptosis. Thus, whereas pretreatment of hPT cells with Hg2+ exacerbated cellular injury due to TRI or DCVC by shifting the response from apoptosis to necrosis, pretreatment of hPT cells with either TRI or DCVC protected from Hg2+-induced cytotoxicity by shifting the response from necrosis to apoptosis. These results demonstrate that by altering processes related to GSH status, susceptibilities of rPT and hPT cells to acute injury from Hg2+, TRI, or DCVC are markedly altered by prior exposures.
Keywords: inorganic mercury, trichloroethylene, interactive toxicity, apoptosis, necrosis, human proximal tubular cells, rat proximal tubular cells
Introduction
The study of chemical mixtures is an important, evolving subdiscipline of toxicology (Carpenter et al., 1998). Although mechanisms of toxicity are typically studied by exposure of a test system to a single chemical, the reality is that environmental contaminants rarely occur in isolation but generally exist as complex mixtures containing two or more components. Mechanisms of interactions between the various components of a mixture are often difficult to discern. As knowledge about specific mechanisms of action of individual chemicals increases, however, it becomes possible to test plausible hypotheses about how the presence of multiple chemicals alters cellular responses. For example, induction or inhibition of an enzyme responsible for the metabolism of one chemical by another chemical provides a mechanistic basis for understanding the cellular response to the combined or sequential presence of the two chemicals. Further, if two chemicals share a common mechanism of action (e.g., production of an oxidative stress), then prior or concurrent exposure to one chemical may be expected to alter the susceptibility of the target organ to the other chemical.
In the present studies, we assessed the interaction of the environmental contaminant trichloroethylene (TRI) and its penultimate, nephrotoxic metabolite S-(1,2-dichlorovinyl)-L-cysteine (DCVC) with inorganic mercury (Hg2+) in rat and human proximal tubules. We hypothesize that prior exposure of rat or human proximal tubular (rPT or hPT, respectively) cells to one of the toxicants will influence the handling and acute cytotoxicity response from exposure to one of the other toxicants. The following discussion summarizes key mechanistic findings relating to Hg2+-, TRI-, and DCVC-induced nephrotoxicity that provide a basis for our hypothesis.
The kidneys are the primary organs that accumulate Hg2+ and exhibit toxic effects after in vivo exposures to Hg2+ (Zalups, 1993). Within the kidneys, Hg2+ accumulates selectively along the three segments of the proximal tubule (Zalups, 1991a, 1991b). Our recent studies in suspensions of freshly isolated rPT cells confirm that these cells accumulate Hg2+ following exposure to HgCl2 or to various mercuric conjugates of thiols (Lash et al., 1998a) and these cells undergo necrotic cell death after exposure to Hg2+ with a very steep dose-response curve (Lash and Zalups, 1992). Both protein and non-protein sulfhydryl-containing compounds bind Hg2+ with high affinity and are the major ligands for Hg2+ in both the extracellular and intracellular space (Zalups and Lash, 1994). The cellular content of thiols, particularly that of glutathione (GSH), can modulate the intracellular uptake, cellular accumulation, and toxicity of Hg2+ in the renal proximal tubule (Baggett and Berndt, 1986; Berndt et al., 1985; Burton et al., 1995; de Ceaurriz et al., 1994; Girardi and Elias, 1993; Lash et al., 1998a, 1999a; Zalups and Lash, 1997). Conversely, prior exposure of rats to Hg2+ alters cellular GSH status, with subtoxic concentrations increasing and toxic concentrations depleting GSH concentrations in the cortex and outer stripe of the outer medulla (Lash and Zalups, 1996; Zalups and Lash, 1990). Exposure of rat kidney to subtoxic doses of methyl mercury up-regulates GSH synthesis (Woods and Ellis, 1995; Woods et al., 1992). Although prior exposure of rats to Hg2+ also increases renal activities of several GSH-dependent enzymes and intrarenal concentrations of GSH (Lash and Zalups, 1996; Zalups and Lash, 1990), the same type of regulatory responses as shown by Woods and colleagues for methyl mercury have not been examined for Hg2+. Hg2+ also produces oxidative stress in renal cortical mitochondria (Lund et al., 1993).
Humans may be exposed to mercury in its various forms, including Hg2+, from breathing contaminated air, ingesting contaminated water and food, and by having dental and medical treatments. Hg2+ has been identified in at least 714 of the 1,467 SuperFund National Priorities List sites identified by the U.S. Environmental Protection Agency (ATSDR, 1999). Thus, besides being an occupational concern, due the widespread use of mercurials in various industrial processes, Hg2+ is a public health concern as well.
TRI is an environmental and industrial pollutant whose toxicity and carcinogenicity have been demonstrated in several animal species, including humans (Davidson and Beliles, 1991). The kidneys are one target organ for TRI, although much controversy exists about its importance for humans, as significant species differences exist in susceptibility (Lash et al., 2000a). Renal effects of TRI are generally attributed to its conjugation with GSH and subsequent metabolism within the proximal tubules to generate DCVC, which is further metabolized to a reactive intermediate (Lash et al., 2000b). Thus, the renal disposition and toxicity of TRI are dependent on GSH status (Lash et al., 1995a, 1998b). DCVC-induced cytotoxicity in rPT and hPT cells occurs by both necrosis and apoptosis, with the former being a relatively high-dose (≥ 100 μM) response and the latter being a relatively low-dose (≤ 100 μM) and early (≤ 8 h) response (Cummings and Lash, 2000; Cummings et al., 2000a; Lash et al., 1995a; Lash et al., 2001a, 2001b). Mitochondria are a prominent and early target for DCVC-induced cytotoxicity in renal proximal tubules (Lash et al., 1995a, 2001a).
Hence, mechanistic studies of Hg2+- and TRI- or DCVC-induced toxicity in the kidneys demonstrate several common pathways and responses, including the kidneys as a primary target organ, a role for GSH in metabolism, transport, and cellular response, production of an oxidative stress, and the potent and early targeting of mitochondria. Accordingly, we hypothesize that these common, mechanistic features provide one level of rationale that prior exposure of rat or human kidneys to either Hg2+, TRI, or DCVC will influence the cellular response to a subsequent exposure to one of the chemicals. Additional rationale for studying interactions among Hg2+ and TRI or its metabolite DCVC, is that both Hg2+ and TRI are likely to be found together in many of the designated SuperFund waste sites. Thus, joint exposure is likely.
Initial studies were conducted in rat kidney and rPT cells to further establish the rationale to conduct studies in hPT cells, using the paradigm of prior exposure to one chemical followed by subsequent exposure to another chemical. All of our previous data on the metabolic and toxic effects of Hg2+ have been obtained with tissue or cells from rats. Although much of our previous studies with TRI and its metabolite DCVC have been conducted in rat proximal tubules, the more recent work has been done in human proximal tubules. This is important because rats are not a good surrogate, test species for humans in terms of their response to chemicals such as TRI. After demonstrating that exposure of rat kidney, both in vivo and in vitro, to Hg2+ produces changes in expression of enzymes or other processes that are likely to affect the metabolism and/or toxicity of TRI or DCVC, studies were then conducted in hPT cells. hPT cells were pretreated with either Hg2+ or TRI (DCVC) and then incubated with TRI (DCVC) or Hg2+, respectively, to determine whether the order of exposure influences the cellular response. The results show that prior exposures to one of the three chemicals markedly alters susceptibility to subsequent exposures and that results vary significantly with the order by which cells are exposed to the chemicals.
Methods
Chemicals and reagents
TRI was purchased from Sigma Chemical Co. (Cat. No. T4928, ACS reagent, > 99.5% purity). DCVG, DCVC, and NAcDCVC were synthesized from TRI and GSH, L-cysteine, or N-acetyl-L-cysteine, respectively, in sodium metal and liquid ammonia as described previously (Elfarra et al., 1986). Purity (> 95%) was assessed by HPLC and thin layer chromatography and confirmed by 1H-NMR. Antibodies for GSTα(A) and GSTP were purchased from Oxford Biomedical (Oxford, MI). Antibody for GSTT was purchased from Biotrin International (Newton, MA). Note that the convention used for naming GST isoforms is that Greek letters are used for rat enzymes whereas Arabic letters are used for the analogous human enzymes. The GSTα(A) antibody was a polyclonal goat anti-rat GST Ya antibody, prepared against affinity-purified rat liver GST Ya, is specific for rat and human GSTα(A), and cross-reacts with neither GSTμ(M) nor GSTπ(P) class isoforms; the GSTP antibody was a polyclonal rabbit anti-human GST P1-1 antibody, prepared against recombinant human GST P1-1 that was expressed in E. coli, is specific for rat and human GSTπ(P), and cross-reacts with neither GSTμ(M) nor GSTα(A) class isoforms; the GSTT antibody was a polyclonal rabbit anti-human GSTT antibody, prepared against purified human liver GSTT2, is specific for rat and human GSTθ(T), and cross-reacts with neither GSTα(A), GSTπ(P), nor GSTμ(M) class isoforms. Expression of GSTM in hPT cells was not determined because previous work showed that these cells express GSTA, GSTP, and GSTT, but not GSTM (Cummings et al., 2000b). All other chemicals for cell isolation and culture and for various assays were purchased from commercial vendors and were of the highest purity available.
Studies in rats
Male Fischer 344 rats (200-250 g; Charles River Laboratories, Wilmington, MA) were used for both in vivo studies examining the effect of pretreatment with a subtoxic dose of Hg2+ on GST expression and activities of GSH-dependent activities and for isolation of rPT cells. Rats were allowed to acclimate for at least three days prior to conducting any studies, fed commercial rat chow and water ad libitum, and housed in a temperature-, humidity-, and light-controlled (12-hr light/dark cycle) environment in the Wayne State University vivarium. All studies were approved by the institutional Animal Investigation Committee and were conducted according to NIH guidelines. For the in vivo Hg2+-pretreatment studies, rats were given either an ip injection of 0.5 μmol HgCl2/kg body weight in normal saline, which produces no signs of nephrotoxicity (Zalups and Lash, 1990), or normal saline as a control. After 24 or 48 h, rats were anesthetized with sodium pentobarbital (50 mg/kg body weight), kidneys were removed, and cortex and outer stripe of the outer medulla were homogenized in 3 ml of buffer (250 mM sucrose, 10 mM triethanolamine/HCl, pH 7.6, 1 mM EDTA Na2, 0.1 mM phenylmethylsulfonyl fluoride) per g tissue using a Teflon-glass device. Homogenates were initially centrifuged at 9,000 × g for 20 min. Supernatants were then centrifuged for 60 min at 105,000 × g. The resulting supernatants (cytosolic fractions) were used for enzyme assays or Western blot analyses and stored at -80°C until use.
Isolation and primary culture of rPT cells
rPT cells were isolated from male Fischer 344 rats by collagenase perfusion and Percoll density-gradient centrifugation, as described previously (Lash and Tokarz, 1989; Lash et al., 1995b). Typical yield of rPT cells from two rat kidneys is 40-50 × 106 cells. Only cells that exclude > 90% trypan blue or exhibit < 10% leakage of lactate dehydrogenase (LDH) were used for subsequent studies either as freshly isolated cells in suspension or for primary culture. For studies with suspensions of freshly isolated cells, cells were suspended in Krebs-Henseleit buffer containing 25 mM NaHCO3, 25 mM HEPES, and 2% (w/v) bovine serum albumin. Incubations with cell suspensions were conducted in polypropylene Erlenmeyer flasks on a Dubnoff metabolic shaking incubator (60 cycles/min) under an atmosphere of 95% O2/5% CO2 at 37°C.
Isolation and primary culture of hPT cells
hPT cells were isolated from fresh human kidneys by a modification of the procedure described by Todd et al. (1995) as described previously (Cummings and Lash, 2000; Cummings et al., 2000b). Typical yield of hPT cells from one human kidney is 500-800 × 106 cells. Only cells that exclude > 90% trypan blue or exhibit < 10% leakage of LDH were used for subsequent primary culture. Human kidneys were purchased from Life Legacy Foundation (Tucson, AZ; formerly International Bioresearch Solutions). Kidney tissue was determined to be normal by a pathologist (i.e., derived from non-cancerous, non-diseased tissue) and was screened for HIV, hepatitis A, B, and C, and CMV. Kidneys were perfused with Wisconsin medium and kept on wet ice until they arrived at the laboratory, which was within 24 h of removal from the donor. Age, gender, and race information, but no other identifying information, was obtained. Because tissue was generally obtained from accident victims or those who have died from cardiovascular incidents and the tissue was rejected for use in transplants (generally because of excessive glomerulosclerosis or arterial plaque), we restricted our donors to adults (age ≥ 21 years).
Cell culture medium and general cell culture procedures
Basal medium and supplements for rPT and hPT primary culture were as described previously (Cummings et al., 2000b; Lash et al., 1995b). Basal medium was a 1:1 mixture of Dulbecco’s modified Eagle’s medium : Ham’s F-12 (DMEM : F-12) without serum. Medium was supplemented with 15 mM HEPES, pH 7.4, 20 mM NaHCO3, antibiotics for Day-0 through Day-3 only (192 IU penicillin G/ml + 200 μg streptomycin sulfate/ml) to inhibit bacterial growth, 2.5 μg amphotericin B/ml to inhibit fungal growth, 5 μg bovine insulin/ml (= 0.87 μM), 5 μg human transferrin/ml (= 66 nM), 30 nM sodium selenite, 100 ng hydrocortisone/ml (= 0.28 μM), 100 ng epidermal growth factor/ml (= 17 nM), and 7.5 pg 3,3′,5-triiodo-DL-thyronine/ml (= 111 nM). Medium was prepared from powder using doubly-distilled, deionized water. Before addition of supplements, medium was filtered through 0.22-μm porosity cellular acetate membrane filters for sterilization.
rPT and hPT cells were seeded at densities of 1 × 10⁶ cells/ml on Vitrogen-coated, 35-mm dishes or polystyrene culture flasks (T-25 or T-75), depending on the needs of the experiment (= Day 0). Volumes were 1.5 ml, 3 ml, and 11 ml for 35-mm dishes, T-25 flasks, and T-75 flasks, respectively. Cultures were grown at 37°C in a humidified incubator under an atmosphere of 95% air/5% CO2 at pH 7.4. After 24 h (= Day-1), dishes or flasks were washed with PBS to remove unattached cells (generally 50 to 60%, based on protein content in dishes and media; Lash et al., 1995b) and fresh medium was added. Medium was changed every two days thereafter until confluence (generally by Day 4-6). After Day-3, antibiotics were omitted from medium as they inhibit growth. When necessary, cells were harvested from dishes by either scraping the plates with a Teflon scraper or by brief treatment with trypsin-EDTA. All experiments were performed with confluent cells.
Metabolism and enzyme assays
All incubations for metabolism and enzyme assays were performed at 37°C. GSH-dependent enzyme activities [γ-glutamylcysteine synthetase (GCS), GSH peroxidase (GPX) with 0.25 mM H2O2 as substrate, GSH S-transferase (GST) with 1 mM 1-chloro-2,4-dinitrobenzene as substrate, and glutathione disulfide reductase (GRD)] were measured by spectrophotometric assays as described previously (Cummings et al., 2000b). GSH conjugation of TRI to form DCVG was measured by HPLC (Lash et al., 1999b) after derivatization to form the N-dinitrophenyl derivative. Derivatives were detected by absorbance at 365 nm and were compared to authentic standards (limit of detection = 50 pmol).
Western blot analyses of GSTα expression in rat kidney cytoplasm and GSTA, GSTP, and GSTT expression in hPT cells
GST isozyme expression levels were detected by subjecting samples derived from rat kidney cytoplasm or total cell extracts of hPT cells to SDS-PAGE on a 10% slab gel followed by electrophoretic transfer of material separated on the gel to nitrocellulose membranes (Cummings et al., 2000c). The membranes were then immunostained with the appropriate antibody. Alkaline phosphatase staining intensity was determined by densitometry using Image J software.
Assay of necrosis by LDH release and activity
Cell death by necrosis was determined by measurement of either the release of LDH from cells or by decreases in total LDH activity (Lash and Zalups, 1992; Lash et al., 1995b). To measure LDH release in cell cultures, LDH activity was determined in media and, after removal of media, washing of cells with PBS, and solubilization of cells with 0.1% (v/v) Triton X-100, in total cells, by addition of pyruvate and NADH and following the decrease in A340. The fraction of LDH release was calculated by the formula: % LDH release = [LDH activity in media/(LDH activity in media + LDH activity in total cells)] × 100%. For most experiments involving pretreatment or treatment with Hg2+, cellular necrosis was assessed by decreases in total LDH activity instead of LDH release, because Hg2+ directly inhibits LDH (Lash and Zalups, 1992). We showed in our previous study that Hg2+-induced decreases in total LDH activity correspond to other indices of cell death by necrosis and could thus be used as a marker. Total LDH activity was calculated as the sum of activity in the media and that in total solubilized cells, using the extinction coefficient for NADH of 6,220 mM-1 cm-1.
Assay of apoptosis by propidium iodide staining and flow cytometry
Cell cultures were washed twice with sample buffer (PBS plus glucose (1 g/l) filtered through a 0.22-μm filter), dislodged by trypsin/EDTA (0.1% w/v) incubation, centrifuged at 400 × g for 10 min, and resuspended in sample buffer. Cell concentrations were adjusted to 1 to 3 × 10⁶ cells/ml with sample buffer and 1 ml of cell suspension was centrifuged at 400 × g for 10 min. All of the supernatant except 0.1 ml/106 cells was removed and the remaining cells were mixed on a vortex mixer in the remaining fluid for 10 sec. Next, 1 ml of ice-cold ethanol (70%, v/v) was added to the sample drop by drop, with samples being mixed for 10 sec between drops. The tubes were capped and fixed in ethanol at 4°C. After fixation, cells were stained in propidium iodide (50 μg/ml) containing RNase A (100 U/ml). Samples were then mixed, centrifuged at 1,000 × g for 5 min and all the ethanol except 0.1 ml was removed. Cells were mixed in the residual ethanol and 1 ml of the propidium iodide staining solution was added to each tube. After mixing again, cells were incubated at room temperature for at least 30 min. Samples were analyzed within 24 hr by flow cytometry using a Becton Dickinson FACSCalibur Flow Cytometer, which is a core facility of the NIEHS Center for Molecular Toxicology with Human Application at Wayne State University. Analysis was performed with 20,000 events per sample using the ModFit LT v. 2 for Macintosh data acquisition software package (Verity Software House, Inc., Topsham, ME; distributed by Becton Dickinson Immunocytometry System BDIS, San Jose, CA). Propidium iodide was detected by the FL-2 photomultiplier tube. Fractions of apoptotic cells were quantified by analysis of the sub-G1 (sub-diploid) peak with ModFit cell cycle analysis. The percent distribution of cells in the various stages of the cell cycle (G0/G1, S, G2/M) were also calculated. Cell aggregates were discarded in the flow cytometry analysis by post-fixation aggregate discrimination.
Protein determination and data analysis
Protein concentrations were measured with the bicinchoninic acid protein determination kit from Sigma. All values are means ± SE of measurements made on the indicated number of separate preparations. Significant differences between means for data were first assessed by a one-way analysis of variance. When significant “F values” were obtained, the Fisher’s protected least significance t test was performed to determine which means were significantly different from one another, with two-tail probabilities < 0.05 considered significant.
Results
Studies in rat kidney and primary cultures of rPT cells
Experiments were first conducted in the rat to provide further evidence for a basis for studying interactions between Hg2+ and TRI and its nephrotoxic metabolite DCVC. Limited studies were conducted in rats and primary cultures of rPT cells to examine the influence of pretreatments with Hg2+ on GSH-dependent metabolism and to establish the acute cytotoxicity of Hg2+ in primary cultures of rPT cells.
Effects of pretreatment of rats with a subtoxic concentration of HgCl2 on renal GSH-dependent enzymes and GSH conjugation of TRI
Male F344 rats were given an ip injection of either saline (= Control) or a subtoxic dose of HgCl2 (0.5 μmol/kg body weight). After 24 or 48 h, cytoplasm was isolated from kidney cortical homogenates by differential centrifugation and levels of expression of GSTα protein were determined by Western blot analysis (Figure 1). No effects were observed in GSTα1 or GSTα2 protein levels after 24 h of exposure to Hg2+. In contrast, a 48-h exposure to Hg2+ increased GSTα1 protein levels by approximately 50% but decreased GSTα2 protein levels by approximately 50%.
Figure 1. Effects of pretreatment with Hg2+ on GSTα expression in rat kidney cytoplasm.
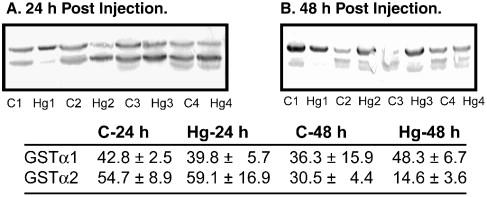
Rats were pretreated ip with a non-toxic dose of HgCl2 (0.5 μmol/kg) for 24 or 48 h. Expression of GSTα isoforms were determined by immunoblot analysis, using a polyclonal antibody to rat GSTα, which recognizes both GSTα1 (top band) and GSTα2 (lower band). Densities of bands were determined with Image J software (v. 1.34s). In some samples, a third band was visible below the GSTα2 band. This band was not identified, but was attributed to minor cross-reactivity. Band density results are means ± SE of measurements from 4 separate control rats and 4 separate Hg2+-treated rats at each time point.
To further assess effects of Hg2+ pretreatment on renal GSH status, rats were pretreated for 24 or 48 h with 0.5 μmol HgCl2/kg body weight, renal cortical cytoplasm was isolated, and activities of four GSH-dependent enzymes were measured (Table 1). Specific activities of each of the four enzymes, GST, GRD, GPX, and GCS, were significantly increased at both time points by pretreatment with Hg2+. The extent of the increases varied somewhat among the enzymes, ranging from 25% to 75%. The increase in GST activity is consistent with the increased expression of GSTα1 protein expression.
Table 1. Effect of pretreatment with Hg2+ on activities of GSH-dependent enzymes in rat kidney cytoplasm.
Male Fischer 344 rats were given an ip injection of either saline (Con, control) or 0.5 μmol HgCl2/kg (Hg2+). After 24 or 48 h, enzyme activities (mU/mg protein) were determined in kidney cytoplasm by spectrophotometric assays. Results are means ± SE of measurements from 4 separate control and Hg2+-treated rats at each time point.
| Con-O h | Con-24 h | Hg2+-24 h | |
|---|---|---|---|
| GST | 48.0±1.7 | 44.9±4.0 | 65.5±6.3* |
| GRD | 50.3±4.0 | 50.8±7.3 | 69.5±2.1* |
| GPX | 40.3±3.3 | 38.5±3.2 | 57.1±2.7* |
| GCS | 51.2±3.8 | 51.0±4.0 | 73.0±4.7* |
| C-48 h | Hg2+-48 h | ||
| GST | 44.2±2.3 | 54.9±2.0* | |
| GRD | 50.5±3.8 | 69.0±7.0* | |
| GPX | 42.9±5.0 | 63.7±4.0* | |
| GCS | 47.5±2.1 | 89.1±4.2* | |
Significantly different (P < 0.05) from the corresponding control sample.
These results showing increased GSH-dependent metabolism after exposure to Hg2+ support the hypothesis that low or subtoxic doses of Hg2+ alter cellular GSH and antioxidant defense status in rat kidney. These findings then led us to the hypothesis that prior exposure to low or subtoxic doses of Hg2+ will influence the GSH-dependent metabolism of or cellular response to other chemicals whose metabolism involves GSH or whose mechanism of toxicity involves alterations of GSH status, such as TRI. To test the hypothesis that prior exposure to a sub-toxic dose of Hg2+ alters GSH-dependent metabolism of TRI, cytoplasm from rat kidney cortex of control and Hg2+-pretreated rats were incubated with TRI for up to 60 min and formation of DCVG was measured (Figure 2). Preincubation of rats with Hg2+ produced 25% to 60% increases in rates of DCVG formation, depending on TRI concentration and preincubation time. Analysis of the kinetics of DCVG formation by Eadie-Hofstee plots showed that preincubation with Hg2+ produced little change in Km for TRI but increased Vmax by 55% and 34% after 24 h and 48 h of Hg2+ preincubation, respectively (Table 2).
Figure 2. Effects of pretreatment with Hg2+ on GSH conjugation of TRI in rat kidney cytoplasm.
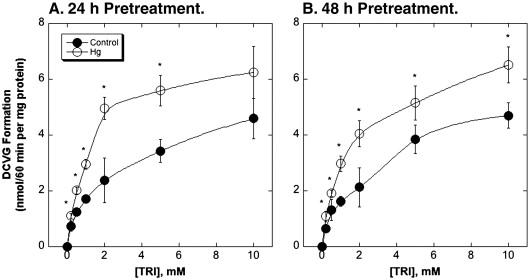
Rats were pretreated ip with a non-toxic dose of HgCl2 (0.5 μmol/kg) for 24 or 48 h. Cytoplasm was isolated from rat kidney cortex of either control or Hg2+-pretreated rats by differential centrifugation. GSH conjugation of TRI was measured by incubating cytoplasm (1 mg protein/ml) with 5 mM GSH and the indicated concentrations of TRI at 37°C for up to 60 min. Reactions were stopped by addition of 10% (w/v) perchloric acid and acid extracts were analyzed for formation of DCVG by ion-exchange HPLC. Results, given for 60-min incubations, are the means ± SE of measurements from separate cytoplasm preparations from 4 control and 4 Hg2+-pretreated rats. *Significantly different (P < 0.05) from corresponding incubations from control rat kidneys.
Table 2. Kinetics of GSH conjugation of TRI in rat kidney cytoplasm from control and Hg2+-pretreated rats.
Male Fischer 344 rats were given an ip injection of either saline (Con, control) or 0.5 μmol HgCl2/kg (Hg2+). After 24 or 48 h, cytoplasm was isolated from kidney cortex of each pretreatment group and were incubated with 5 mM GSH and 0.2 to 10 mM TRI for up to 60 min. Kinetic parameters are derived from Eadie-Hofstee (E-H) plots of the V vs. S data shown in Fig. 2.
| E-H regression equation; R2 | Vmax (nmol DCVG/60 min per mg) | Km (mM TRI) | |
|---|---|---|---|
| Control-24 h | Y=3.490-0.762X; R2=0.831 | 4.58 | 1.31 |
| Hg2+-24 h | Y=6.045-0.852X; R2=0.936 | 7.10 | 1.17 |
| Control-48 h | Y=3.086-0.616X; R2=0.799 | 5.01 | 1.62 |
| Hg2+-48 h | Y=5.744-0.857X; R2=0.946 | 6.70 | 1.17 |
Hg2+ increases activities of GSH-dependent enzymes in primary cultures of rPT cells
To assess whether similar responses to Hg2+ preincubation can be achieved in primary cell cultures, confluent, rPT cell primary cultures were preincubated for 24 h with various concentrations of HgCl2 and activities of four key GSH-dependent enzymes were measured (Figure 3). At the lowest concentration of Hg2+ used (0.5 μM), GST specific activity was increased by 81% and GRD activity was increased by 248% as compared to control cells. Although GCS activity was not significantly increased by preincubation of rPT cells with 0.5 μM Hg2+, it was significantly increased at all other concentrations of Hg2+, with a maximal increase of 115% at 5 μM Hg2+. GST activity exhibited a maximal increase of 165% at 1 μM Hg2+. In contrast, GPX activity was not significantly changed by any concentration of Hg2+.
Figure 3. Effects of pretreatment of primary cultures of rPT cells with Hg2+ on activities of GSH-dependent enzymes.
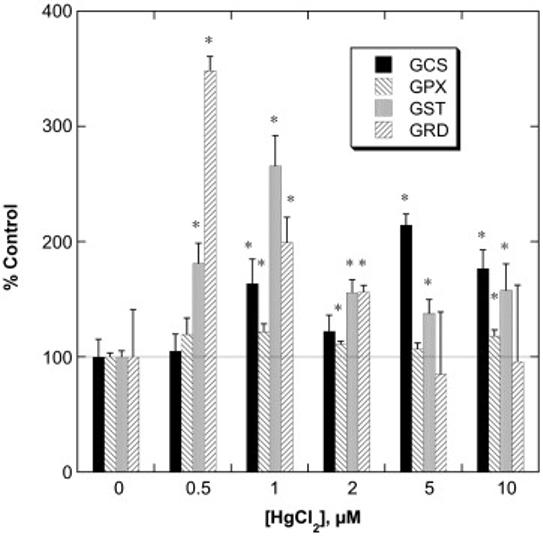
Confluent, primary cultures of rPT cells were incubated with the indicated concentrations of HgCl2 for 24 h. Activities of γ-glutamylcysteine synthetase (GCS), glutathione peroxidase (GPX), glutathione S-transferase (GST), and glutathione disulfide reductase (GRD) were measured in cellular homogenates by spectrophotometric assays. Control activities (= 100%; in mU/mg protein) were 611 ± 93, 237 ± 8, 64.0 ± 3.4, and 2.40 ± 0.99 for GCS, GPX, GST, and GRD, respectively. Results are expressed as the percent of control ± SE for measurements from 3 separate cultures for each concentration of Hg2+. *Significantly different (P < 0.05) from the corresponding control sample.
Hg2+ is a potent inducer of necrosis and apoptosis in primary cultures of rPT cells
To assess the potential cytotoxicity of Hg2+ in primary cultures of rPT cells, cells were incubated for 24 h with 0.5 to 10 μM HgCl2 and cell death was assessed by either necrosis or apoptosis. Incubation of rPT cells with HgCl2 caused a concentration-dependent decrease in total LDH activity, indicating cellular necrosis (Figure 4). The lowest concentration of HgCl2 reduced LDH activity by 27%. Even a Hg2+ concentration as low as 1 μM reduced LDH activity by > 50%, indicating a marked degree of necrosis. Consistent with these results, 0.5 μM Hg2+ caused a very modest increase in the proportion of apoptotic cells (Figure 5), indicating that under appropriate conditions, Hg2+ can also cause apoptosis in rPT cells. Moreover, 1 μM Hg2+ not only produced a marked increase in the proportion of subdiploid cells but also resulted in detachment of >50% of the cells from the culture surface. Thus, primary cultures of rPT cells are very sensitive to Hg2+-induced cytotoxicity.
Figure 4. Hg2+-induced inactivation of LDH activity in primary cultures of rPT cells.
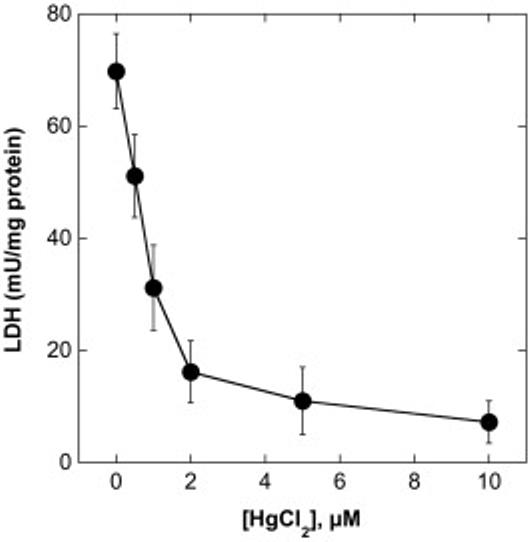
Confluent, primary cultures of rPT cells were grown on 35-mm culture dishes and were incubated with the indicated concentrations of HgCl2 for 24 h. Cellular necrosis was determined by measurement of total LDH activity. Results are means ± SE of measurements from 4 to 6 separate cell cultures.
Figure 5. Hg2+-induced apoptosis in primary cultures of rPT cells.
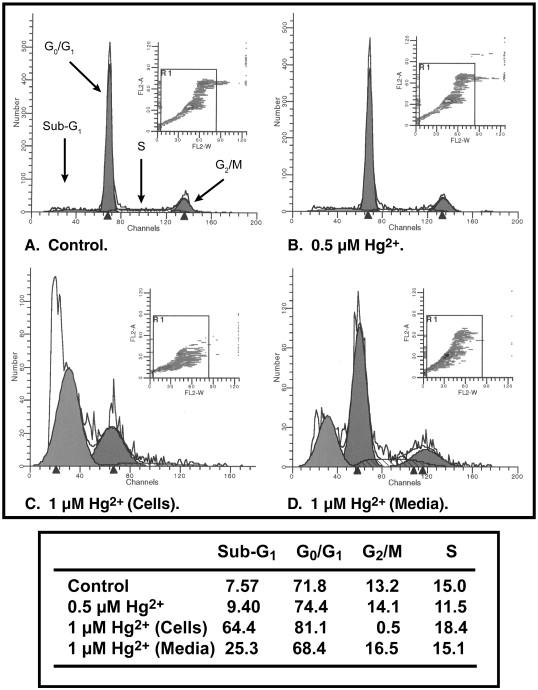
Confluent, primary cultures of rPT cells were grown on 35-mm culture dishes and were incubated with either media (= Control) or 0.5 μM or 1 μM HgCl2 for 24 h. At 1 μM HgCl2, a significant portion of cells became detached from the growth surface. Accordingly, cells remaining on the culture dish and those that were detached after treatment with 1 μM HgCl2 were separately analyzed. Apoptosis and cell cycle distribution were assessed by staining with propidium iodide and flow cytometry with a Becton Dickinson FACSCalibur flow cytometer. Peaks from left to right represent apoptotic (sub-G1) cells and cells in G0/G1, G2/M, and S phases. Insets: Distribution of cells according to fluorescence intensity. Cells outside the box were those excluded from analysis due to aggregation. Values in the table are the percentage of cells undergoing apoptosis and the fraction of cells in each phase of the cell cycle.
Studies in primary cultures of hPT cells
Having established that pretreatment of both rats in vivo and rPT cells in vitro with Hg2+ increases activities of several GSH-dependent enzymes and GSH conjugation of TRI, and that primary cultures of rPT cells are highly sensitive to Hg2+-induced necrosis and apoptosis at concentrations in the range of 0.5 to 1 μM, we extended our studies on the interactions between Hg2+ and TRI and its nephrotoxic metabolite DCVC to hPT cells. Although there is a large database of work on both Hg2+ and TRI with rat tissues, the poor ability to use data from rodents for human health risk assessment argues for the need to conduct studies with human tissue.
Effect of Hg2+ pretreatment on GST activity and expression in hPT cells
Unlike rPT cells, which only express GSTα (Cummings et al., 2000c), hPT cells express three isoforms of GST, GSTA, GSTP, and GSTT (Cummings et al., 2000b). In contrast to the induction of GSTα1 in rat kidney cytoplasm by pretreatment with Hg2+, expression of none of the three isoforms of GST in hPT cells was altered by a 24-h pretreatment with 0.5 μM HgCl2 (Figure 6).
Figure 6. Effects of pretreatment of primary cultures of hPT cells with Hg2+ on GST isoenzyme expression.
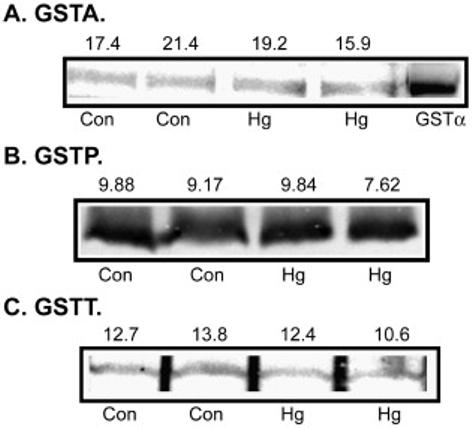
Confluent, primary cultures of hPT cells were grown on collagen-coated T-25 flasks and were incubated with 0.5 μM HgCl2 for 24 h. Expression of GSTA (A), GSTP (B), and GSTT (C) were determined in total cell extracts by immunoblot analysis, using polyclonal antibodies specific for each GST isoenzyme. For GSTA, an additional sample of purified rat GSTα was run. Numbers above each panel represent total pixel densities of each band as determined with Image J software.
Assessment of effects of a 24- and 48-h pretreatment of hPT cells with Hg2+ on activities of GSH-dependent enzymes also showed that hPT cells are less responsive than rPT cells (Table 3). Activity of none of the four GSH-dependent enzymes was altered by a 24-h pretreatment with Hg2+. After a 48-h exposure to 0.5 μM HgCl2, the only enzyme activity that exhibited a significant increase was GRD, which was increased by 31% as compared to that in untreated hPT cells.
Table 3. Effect of pretreatment of primary cultures of hPT cells with Hg2+ on activities of GSH-dependent enzymes.
hPT cells at ∼75% confluence were incubated with either media (Con, control) or 0.25 μM HgCl2 (Hg2+). After 24 or 48 h, enzyme activities (mU/mg protein) were determined in total cell extracts by spectrophotometric assays. Results are means ± SE of measurements from 12-14 separate control and 8-10 separate Hg2+-treated cultures at each time point.
| Con-24 h | Con-48 h | Hg2+-24 h | Hg2+-48 h | |
|---|---|---|---|---|
| GST | 72.9 ± 11.0 | 76.2 ± 18.6 | 64.0 ± 9.3 | 70.9 ± 11.5 |
| GRD | 53.9 ± 11.5 | 40.8 ± 3.6 | 44.7 ± 6.1 | 58.7 ± 8.6* |
| GPX | 33.6 ± 5.6 | 45.9 ± 11.7 | 22.4 ± 5.9 | 31.1 ± 8.0 |
| GCS | 22.2 ± 3.0 | 33.4 ± 4.4 | 20.6 ± 4.2 | 28.6 ± 3.6 |
Significantly different (P < 0.05) from the corresponding control sample.
Influence of Hg2+ pretreatment on TRI- and DCVC-induced necrosis and apoptosis in hPT cells
Although pretreatment of hPT cells with Hg2+ had minimal effects on GSH-dependent metabolism, effects on cytotoxicity of TRI and DCVC were examined. Confluent, primary cultures of hPT cells were pretreated with 0, 0.25, 0.5, or 1 μM HgCl2 for 24 h and then cells were incubated with either media (= Control), 1 mM TRI, or 50 μM or 200 μM DCVC. Cellular necrosis was assessed by measuring either LDH release from cells (Figure 7A) or total LDH activity in cells and extracellular medium (Figure 7B).
Figure 7. Effects of pretreatment of primary cultures of hPT cells with Hg2+ on TRI- and DCVC-induced necrosis.
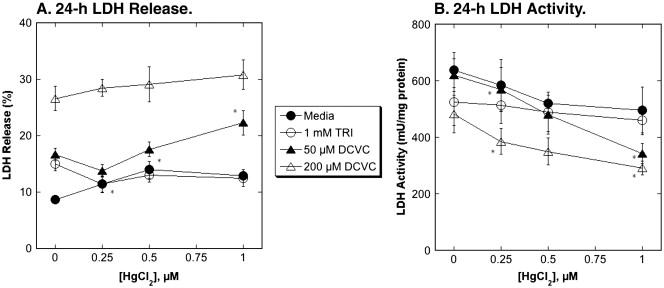
Confluent, hPT cell cultures were pretreated for 24 h with either media (= Control) or 0.25, 0.5, or 1 μM HgCl2. Cells from the four pretreatment groups were then incubated for 24 h with either media, 1 mM TRI, or 50 or 200 μM DCVC. LDH activity was measured in media and in cells solubilized with 0.1% (v/v) Triton X-100. Results are expressed as either percent LDH release (A) or total LDH activity (B) and are means ± SE of measurements from 3 separate cell cultures. *Significantly different (P < 0.05) from corresponding samples preincubated with media.
hPT cells preincubated with media exhibited small increases in LDH release, from < 10% in media-incubated cells to 15-20% in cells incubated with either 1 mM TRI or 50 μM DCVC; incubation of media-preincubated hPT cells with 200 μM DCVC increased LDH release to nearly 30%. No effects were observed on total LDH activity in media-preincubated cells. Using LDH release as a metric of necrosis, the only significant observed effects of preincubation with Hg2+ was to slightly decrease LDH release from 1 mM TRI in cells preincubated with 0.25 μM HgCl2 and to moderately increase LDH release from 50 μM DCVC in cells preincubated with 1 μM HgCl2. Because of the ability of Hg2+ to directly inhibit LDH activity (Lash and Zalups, 1992), LDH inactivation is likely to be a more sensitive metric for necrosis than LDH release. Accordingly, more pronounced effects of preincubation of hPT cells with Hg2+ were observed when LDH inactivation was used as a metric of necrosis. Preincubation with both 0.25 μM and 1 μM HgCl2 significantly increased LDH inactivation due to incubation with either 50 μM or 200 μM DCVC. Thus, preincubation of hPT cells with Hg2+ enhanced acute cellular necrosis due to DCVC but had no effect on that due to TRI.
Preincubation of hPT cells with Hg2+ also altered the induction of apoptosis induced by TRI and DCVC. As a dramatic illustration of this modulation of cytotoxicity response, sample flow cytometry histograms of cell cycle analyses of hPT cells preincubated for 24 h with either media or 0.25 μM Hg2+ and incubated for 1 h with either media, 1 mM TRI, or 50 μM DCVC are shown (Figure 8). Preincubation with 0.25 μM Hg2+ alone resulted in a small increase in the fraction of apoptotic cells. In contrast, preincubation with Hg2+ markedly reduced apoptosis in cells subsequently incubated with either TRI or DCVC.
Figure 8. Effects of pretreatment of primary cultures of hPT cells with 0.25 μM Hg2+ on TRI- and DCVC-induced apoptosis.
Confluent, hPT cell cultures were pretreated for 24 h with either media (= Control) or 0.25 μM HgCl2. Cells from the two pretreatment groups were then incubated for 1 h with either media, 1 mM TRI, or 50 μM DCVC. Apoptosis was assessed by staining with propidium iodide and flow cytometry using a Becton Dickinson FACSCalibur flow cytometer. Peaks from left to right represent apoptotic (sub-G1) cells and cells in G0/G1, G2/M, and S phases. Insets: Distribution of cells according to fluorescence intensity. Cells outside the box were those excluded from analysis due to aggregation. Values above the arrows indicate the percentage of apoptotic cells in each sample.
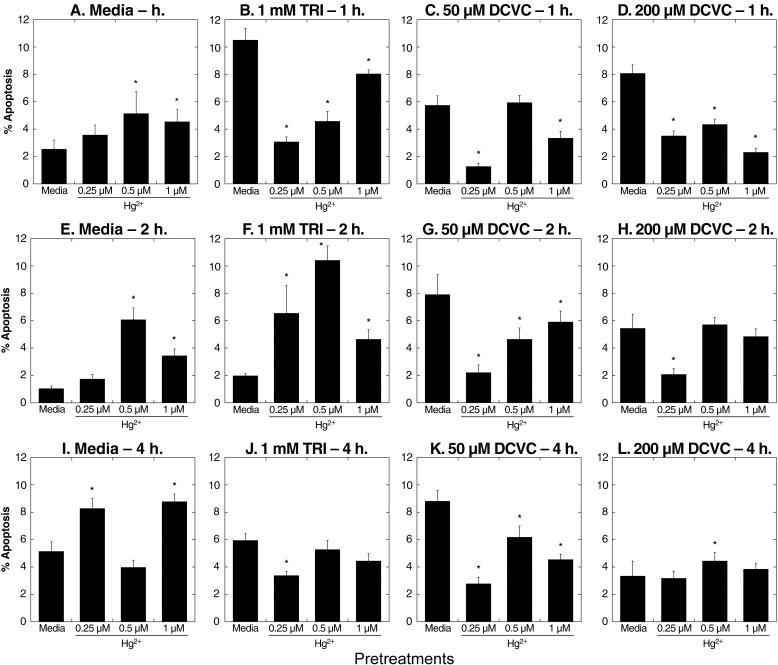
Effects of preincubation with Hg2+ on TRI- and DCVC-induced apoptosis were investigated in more detail by assessing both Hg2+-concentration and time dependence (Figure 9). After 1-h incubations, hPT cells preincubated with media exhibited large increases in apoptosis due to either TRI or DCVC. Preincubation of cells with 0.25 μM HgCl2, however, markedly reduced apoptosis due to 1-h incubation with TRI or DCVC. Preincubation of cells with 0.5 μM or 1 μM HgCl2 for 1 h also decreased apoptosis due to TRI or DCVC, but the effects were less than those at the lowest concentration of Hg2+. Similarly, as incubation time with TRI or DCVC was increased to 2 or 4 h, there were still decreases for most samples in the extent of apoptosis, but the amounts of decreases were less as incubation time or pretreatment concentration of Hg2+ increased.
Figure 9. Time and dose dependence of effects of pretreatment of primary cultures of hPT cells with Hg2+ on TRI- and DCVC-induced apoptosis.
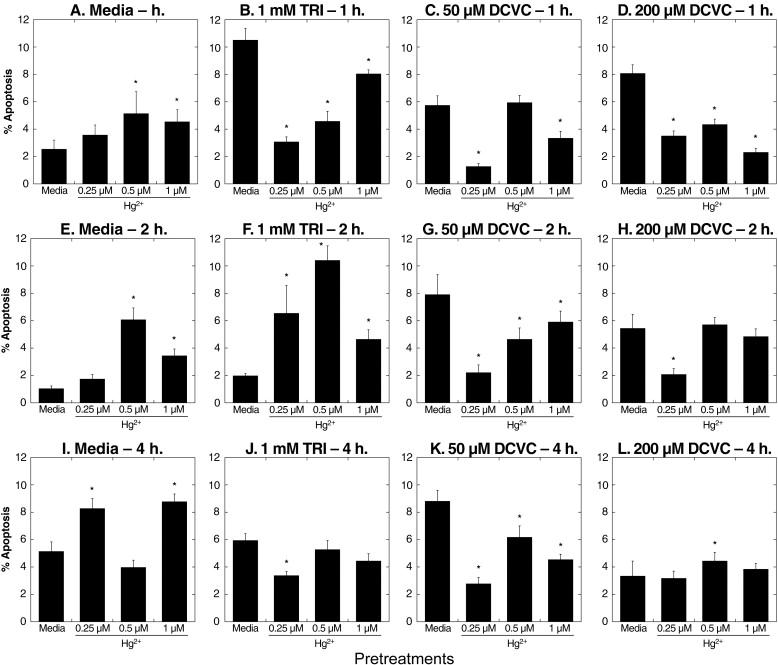
Confluent, hPT cell cultures were pretreated for 24 h with 0 (= Media/Control), 0.25, 0.5, or 1 μM HgCl2. Cells from the four pretreatment groups were then incubated for 1, 2, or 4 h with either media, 1 mM TRI, or 50 or 200 μM DCVC. Cells were analyzed for apoptosis by flow cytometry as described in the legend to Fig. 8. Results are means ± SE of measurements from 3 separate cell cultures. *Significantly different (P < 0.05) from corresponding samples preincubated with media.
To summarize the results from Hg2+-pretreatment in hPT cells, those cells that were pretreated with Hg2+ exhibited increased LDH release or LDH inactivation due to DCVC and decreased apoptosis due to either TRI or DCVC. Thus, the cytotoxic response to TRI or DCVC is shifted from apoptosis to necrosis by prior exposure to Hg2+.
Influence of TRI and DCVC pretreatments on Hg2+-induced necrosis and apoptosis in hPT cells
Using the same paradigm of prior exposure, we next examined the influence of preincubations with either TRI or DCVC on the cytotoxic responses of hPT cells to Hg2+. Primary cultures of hPT cells were preincubated for 24 h with either media, 1 mM TRI, or 50 μM DCVC and were subsequently incubated for 1, 2, or 4 h with either media or one of three concentrations of Hg2+ (0.25, 1, 5 μM). Using LDH inactivation as a metric for acute cellular necrosis, showed that hPT cells pretreated with Hg2+ generally exhibited less cytotoxicity from either TRI or DCVC than cells pretreated with only media (Figure 10). The response varied somewhat according to incubation time and concentration of Hg2+. The only samples that showed little decrease in cytotoxicity as compared with the corresponding media-preincubated samples were those preincubated with 5 μM Hg2+; this is presumably due to a significant decrease in LDH activity by the pretreatment alone.
Figure 10. Effects of pretreatment of primary cultures of hPT cells with TRI or DCVC on Hg2+-induced necrosis.
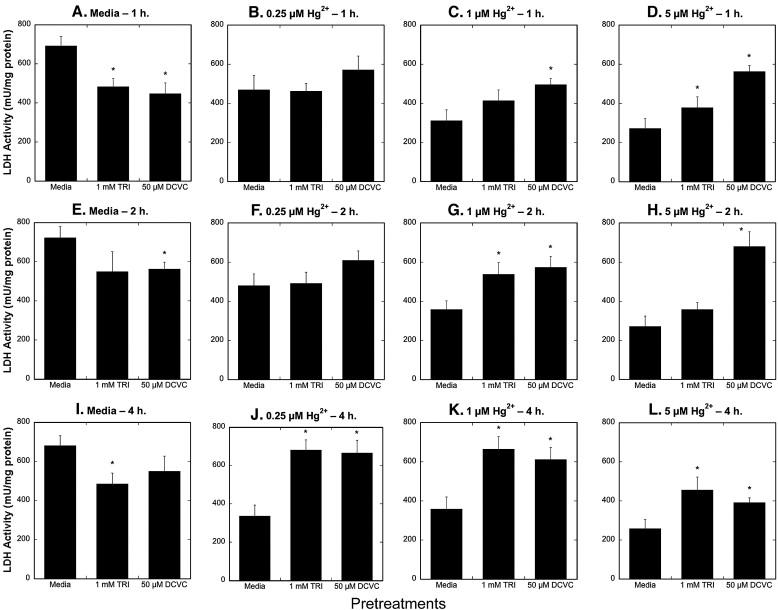
Confluent, hPT cell cultures were pretreated for 24 h with either media (= Control), 1 mM TRI, or 50 μM DCVC. Cells from the three pretreatment groups were then incubated for 1, 2, or 4 h with either 0, 0.25, 1, or 5 μM HgCl2. LDH activity was measured in media and in cells solubilized with 0.1% (v/v) Triton X-100. Results are means ± SE of measurements from 3 separate cell cultures. *Significantly different (P < 0.05) from corresponding samples preincubated with media.
The influence of pretreatment with TRI or DCVC on apoptosis induced by Hg2+ exhibited a markedly different pattern than on necrosis (Figure 11): In contrast with the results above, preincubation with 1 mM TRI had either no effect or decreased the fraction of cells undergoing apoptosis after 1-h incubations with Hg2+ but generally increased the fraction of cells undergoing apoptosis after 2- or 4-h incubations with Hg2+. Preincubation of hPT cells with 50 μM DCVC slightly increased apoptosis due to either a 1- or 2-h incubation with 0.25 μM Hg2+, had no effect on apoptosis due to either a 1- or 2-h incubation with either 1 μM or 5 μM Hg2+, but markedly decreased apoptosis due to 4-h incubations with any of the three concentrations of Hg2+ tested.
Figure 11. Effects of pretreatment of primary cultures of hPT cells with TRI or DCVC on Hg2+-induced apoptosis.
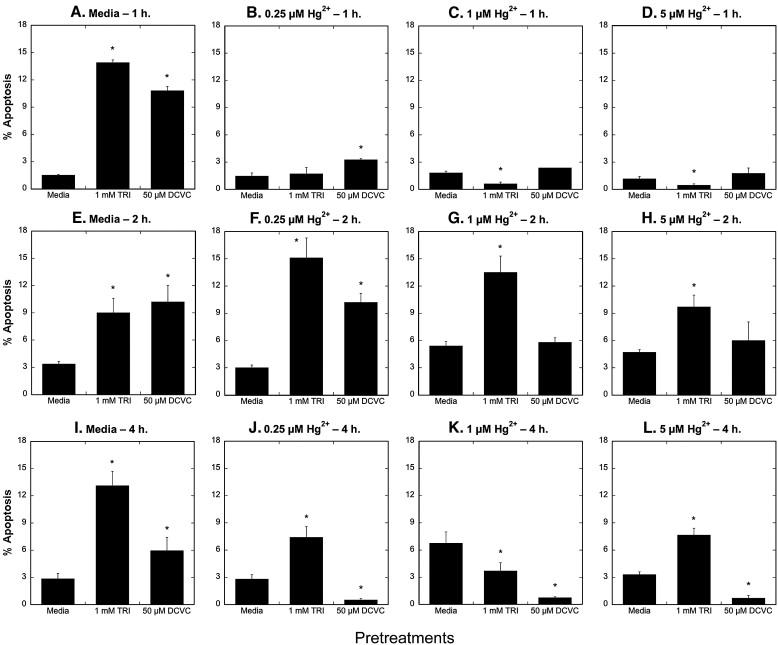
Confluent, hPT cell cultures were pretreated for 24 h with either media (= Control), 1 mM TRI, or 50 μM DCVC. Cells from the three pretreatment groups were then incubated for 1, 2, or 4 h with either 0, 0.25, 1, or 5 μM HgCl2. Cells were analyzed for apoptosis by flow cytometry as described in the legend to Fig. 8. Results are means ± SE of measurements from 3 separate cell cultures. *Significantly different (P < 0.05) from corresponding samples preincubated with media.
Discussion
Based on the existence of several common pathways and mechanisms of action for renal injury induced by TRI (or its metabolite DCVC) and Hg2+, we hypothesized that prior exposure to one chemical (or its metabolite) would alter the cytotoxic response of kidney cells to a subsequent exposure to the other chemical (or its metabolite). Some of the common pathways include those for metabolism and transport, and the interaction may include processes such as direct competition or induction of an enzyme involved in metabolism. The concept of prior exposure of one chemical producing either an adaptive change in cells or otherwise altering the response of the cell to subsequent exposures to potentially toxic chemicals, is not new. Novel aspects of the present study, however, include our use of primary cultures of hPT cells as a cellular model and comparisons between rodent and human PT cells.
Calabrese and Mehendale (1996) reviewed the role of altered tissue repair as an adaptive strategy to chemical exposures. Of more direct pertinence to the present study, Mehendale and colleagues (Korrapati et al., 2005, 2006; Vaidya et al., 2003a, 2003b, 2003c) demonstrated in a series of studies in mice that enhanced renal cell division is associated with protection of mice from DCVC-induced acute renal failure and death. Their studies have described what they have termed “auto-protection.” In those studies, mice were protected from acute renal injury due to DCVC as a consequence of prior exposures to DCVC. In our study, we have examined the influence of a prior exposure to one chemical on the subsequent toxicity from exposure to another chemical. Any protection that occurs would be described as “hetero-protection.” Besides protection, cells may also experience the opposite response, namely that prior exposure to one chemical may enhance sensitivity to a subsequent exposure to another chemical.
Our initial studies were conducted in rats and rPT cells to further establish effects of Hg2+ on cellular GSH status. In vivo treatment of rats with a subtoxic dose of Hg2+ (Zalups and Lash, 1990) produced a number of significant changes in GSH-dependent metabolism in the renal cortex. These changes included increased protein expression of GSTα1 but decreased GSTα2 increased activities of GSH synthesis and GSH-dependent enzymes, and, most significantly for the current study, a significant increase in rates of GSH conjugation of TRI. Analysis of the kinetics of DCVG formation after Hg2+ pretreatment showed that Vmax was increased but the Km for TRI was unchanged, suggesting that Hg2+ pretreatment led to more GST being produced. When primary cultures of rPT cells were treated with Hg2+, a significant increase was observed in GST activity as well.
Assessment of acute cytotoxicity of Hg2+ in rPT cells showed that the dose-response relationship for Hg2+-induced cell death was very steep, consistent with earlier studies (Lash and Zalups, 1992; Lash et al., 1999a). Using LDH inactivation as a measure of acute cellular necrosis, the IC50 was approximately 0.8 μM Hg2+ (cf. Figure 4). Analysis of cell cycle distribution and apoptosis by propidium iodide staining and flow cytometry showed that whereas 0.5 μM Hg2+ produced no effect on cell cycle distribution and no significant increase in the fraction of apoptotic cells (cf. Figure 5B) as compared with control rPT cells, 1 μM Hg2+ caused both a large increase in apoptosis and extensive detachment of cells from the growth surface (cf. Figures 5C and 5D).
Primary cultures of hPT cells, grown under the same conditions and with the same medium as primary cultures of rPT cells, were markedly less responsive to exposures to low concentrations of Hg2+ with respect to cellular GSH status. None of the three isoforms of GST in hPT cells exhibited altered expression after 24-h incubations with Hg2+ (cf. Figure 6). Of the GSH-dependent enzyme activities measured, only GRD exhibited a modest increase after a 48-h incubation with Hg2+ (cf. Table 3). In spite of these minimal to modest changes, prior exposure of hPT cells to either Hg2+ or TRI/DCVC had profound effects on necrosis or apoptosis due to subsequent exposures to one of the other chemicals, suggesting that factors in addition to GSH status are important in the response of hPT cells to prior exposures to cytotoxic chemicals.
Pretreatment of hPT cells with between 0.25 μM and 1 μM Hg2+ for 24 h caused a significant increase in necrosis (as determined by LDH inactivation) due to 50 or 200 μM DCVC, but had little effect on that due to TRI (cf. Figure 7). In contrast to this response, pretreatment of hPT cells with the same concentrations of Hg2+ markedly decreased apoptosis due to either DCVC or TRI (cf. Figures 8 and 9). If one views these two forms of cell death (necrosis or oncosis and apoptosis) as a continuum in the cytotoxic response of cells to toxic chemicals or pathological conditions, then we interpret the results with Hg2+ pretreatment as indicating that sensitivity of hPT cells to TRI or DCVC is enhanced as the mechanism of cell death is shifted from apoptosis to necrosis. In this scenario, cells undergoing apoptosis are viewed as being less seriously compromised than cells undergoing necrosis. The energy dependence and more highly regulated nature of apoptosis would be consistent with this view. Thus, rather than protecting hPT cells from a subsequent exposure to another chemical, prior exposure to low concentrations of Hg2+ enhances the severity of the cellular response to TRI or DCVC.
Unlike the findings with prior exposure to Hg2+, incubation first with either TRI or DCVC generally protected hPT cells from cell death due to Hg2+ (cf. Figures 10 and 11). Prior exposure to either TRI or its nephrotoxic metabolite DCVC markedly decreased Hg2+-induced LDH inactivation. Effects on Hg2+-induced apoptosis were, however, somewhat more complex. Whereas prior exposure to TRI clearly increased apoptosis due to Hg2+ at later incubation times, prior exposure to DCVC initially increased the occurrence of Hg2+-induced apoptosis, but then led to a marked decrease at later incubation times. Again, using the view described above of apoptosis and necrosis/oncosis representing a continuum in the cytotoxic response of cells, these results are consistent with prior exposures of hPT primary cell cultures to TRI or DCVC leading to protection from subsequent exposures to Hg2+.
The increased toxicity of TRI in hPT cells after pretreatment with a subtoxic concentration of Hg2+ can readily be rationalized by the ability of Hg2+ to increase bioactivation of TRI by GST and to increase renal PT cell GSH content. Understanding of the mechanism for the increased toxicity of DCVC in hPT cells due to Hg2+ pretreatment requires further study. One possibility is that prior exposure to Hg2+ may induce one or more forms of renal cysteine conjugate β-lyase, as has been shown for the mercapturate of hexachlorobutadiene (Cooper and Pinto, 2006; MacFarlane et al., 1993). Similarly, understanding of the mechanism by which pretreatment of hPT cells with TRI or DCVC decreases toxicity of Hg2+ also requires further study, but may involve activation of certain transcription factors and/or some of the protective mechanisms, such as activation of cellular repair and proliferation, as described by Mehendale and colleagues (Korrapati et al., 2005, 2006; Vaidya et al., 2003a, 2003b, 2003c). Some of our earlier results in primary cultures of hPT cells, studying the effects of DCVC on expression of regulatory proteins such as heat shock protein 27 (Hsp27), p53, and nuclear factor κB (NFκB) (Lash et al., 2005), are consistent with such a potential mechanism. Expression of each of these proteins was induced severalfold by exposure to low concentrations of DCVC. Increased expression of these three proteins is associated with alterations in cellular responses to toxicants, including activation of repair mechanisms and changes in cell cycle status.
In summary, the present study has demonstrated that exposures of hPT cells to one chemical can significantly modulate the sensitivity of the cells to subsequent chemical exposures. The modulation or adaptation of the cells to the initial chemical exposure will depend on the precise mechanisms by which the subsequent chemical produces toxicity. Although changes in cellular GSH status are important, other factors may be more important to the underlying mechanisms by which pretreatment with Hg2+ influences TRI- or DCVC-induced toxicity in the human kidney.
Acknowledgments
This study was supported by National Institute of Environmental Health Sciences Grant R01-ES08828 to L.H.L. Core facilities funded by the National Institute of Environmental Health Sciences Center for Molecular Toxicology with Human Application (Grant P30-ES06639) at Wayne State University were used for some of these studies.
Footnotes
Publisher's Disclaimer: This is a PDF file of an unedited manuscript that has been accepted for publication. As a service to our customers we are providing this early version of the manuscript. The manuscript will undergo copyediting, typesetting, and review of the resulting proof before it is published in its final citable form. Please note that during the production process errors may be discovered which could affect the content, and all legal disclaimers that apply to the journal pertain.
Conflict of Interest Statement
The authors declare no conflicts of interest in the publication of this manuscript.
References
- Agency for Toxic Substances and Disease Registry (ATSDR) Toxicological profile for mercury. U.S. Department of Health and Human Services, Public Health Service; Atlanta, GA: 1999. [Google Scholar]
- Baggett JM, Berndt WO. The effect of depletion of nonprotein sulfhydryls by diethyl maleate plus buthionine sulfoximine on renal uptake of mercury in the rat. Toxicol. Appl. Pharmacol. 1986;83:556–562. doi: 10.1016/0041-008x(86)90238-3. [DOI] [PubMed] [Google Scholar]
- Berndt WO, Baggett JM, Blacker A, Houser M. Renal glutathione and mercury uptake by kidney. Fund. Appl. Toxicol. 1985;5:832–839. doi: 10.1016/0272-0590(85)90166-6. [DOI] [PubMed] [Google Scholar]
- Burton CA, Hatlelid K, Divine K, Carter DE, Fernando Q, Brendel K, Gandolfi AJ. Glutathione effects on toxicity and uptake of mercuric chloride and sodium arsenite in rabbit renal cortical slices. Environ. Health Perspec. 1995;103:81–84. doi: 10.1289/ehp.95103s181. [DOI] [PMC free article] [PubMed] [Google Scholar]
- Carpenter DO, Arcaro KF, Bush B, Niemi WD, Pang S, Vakharia DD. Human health and chemical mixtures: An overview. Environ. Health Perspec. 1998;106(Suppl 6):1263–1270. doi: 10.1289/ehp.98106s61263. [DOI] [PMC free article] [PubMed] [Google Scholar]
- Cooper AJL, Pinto JT. Cysteine conjugate β-lyases. Amino Acids. 2006;30:1–15. doi: 10.1007/s00726-005-0243-4. [DOI] [PubMed] [Google Scholar]
- Cummings BS, Lash LH. Metabolism and toxicity of trichloroethylene and S-(1,2-dichlorovinyl)-L-cysteine in freshly isolated human proximal tubular cells. Toxicol. Sci. 2000;53:458–466. doi: 10.1093/toxsci/53.2.458. [DOI] [PubMed] [Google Scholar]
- Cummings BS, Lasker JM, Lash LH. Expression of glutathione-dependent enzymes and cytochrome P450s in freshly isolated and primary cultures of proximal tubular cells from human kidney. J. Pharmacol. Exp. Ther. 2000b;293:677–685. [PubMed] [Google Scholar]
- Cummings BS, Parker JC, Lash LH. Role of cytochrome P450 and glutathione S-transferase α in metabolism and cytotoxicity of trichloroethylene in rat kidney. Biochem. Pharmacol. 2000c;59:531–543. doi: 10.1016/s0006-2952(99)00374-3. [DOI] [PubMed] [Google Scholar]
- Cummings BS, Zangar RC, Novak RF, Lash LH. Cytotoxicity of trichloroethylene and S-(1,2-dichlorovinyl)-L-cysteine in primary cultures of rat renal proximal tubular and distal tubular cells. Toxicology. 2000a;150:83–98. doi: 10.1016/s0300-483x(00)00252-3. [DOI] [PubMed] [Google Scholar]
- Davidson IW, Beliles RP. Consideration of the target organ toxicity of trichloroethylene in terms of metabolite toxicity and pharmacokinetics. Drug Metab. Rev. 1991;23:493–599. doi: 10.3109/03602539109029772. [DOI] [PubMed] [Google Scholar]
- de Ceaurriz J, Payan JP, Morel G, Brondeau MT. Role of extracellular glutathione and γ-glutamyltranspeptidase in the disposition and kidney toxicity of inorganic mercury in rats. J. Appl. Toxicol. 1994;14:201–206. doi: 10.1002/jat.2550140310. [DOI] [PubMed] [Google Scholar]
- Devi SS, Philip BK, Warbritton A, Latendresse JR, Mehendale HM. Prior administration of a low dose of thioacetamide protects type 1 diabetic rats from subsequent administration of lethal dose of thioacetamide. Toxicology. 2006;226:107–117. doi: 10.1016/j.tox.2006.06.007. [DOI] [PubMed] [Google Scholar]
- Dnyanmote AV, Sawant SP, Lock EA, Latendresse JR, Warbritton AA, Mehendale HM. Diabetic mice are protected from normally lethal nephrotoxicity of S-(1,2-dichlorovinyl)-L-cysteine (DCVC): Role of nephrogenic tissue repair. Toxicol. Appl. Pharmacol. 2006a;211:133–147. doi: 10.1016/j.taap.2005.07.015. [DOI] [PubMed] [Google Scholar]
- Dnyanmote AV, Sawant SP, Lock EA, Latendresse JR, Warbritton AA, Mehendale HM. Calpastatin overexpression prevents progression of S-(1,2-dichlorovinyl)-L-cysteine (DCVC)-initiated acute renal injury and renal failure (ARF) in diabetes. Toxicol. Appl. Pharmacol. 2006b;215:146–157. doi: 10.1016/j.taap.2006.01.018. [DOI] [PubMed] [Google Scholar]
- Elfarra AA, Jakobson I, Anders MW. Mechanism of S-(1,2-dichlorovinyl)glutathione-induced nephrotoxicity. Biochem. Pharmacol. 1986;35:283–288. doi: 10.1016/0006-2952(86)90527-7. [DOI] [PubMed] [Google Scholar]
- Girardi G, Elias MM. Effect of different renal glutathione levels on renal mercury disposition and excretion in the rat. Toxicology. 1993;81:57–67. doi: 10.1016/0300-483x(93)90156-m. [DOI] [PubMed] [Google Scholar]
- Korrapati MC, Lock EA, Mehendale HM. Molecular mechanisms of enhanced renal cell division in protection against S-(1,2-dichlorovinyl)-L-cysteine-induced acute renal failure and death. Am. J. Physiol. 2005;289:F175–F185. doi: 10.1152/ajprenal.00418.2004. [DOI] [PubMed] [Google Scholar]
- Korrapati MC, Chilakapati J, Lock EA, Latendresse JR, Warbritton A, Mehendale HM. Preplaced cell division: a critical mechanism of autoprotection against S-(1,2-dichlorovinyl)-L-cysteine-induced acute renal failure and death in mice. Am. J. Physiol. 2006;291:F439–F455. doi: 10.1152/ajprenal.00384.2005. [DOI] [PubMed] [Google Scholar]
- Lash LH, Tokarz JJ. Isolation of two distinct populations of cells from rat kidney cortex and their use in the study of chemical-induced toxicity. Anal. Biochem. 1989;182:271–279. doi: 10.1016/0003-2697(89)90593-9. [DOI] [PubMed] [Google Scholar]
- Lash LH, Zalups RK. Mercuric chloride-induced cytotoxicity and compensatory hypertrophy in rat kidney proximal tubular cells. J. Pharmacol. Exp. Ther. 1992;261:819–829. [PubMed] [Google Scholar]
- Lash LH, Zalups RK. Alterations in renal cellular glutathione metabolism after in vivo administration of a subtoxic dose of mercuric chloride. J. Biochem. Toxicol. 1996;11:1–9. doi: 10.1002/(SICI)1522-7146(1996)11:1<1::AID-JBT1>3.0.CO;2-O. [DOI] [PubMed] [Google Scholar]
- Lash LH, Fisher JW, Lipscomb JC, Parker JC. Metabolism of trichloroethylene. Environ. Health Perspec. 2000b;108(Suppl 2):177–200. doi: 10.1289/ehp.00108s2177. [DOI] [PMC free article] [PubMed] [Google Scholar]
- Lash LH, Hueni SE, Putt DA. Apoptosis, necrosis and cell proliferation induced by S-(1,2-dichlorovinyl)-L-cysteine in primary cultures of human proximal tubular cells. Toxicol. Appl. Pharmacol. 2001b;177:1–16. doi: 10.1006/taap.2001.9295. [DOI] [PubMed] [Google Scholar]
- Lash LH, Lipscomb JC, Putt DA, Parker JC. Glutathione conjugation of trichloroethylene in human liver and kidney: Kinetics and individual variation. Drug Metab. Dispos. 1999c;27:351–359. [PubMed] [Google Scholar]
- Lash LH, Parker JC, Scott CS. Modes of action of trichloroethylene for kidney tumorigenesis. Environ. Health Perspec. 2000a;108(Suppl 2):225–240. doi: 10.1289/ehp.00108s2225. [DOI] [PMC free article] [PubMed] [Google Scholar]
- Lash LH, Putt DA, Abbas R, Brashear WT, Parker JC, Fisher JW. Identification of S-(1,2-dichlorovinyl)glutathione in the blood of human volunteers exposed to trichloroethylene. J. Toxicol. Environ. Health. 1999b;56:1–21. doi: 10.1080/009841099158204. [DOI] [PubMed] [Google Scholar]
- Lash LH, Putt DA, Hueni SE, Horwitz BP. Molecular markers of trichloroethylene-induced toxicity in human kidney cells. Toxicol. Appl. Pharmacol. 2005;206:157–168. doi: 10.1016/j.taap.2004.09.023. [DOI] [PubMed] [Google Scholar]
- Lash LH, Putt DA, Zalups RK. Influence of exogenous thiols on inorganic mercury-induced injury in renal proximal and distal tubular cells from normal and uninephrectomized rats. J. Pharmacol. Exp. Ther. 1999a;291:492–502. [PubMed] [Google Scholar]
- Lash LH, Putt DA, Zalups RK. Role of extracellular thiols in uptake and distribution of inorganic mercury in rat renal proximal and distal tubular cells. J. Pharmacol. Exp. Ther. 1998a;285:1039–1050. [PubMed] [Google Scholar]
- Lash LH, Qian W, Putt DA, Hueni SE, Elfarra AA, Krause RJ, Parker JC. Renal and hepatic toxicity of trichloroethylene and its glutathione-derived metabolites in rats and mice: Sex-, species-, and tissue-dependent differences. J. Pharmacol. Exp. Ther. 2001a;297:155–164. [PubMed] [Google Scholar]
- Lash LH, Qian W, Putt DA, Jacobs K, Elfarra AA, Krause RJ, Parker JC. Glutathione conjugation of trichloroethylene in rats and mice: Sex-, species-, and tissue-dependent differences. Drug Metab. Dispos. 1998b;26:12–19. [PubMed] [Google Scholar]
- Lash LH, Tokarz JJ, Pegouske DM. Susceptibility of primary cultures of proximal tubular and distal tubular cells from rat kidney to chemically induced toxicity. Toxicology. 1995b;103:85–103. doi: 10.1016/0300-483x(95)03110-2. [DOI] [PubMed] [Google Scholar]
- Lash LH, Xu Y, Elfarra AA, Duescher RJ, Parker JC. Glutathione-dependent metabolism of trichloroethylene in isolated liver and kidney cells of rats and its role in mitochondrial and cellular toxicity. Drug Metab. Dispos. 1995a;23:846–853. [PubMed] [Google Scholar]
- Lund B-O, Miller DM, Woods JS. Studies on Hg(II)-induced H2O2 formation and oxidative stress in vivo and in vitro in rat kidney mitochondria. Biochem. Pharmacol. 1993;45:2017–2024. doi: 10.1016/0006-2952(93)90012-l. [DOI] [PubMed] [Google Scholar]
- MacFarlane M, Schofield M, Parker N, Roelandt L, David M, Lock EA, King LJ, Goldfarb PS, Gibson GG. Dose-dependent induction or depression of cysteine conjugate β-lyase in rat kidney by N-acetyl-S-(1,2,3,4,4-pentachloro-1,3-butadienyl)-L-cysteine. Toxicology. 1993;77:133–144. doi: 10.1016/0300-483x(93)90144-h. [DOI] [PubMed] [Google Scholar]
- Todd JH, McMartin KE, Sens DA.Jones GE.Enzymatic isolation and serum-free culture of human renal cells Methods in Molecular Medicine: Human Cell Culture Protocols 1995. Chapter 32 Humana Press, Inc. Totowa, NJ: [DOI] [PubMed] [Google Scholar]
- Vaidya VS, Shankar K, Lock EA, Bucci TJ, Mehendale HM. Renal injury and repair following S-(1,2-dichlorovinyl)-L-cysteine administration to mice. Toxicol. Appl. Pharmacol. 2003a;188:110–121. doi: 10.1016/s0041-008x(02)00080-7. [DOI] [PubMed] [Google Scholar]
- Vaidya VS, Shankar K, Lock EA, Bucci TJ, Mehendale HM. Role of tissue repair in survival from S-(1,2-dichlorovinyl)-L-cysteine-induced acute renal tubular necrosis in the mouse. Toxicol. Sci. 2003b;74:215–227. doi: 10.1093/toxsci/kfg111. [DOI] [PubMed] [Google Scholar]
- Vaidya VS, Shankar K, Lock EA, Dixon D, Mehendale HM. Molecular mechanisms of renal tissue repair in survival from acute renal tubule necrosis: Role of ERK1/2 pathway. Toxicol. Pathol. 2003c;31:604–618. doi: 10.1080/01926230390241945. [DOI] [PubMed] [Google Scholar]
- Woods JS, Ellis ME. Up-regulation of glutathione synthesis in rat kidney by methyl mercury: Relationship to mercury-induced oxidative stress. Biochem. Pharmacol. 1995;50:1719–1724. doi: 10.1016/0006-2952(95)02075-6. [DOI] [PubMed] [Google Scholar]
- Woods JS, Davis HA, Baer RP. Enhancement of γ-glutamylcysteine synthetase mRNA in rat kidney by methyl mercury. Arch. Biochem. Biophys. 1992;296:350–353. doi: 10.1016/0003-9861(92)90583-i. [DOI] [PubMed] [Google Scholar]
- Zalups RK. Method for studying the in vivo accumulation of inorganic mercury in segments of the nephron in the kidneys of rats treated with mercuric chloride. J. Pharmacol. Methods. 1991a;26:89–104. doi: 10.1016/0160-5402(91)90058-d. [DOI] [PubMed] [Google Scholar]
- Zalups RK. Autometallographic localization of inorganic mercury in the kidneys of rats: Effect of unilateral nephrectomy and compensatory renal growth. Exp. Mol. Pathol. 1991b;54:10–21. doi: 10.1016/0014-4800(91)90039-z. [DOI] [PubMed] [Google Scholar]
- Zalups RK. Early aspects of the intrarenal distribution of mercury after the intravenous administration of mercuric chloride. Toxicology. 1993;79:215–228. doi: 10.1016/0300-483x(93)90213-c. [DOI] [PubMed] [Google Scholar]
- Zalups RK, Lash LH. Effects of uninephrectomy and mercuric chloride on renal glutathione homeostasis. J. Pharmacol. Exp. Ther. 1990;254:962–970. [PubMed] [Google Scholar]
- Zalups RK, Lash LH. Recent advances in understanding the renal transport and toxicity of mercury. J. Toxicol. Environ. Health. 1994;42:1–44. doi: 10.1080/15287399409531861. [DOI] [PubMed] [Google Scholar]
- Zalups RK, Lash LH. Depletion of glutathione in the kidney and the renal disposition of administered inorganic mercury. Drug Metab. Dispos. 1997;25:516–523. [PubMed] [Google Scholar]


