

Abstract
Aims
To determine the human cytochromes mediating biotransformation of the imidazopyridine hypnotic, zolpidem, and the clinical correlates of the findings.
Methods
Kinetic properties of zolpidem biotransformation to its three hydroxylated metabolites were studied in vitro using human liver microsomes and heterologously expressed individual human cytochromes.
Results
The metabolic product termed M-3 accounted for more than 80% of net intrinsic clearance by liver microsomes in vitro. Microsomes containing human cytochromes CYP1A2, 2C9, 2C19, 2D6, and 3 A4 expressed by cDNA-transfected human lymphoblastoid cells mediated zolpidem metabolism in vitro. The kinetic profile for zolpidem metabolite formation by each individual cytochrome was combined with estimated relative abundances based on immunological quantification, yielding projected contributions to net intrinsic clearance of: 61% for 3 A4, 22% for 2C9, 14% for 1A2, and less than 3% for 2D6 and 2C19. These values were consistent with inhibitory effects of ketoconazole and sulfaphenazole on zolpidem biotransformation by liver microsomes. Ketoconazole had a 50% inhibitory concentration (IC50) of 0.61 μm vs formation of the M-3 metabolite of zolpidem in vitro; in a clinical study, ketoconazole coadministration reduced zolpidem oral clearance by ≈40%, somewhat less than anticipated based on the IC50 value and total plasma ketoconazole levels, but much more than predicted based on unbound plasma ketoconazole levels.
Conclusions
The incomplete dependence of zolpidem clearance on CYP3A activity has clinical implications for susceptibility to metabolic inhibition.
Keywords: cytochromes P450, drug interactions, in vitro metabolism, ketoconazole, zolpidem
Introduction
The imidazopyridine derivative zolpidem (Figure 1) is widely prescribed in clinical practice for the treatment of sleep disorders[1–4]. Zolpidem produces sedative and hypnotic effects via interaction with the GABA-benzodiazepine receptor complex, with relative selectivity for the Type 1 (omega-1) benzodiazepine receptor subtype[5, 6].
Figure 1.
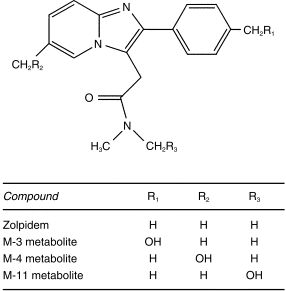
Structure of zolpidem and its principal metabolites.
Zolpidem is extensively metabolized in humans, with parallel hydroxylation reactions at three distinct sites on the molecule (Figure 1)[7, 8]. Further oxidation of the M-3 metabolite yields an acid derivative which is of major quantitative importance[9, 10]. Zolpidem metabolism is mediated by human cytochromes P450 (CYP), with CYP3A reported as having a dominant role based on in vitro studies of cDNA expressed human cytochromes, as well as susceptibility to inhibition by ketoconazole and anti-3A antibodies in liver microsomes[11]. Expressed cytochrome studies also indicated a contributory role of CYP1A2 and 2D6, but not of 2A6, 2E1, and 2C8. However, the possible participation of 2C9 or 2C19 has not been assessed.
The present study evaluated the kinetic profile of zolpidem biotransformation to its three principal metabolites in vitro by human liver microsomes and by cytochromes contained in microsomes expressed by cDNA-transfected human lymphoblastoid cells. Susceptibility to inhibition by a number of chemical inhibitors was evaluated, and the findings were applied to assessment of pharmacokinetic drug interactions in vivo.
Methods
Incubation procedures
Liver samples from human donors with no known liver disease were provided by the International Institute for the Advancement of Medicine, Exton, PA, or the Liver Tissue Procurement and Distribution System, University of Minnesota, Minneapolis, MN. One of these samples was found to have very low S-mephenytoin hydroxylase activity, consistent with the CYP2C19 poor metabolizer phenotype[12, 13]; another sample had negligible dextromethorphan O-demethylation activity, consistent with the CYP2D6 poor metabolizer phenotype.
Microsomes were prepared by ultracentrifugation; microsomal pellets were suspended in 0.1 m potassium phosphate buffer containing 20% glycerol and stored at −80° C until use. Microsomes containing individual human cytochromes expressed by cDNA-transfected human lymphoblastoid cells (Gentest, Woburn MA)[14, 15] were similarly stored at −80° C until use. Pure samples of zolpidem and its metabolic products were provided by Synthélabo Recherche, Bagneux, France. Other chemical reagents and drug entities were purchased from commercial sources or kindly provided by their pharmaceutical manufacturers.
Incubation mixtures contained 50 mm phosphate buffer, 5 mm Mg++, 0.5 mm NADP+, and an isocitrate/isocitric dehydrogenase regenerating system[12, 13, 16–20]. Varying quantities of zolpidem in methanol solution, to yield final incubate concentrations of 0 μm and 2–2000 μm, were added to a series of incubation tubes. The solvent was evaporated to dryness at 40° C under conditions of mild vacuum. Reactions were initiated by addition of microsomal protein (up to 0.5 mg ml−1). After 20 min at 37° C, reactions were stopped by cooling on ice and addition of 100 μl of acetonitrile. Either buspirone or desipramine served as suitable internal standards; one of these two compounds was added to the incubate. The mixture was centrifuged, and the supernatant transferred to an autosampling vial for h.p.l.c. analysis. The mobile phase consisted of 30% acetonitrile, 10% methanol, and 60% 50 mm phosphate buffer (pH 6.5); the flow rate was 1.1 ml min−1. The analytical column was stainless steel, 30 cm×3.9 mm, containing reverse-phase C-18 microBondapak (Waters Associates, Milford, MA). Column effluent was monitored by ultraviolet absorbance at 242 nm (Figure 2). Concentrations of each of the metabolic products in reaction mixtures were determined based on calibration curves constructed from a series of standards containing varying known amounts of each compound together with internal standard. The lower limit of sensitivity for each metabolite was 0.02 nmol per sample, and the coefficient of variance for replicate samples did not exceed 9%. The range of linearity exceeded the highest concentration encountered in actual experimental samples. The incubation duration and microsomal protein concentrations were within their linear ranges (30 min and 2 mg ml−1, respectively). Reaction velocities were calculated in units of nmol of product formed min−1 mg−1 of microsomal protein.
Figure 2.
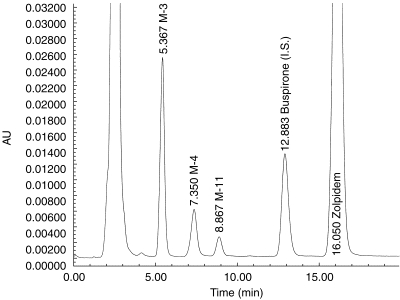
H.p.l.c analysis of human liver microsomal incubate showing peaks corresponding to the substrate (zolpidem), the internal standard (buspirone), and the three principal metabolites of zolpidem.
Further studies were performed using fixed concentrations of zolpidem (10 μm or 100 μm). Varying concentrations of ketoconazole (0.1–5.0 μm), itraconazole (1–25 μm), fluconazole (1–25 μm), α-naphthoflavone (0.1–2.5 μm), sulfaphenazole (0.5–10 μm), or quinidine (0.1–50 μm) were coadded. Reactions were initiated by addition of human microsomal protein, and mixtures were processed as described above. The mechanism-based inhibitors, troleandomycin (TAO) (1–25 μm) and furafylline (5–50 μm), were also studied at the higher concentration of zolpidem (100 μm). For these studies, inhibitors were preincubated with microsomes for 20 min, and reactions were initiated by contact with substrate.
To evaluate formation of zolpidem metabolites by specific cytochromes, zolpidem (250 μm) was incubated with microsomes containing individual human CYP1A2, 2B6, 2C9, 2C19, 2D6, 2E1, and 3A4 at a concentration of 1 mg microsomal protein ml−1 of incubation mixture. After 20 min reaction mixtures were processed as described above. These studies demonstrated metabolic activity by all cytochromes except 2E1 and 2B6. Accordingly varying concentrations of zolpidem (0 μm and 10–1000 μm) were separately incubated with microsomes containing CYP1A2, 2C9, 2C19, 2D6, and 3A4. Reaction mixtures were processed as described.
Analysis of data
For studies of zolpidem biotransformation by human liver microsomes, rates of formation (V) of individual metabolites in relation to concentration of substrate were analysed by nonlinear regression based either on a Michaelis-Menten model, or a modification of this model incorporating an exponent consistent with substrate activation (Hill equation)[12, 13, 16–19]. These analyses yielded an estimate of the maximum reaction velocity (Vmax) and the substrate concentration (Km) corresponding to a reaction velocity of 50% of Vmax. The Vmax/Km ratio is termed ‘intrinsic clearance’, and represents the approximate proportionality constant between reaction velocity and substrate concentration at very low substrate concentrations (without consideration of the exponent in the Hill equation).
For studies involving coincubation with metabolic inhibitors, the reaction velocity at a given concentration of inhibitor was expressed as a percentage ratio vs the control velocity with no inhibitor present[20]. The relation of velocity ratio to inhibitor concentration was analysed by nonlinear regression to determine the inhibitor concentration producing a 50% reduction in reaction velocity (IC50). The IC50 value may depend on substrate concentration, but is not dependent on the biochemical mechanism of inhibition. Since multiple cytochromes contribute to zolpidem biotransformation, we did not attempt to calculate inhibition constants (Ki), which require knowledge of or assumptions regarding the mechanism of inhibition.
Relative contribution of cytochromes to net reaction velocity
The estimated relative contributions of specific human cytochromes to overall velocity of biotransformation of zolpidem were calculated using kinetic data from the individual human cytochromes. The net rate of zolpidem metabolism attributable to a specific cytochrome was taken as the sum of the reaction velocity vs substrate concentration equations for the three metabolites. For human liver microsomes in vitro, or during actual clinical administration, the overall contribution of a cytochrome will depend on the intrinsic metabolic activity of that enzyme (as calculated above) as well as its quantitative abundance[13, 14]. Relative abundance was estimated from mean relative quantities determined by immunoquantitative methods in studies of a series of human liver samples[21]. The partitioning of total CYP2C immunoactivity into 2C9 vs 2C19 was assigned using a 3:1 ratio from our previous studies[13]. Individual cytochrome contributions were then normalized for relative abundance, and expressed as a function of the concentration of the substrate (zolpidem).
Relation of chemical inhibition in vitro to drug interaction in vivo
Inhibition of zolpidem biotransformation by the azole antifungal agent ketoconazole, itraconazole, and fluconazole in human liver microsomes in vitro was compared with inhibition of zolpidem clearance by the same three compounds in a clinical pharmacokinetic drug interaction study[22].
Results
Zolpidem metabolite formation by human liver microsomes
The M-3, M-4, and M-11 metabolites all were formed by human liver microsomes in vitro (Figure 3). The M-3 pathway had the highest values of Vmax and also the lowest Km values. Based on the Vmax/Km ratios, the M-3 pathway accounted for an average of 84% of intrinsic clearance, the M-4 pathway for 12%, and the M-11 pathway for 4% (Table 1). There was no evident influence of the presumed genetic polymorphic deficiencies (2D6 or 2C19) on any of the kinetic parameters.
Figure 3.
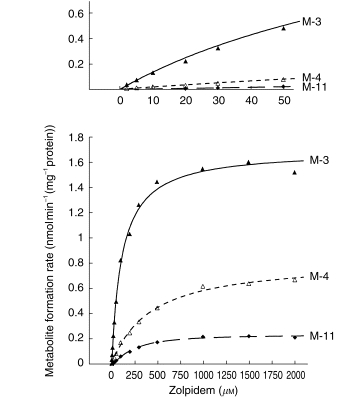
Rates of formation of the M-3, M-4, and M-11 metabolites of zolpidem in relation to concentration of the substrate, zolpidem, by a representative human liver microsomal preparation in vitro. Lines represent functions consistent with Michaelis-Menten kinetics. Insert, above: low substrate concentrations shown on an expanded scale.
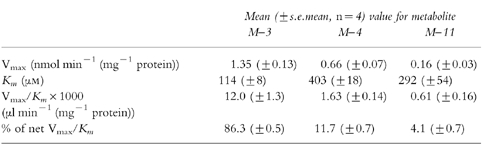
Table 1.
Kinetics of zolpidem metabolite formation by human liver microsomes in vitro.
Inhibition studies
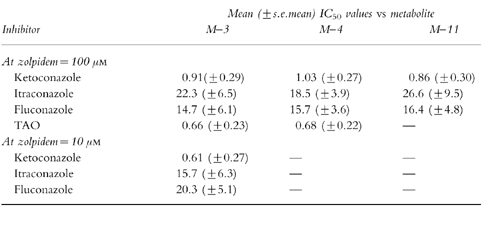
Ketoconazole, a relatively specific inhibitor of CYP3A[23], was a potent inhibitor of zolpidem metabolite formation regardless of substrate concentration (Figure 4, Table 2). TAO also was a potent inhibitor at the substrate concentration of 100 μm that was tested. The other azole antifungal agents, itraconazole and fluconazole (also CYP3A inhibitors[24]), inhibited zolpidem biotransformation, but with IC50 values an order of magnitude higher than that of ketoconazole (Figure 4). At 100 μm zolpidem, none of the other chemical inhibitors produced more than a 10% change in metabolite formation rate. At 10 μm zolpidem, sulfaphenazole (10 μm) produced an ≈15% decrement in reaction velocity; this concentration of sulfaphenazole is within the range of relative specificity for inhibition of CYP2C9. At 10 μm zolpidem, quinidine at concentrations of 5 μm or lower (close to the range of relative specificity for CYP2D6[23]) had minimal effect on zolpidem metabolite formation.
Figure 4.
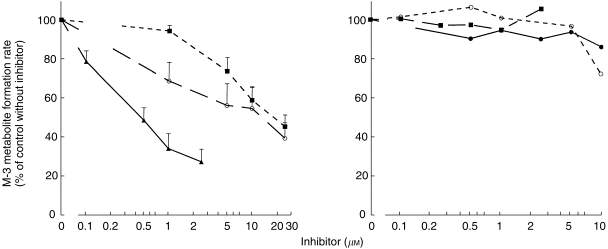
Rates of formation of the M-3 metabolite of zolpidem in relation to concentrations of metabolic inhibitors (▴—▴ ketoconazole, ^—^ itraconazole, ▪–––▪ fluconazole, •—• sulfaphenazole, ▪ – – ▪α-naphthoflavone, ^–––^ quinidine. Reaction velocities were expressed as a percentage ratio vs the control velocity value with no inhibitor present. The zolpidem concentration was fixed at 10 μm. See Table 2 for IC50 values.
Table 2.
Inhibition of zolpidem metabolite formation by chemical inhibitors.
Zolpidem biotransformation by expressed human cytochromes
All three metabolites of zolpidem were formed by human CYP3A4 expressed by cDNA-transfected human lymphoblastoid cells (Table 3). Formation of metaboites M-3 and M-11 by CYP3A was best fit by Hill equations; however, the Hill coefficients were not significantly different from unity. CYP2C19 formed detectable amounts only of M-3, while CYP2C9, 1A2, and 2D6 formed both M-3 and M-4. Formation of M-4 by CYP2C9 was consistent with the Hill equation, having a Hill coefficient (A = 1.63) significantly greater than unity. Figure 5 shows rates of formation of the M-3 metabolite by the five isoforms.
Table 3.
Formation of zolpidem metabolites in vitro by expressed human cytochromes contained in microsomes from cDNA-transfected human lymphoblastoid cells.
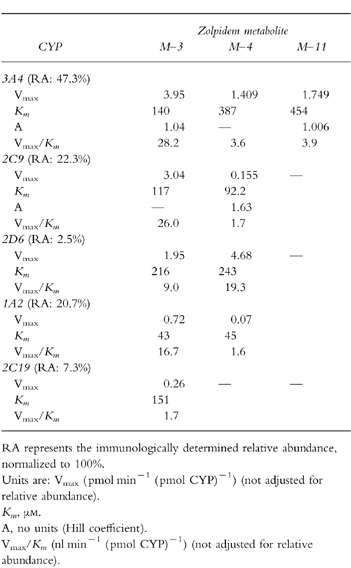
Figure 5.
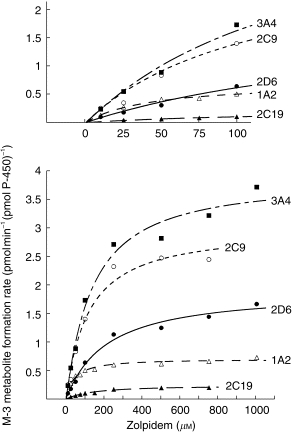
Rates of formation of the M-3 metabolite of zolpidem in relation to concentration of substrate, zolpidem, in vitro by microsomes from cDNA-transfected human lymphoblastoid cells expressing CYP 1A2, 2C9, 2C19, 2D6, or 3A4. Data have not been normalized for relative abundance. Insert, above: the low range of substrate concentrations shown as an expanded scale. See Table 3 for kinetic analysis.
Relative abundance values for the five cytochromes are shown in Table 3. After correction for relative abundance, 83% of net intrinsic clearance was accounted for by formation of M-3, 10.5% for M-4, and 6.6% for M-11. These are nearly identical to relative values determined in the independent studies of liver microsomes (Table 1). When net intrinsic clearance for all pathways was partitioned based on the relative contributions of individual cytochromes, values were: 61% for 3A4, 22% for 2C9, 14% for 1A2, 2.5% for 2D6, and 0.5% for 2C19. Figure 6 shows the relation of substrate (zolpidem) concentration to predicted relative contribution of each cytochrome to net velocity of zolpidem biotransformation.
Figure 6.
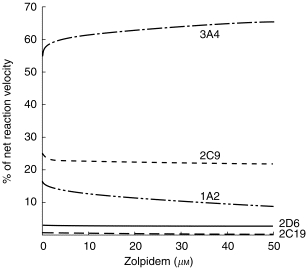
Estimated relative contribution of five human cytochromes to net rate of zolpidem biotransformation in vitro. Functions were generated using reaction velocity vs substrate concentration relationships for the five cDNA-expressed cytochromes (Table 3 and Figure 5), after normalization for relative abundance of the individual cytochromes (RA values in Table 3).
Discussion
Biotransformation of zolpidem by human liver microsomes in vitro proceeded by parallel hydroxylation at three sites on the molecule. Formation of the metabolite termed M-3 accounted for more than 80% of net intrinsic clearance in vitro. This is consistent with previous in vitro and in vivo studies demonstrating that M-3, via the corresponding acid formed by further metabolism, is quantitatively dominant[7]. CYP3A isoforms account for ≈60% of intrinsic clearance of zolpidem. This estimate is derived from studies of cytochromes contained in microsomes expressed by cDNA-transfected human lymphoblastoid cells, with contributions of individual cytochromes appropriately normalized for anticipated relative abundance in vivo. A similar estimate of the 3A contribution was provided by studies of inhibition of zolpidem biotransformation in liver microsomes in which ketoconazole, a relatively specific 3A inhibitor in the 0.5–1.0 μm range, produced 60–70% inhibition of zolpidem metabolite formation. CYP2C9 is estimated to account for another fraction of zolpidem clearance (22%), consistent with inhibition studies using the CYP2C9 inhibitor sulfaphenazole. CYP1A2 apparently accounts for a small fraction of clearance, although significant inhibition by α-naphthoflavone and furafylline could not be detected. Projected contributions of 2D6 and 2C19 were less than 3%. It is of interest that formation of the M-4 metabolite of zolpidem by heterologously expressed CYP2C9 was best explained by a Hill equation, consistent with binding cooperativity or substrate activation[19]. Although this feature is most commonly associated with CYP3A4[25], a similar pattern has been described for CYP1A2 and CYP2C9[25, 26]. In our previous studies we have observed Hill kinetics for heterologously expressed CYP2C9 using phenacetin[27], and amitriptyline[12] as substrates.
The participation of multiple human cytochromes in the metabolism of zolpidem, in contrast to triazolam and midazolam whose clearance is dependent almost entirely on CYP3A, has implications for the susceptibility to drug interactions involving metabolic inhibition. In clinical pharmacokinetic studies, therapeutic doses of ketoconazole typically cause the area under the plasma concentration curve (AUC) for oral triazolam or midazolam to increase by a factor of 10 or more[18, 28, 29]. Under the same experimental conditions, ketoconazole causes AUC for oral zolpidem to increase by a factor of 1.7[22]. This is reflected by a corresponding difference in susceptibility to inhibition in vitro. At 10 μm zolpidem, ketoconazole inhibited M-3 metabolite formation with a mean IC50 of 0.61 μm (Table 2); in contrast, ketoconazole inhibits triazolam hydroxylation in vitro with IC50 values approximately an order of magnitude smaller[24]. The findings are similar for two other azole antifungal agents, itraconazole and fluconazole. In clinical studies, both of these drugs cause large increases in AUC for oral triazolam and midazolam[29–32], whereas they increased zolpidem AUC by factors in the range of only 1.2–1.4[22, 33]. This is likewise reflected in corresponding differences in IC50 values in vitro[24]. Norfluoxetine, the principal metabolite of fluoxetine in humans, is a moderately potent CYP3A inhibitor in vitro and in many clinical studies[34]. Norfluoxetine inhibits triazolam hydroxylation in vitro[18], but fluoxetine coadministration produced only a small increase in triazolam AUC in vivo[35]. Fluoxetine treatment also produced minimal alteration of zolpidem clearance in human volunteers[36, 37].
The influence of rifampicin, a potent CYP3A inducer, on clearance of oral triazolam, midazolam, and zolpidem has also been evaluated in clinical pharmacokinetic studies. Pretreatment with rifampicin increased clearance and reduced AUC of all three compounds, but the degree of induction of triazolam and midazolam clearance was greater than for zolpidem[38–40].
Inhibition constants from in vitro studies have been used for quantitative forecasting of pharmacokinetic drug interactions[28, 41–49]. The applicability of such scaling models is limited, because the concentration of inhibitor to which the enzyme is exposed in vivo cannot be easily identified. We calculated the anticipated enzyme-available concentrations of inhibitor based on a controlled clinical pharmacokinetic study in which single doses of zolpidem were administered to healthy volunteers in the control condition and during coadministration of therapeutic doses of ketoconazole, itraconazole, and fluconazole[22]. Fractional decrements in mean values of zolpidem oral clearance were; 0.41 with ketoconazole, 0.24 with itraconazole, and 0.20 with fluconazole. The mean trough (minimum) steady-state total plasma concentration (Css) of the respective inhibitors measured during this study were: 1.78 μm ketoconazole; 0.05 μm itraconazole (and 0.19 μm hydroxy-itraconazole); and 11.7 μm fluconazole. The fractional decrement in reaction velocity in vitro in relation to concentration of inhibitor (I) can be approximated by I/(I+IC50), if IC50 has been determined at concentrations of substrate well below the reaction Km. Accordingly the IC50 in this equation was taken as the mean value determined at 10 μm zolpidem (Table 3). Equating this result to the observed decrement of clearance in vivo yields an estimate of I to which the enzyme is exposed in vivo. For ketoconazole and fluconazole, estimated enzyme-available values of I were 23% and 43% of actual total Css, respectively. Since hydroxy-itraconazole and itraconazole have essentially identical 3A-inhibiting potency in vitro[24], the sum of Css values for the two compounds were added, yielding an estimate of enzyme-available I exceeding the net Css by a factor of 20.4.
Although ketoconazole and itraconazole both are more than 98% bound to plasma components, these data, together with other clinical findings and experimental studies of partitioning into liver tissue, strongly indicate that plasma binding cannot be assumed to restrict hepatic uptake, and unbound plasma concentrations cannot be assumed to be equal to the concentrations available to the enzyme[18, 47, 48, 50, 51]. For fluconazole, which is only weakly protein-bound, apparent enzyme-available concentrations were 43% of total plasma levels. Enzyme availability of these and other metabolic inhibitors is likely to depend on a complex combination of lipophilicity, plasma binding, and intrahepatic binding both to metabolic enzymes and to other nonspecific sites[41–43, 47, 49, 52].
Acknowledgments
This work was supported by Grants MH-34223, DA-05258, MH-19924, and RR-00054 from the Department of Health and Human Services. Dr von Moltke is the recipient of a Scientist Development Award (K21-MH-01237) from the National Institutes of Mental Health.
References
- 1.Nowell PD, Mazumdar S, Buysse DJ, et al. Benzodiazepines and zolpidem for chronic insomnia: a meta-analysis of treatment efficacy. JAMA. 1997;278:2170–2176. [PubMed] [Google Scholar]
- 2.Roth T, Puech AJ, Paiva T. Zolpidem—place in therapy. In: Freeman H, Puech AJ, Roth T, editors. Zolpidem: an Update of its Pharmacological Properties and Thereapeutic Place in the Management of Insomnia. Paris: Elsevier; 1996. pp. 215–230. [Google Scholar]
- 3.Hoehns JD, Perry PJ. Zolpidem: a nonbenzodiazepine hypnotic for treatment of insomnia. Clin Pharm. 1993;12:814–828. [PubMed] [Google Scholar]
- 4.Langtry HD, Benfield P. Zolpidem: a review of its pharmacodynamic and pharmacokinetic properties and therapeutic potential. Drugs. 1990;40:291–313. doi: 10.2165/00003495-199040020-00008. [DOI] [PubMed] [Google Scholar]
- 5.Sanger DJ, Benavides J, Perrault G, et al. Recent developments in the behavioral pharmacology of benzodiazepine receptors: evidence for the functional significance of receptor subtypes. Neurosci Biobehav Rev. 1994;18:355–372. doi: 10.1016/0149-7634(94)90049-3. [DOI] [PubMed] [Google Scholar]
- 6.Byrnes JJ, Greenblatt DJ, Miller LG. Benzodiazepine receptor binding of non-benzodiazepines in vivo: alpidem, zolpidem, and zopiclone. Brain Res Bull. 1992;29:905–908. doi: 10.1016/0361-9230(92)90164-s. [DOI] [PubMed] [Google Scholar]
- 7.Salvà P, Costa J. Clinical pharmacokinetics and pharmacodynamics of zolpidem: therapeutic implications. Clin Pharmacokin. 1995;29:142–153. doi: 10.2165/00003088-199529030-00002. [DOI] [PubMed] [Google Scholar]
- 8.Durand A, Thénot JP, Bianchetti G, et al. Comparative pharmacokinetic profile of two imidazopyridine drugs: zolpidem and alpidem. Drug Metab Rev. 1992;24:239–166. doi: 10.3109/03602539208996294. [DOI] [PubMed] [Google Scholar]
- 9.Ascalone V, Flaminio L, Guinebault P, et al. Determination of zolpidem, a new sleep-inducing agent, and its metabolites in biological fluids: pharmacokinetics, drug metabolism and overdosing investigations in humans. J Chromatogr. 1992;581:237–250. doi: 10.1016/0378-4347(92)80277-w. [DOI] [PubMed] [Google Scholar]
- 10.Hempel G, Blaschke G. Direct determination of zolpidem and its main metabolites in urine using capillary electrophoresis with laser-induced flourescence detection. J Chromatogr B. 1996;675:131–137. doi: 10.1016/0378-4347(95)00342-8. [DOI] [PubMed] [Google Scholar]
- 11.Pichard L, Gillet G, Bonfils C, et al. Oxidative metabolism of zolpidem by human liver cytochrome P450s. Drug Metab Dispos. 1995;23:1253–1262. [PubMed] [Google Scholar]
- 12.Venkatakrishnan K, Greenblatt DJ, von Moltke LL, et al. Five distinct human cytochromes mediate amitriptyline N-demethylation in vitro: dominance of CYP 2C19 and 3A4. J Clin Pharmacol. 1998;38:112–121. doi: 10.1002/j.1552-4604.1998.tb04399.x. [DOI] [PubMed] [Google Scholar]
- 13.Venkatakrishnan K, von Moltke LL, Greenblatt DJ. Relative quantities of catalytically active CYP 2C9 and 2C19 in human liver microsomes: application of the relative activity factor approach. J Pharm Sci. 1998;87:845–853. doi: 10.1021/js970435t. [DOI] [PubMed] [Google Scholar]
- 14.Crespi CL. Xenobiotic-metabolizing human cells as tools for pharmacological and toxicological research. Adv Drug Res. 1995;26:179–235. [Google Scholar]
- 15.Crespi CL, Penman BW. Use of cDNA-expressed human cytochrome P450 enzymes to study potential drug–drug interactions. Adv Pharmacol. 1997;43:171–188. doi: 10.1016/s1054-3589(08)60205-7. [DOI] [PubMed] [Google Scholar]
- 16.von Moltke LL, Greenblatt DJ, Cotreau-Bibbo MM, et al. Inhibition of desipramine hydroxylation in vitro by serotonin-reuptake-inhibitor antidepressants, and by quinidine and ketoconazole: a model system to predict drug interactions in vivo. J Pharmacol Exp Ther. 1994;268:1278–1283. [PubMed] [Google Scholar]
- 17.von Moltke LL, Greenblatt DJ, Cotreau-Bibbo MM, et al. Inhibitors of alprazolam metabolism in vitro: effect of serotonin-reuptake-inhibitor antidepressants, ketoconazole and quinidine. Br J Clin Pharmacol. 1994;38:23–31. doi: 10.1111/j.1365-2125.1994.tb04317.x. [DOI] [PMC free article] [PubMed] [Google Scholar]
- 18.von Moltke LL, Greenblatt DJ, Harmatz JS, et al. Triazolam biotransformation by human liver microsomes in vitro: effects of metabolic inhibitors, and clinical confirmation of a predicted interaction with ketoconazole. J Pharmacol Exp Ther. 1996;276:370–379. [PubMed] [Google Scholar]
- 19.Schmider J, Greenblatt DJ, Harmatz JS, et al. Enzyme kinetic modeling as a tool to analyse the behaviour of cytochrome P450 catalysed reactions: application to amitriptyline N-demethylation. Br J Clin Pharmacol. 1996;41:593–604. doi: 10.1046/j.1365-2125.1996.35717.x. [DOI] [PMC free article] [PubMed] [Google Scholar]
- 20.von Moltke LL, Greenblatt DJ, Grassi JM, et al. Protease inhibitors as inhibitors of human cytochromes P450: high risk associated with ritonavir. J Clin Pharmacol. 1998;38:106–111. doi: 10.1002/j.1552-4604.1998.tb04398.x. [DOI] [PubMed] [Google Scholar]
- 21.Shimada T, Yamazaki H, Mimura M, et al. Interindividual variations in human liver cytochrome P-450 enzymes involved in the oxidation of drugs, carcinogens and toxic chemicals: studies with liver microsomes of 30 Japanese and 30 Caucasians. J Pharmacol Exp Ther. 1994;270:414–423. [PubMed] [Google Scholar]
- 22.Greenblatt DJ, von Moltke LL, Harmatz JS, et al. Kinetic and dynamic interaction study of zolpidem with ketoconazole, itraconazole, and fluconazole. Clin Pharmacol Ther. 1998;64:661–671. doi: 10.1016/S0009-9236(98)90057-1. [DOI] [PubMed] [Google Scholar]
- 23.Newton DJ, Wang RW, Lu AYH. Cytochrome P450 inhibitors: evaluation of specificities in the in vitro metabolism of therapeutic agents by human liver microsomes. Drug Metab Dispos. 1995;23:154–158. [PubMed] [Google Scholar]
- 24.von Moltke LL, Greenblatt DJ, Duan SX, et al. Inhibition of triazolam hydroxylation by ketoconazole, itraconazole, hydroxyitraconazole and fluconazole in vitro. Pharmac Pharmacol Comm. 1998;4:443–445. [Google Scholar]
- 25.Elkins S, Ring BJ, Binkley SN, et al. Autoactivation and activation of the cytochrome P450s. Int J Clin Pharmacol Ther. 1998;36:642–651. [PubMed] [Google Scholar]
- 26.Korzekwa KR, Krishnamachary N, Shou M, et al. Evaluation of Atypical Cytochrome P 450 kinetics with two-substrate models: evidence that multiple substrates can simultaneously bind to cytochrome P450 active sites. Biochemistry. 1998;37:4137–4147. doi: 10.1021/bi9715627. [DOI] [PubMed] [Google Scholar]
- 27.Venkatakrishnan K, von Moltke LL, Greenblatt DJ. Human cytochromes P450 mediating phenacetin O-deethylation in vitro: validation of the high affinity component as an index of CYP1A2 activity. J Pharm Sci. 1998;87:1502–1507. doi: 10.1021/js980255z. [DOI] [PubMed] [Google Scholar]
- 28.Greenblatt DJ, Wright CE, von Moltke LL, et al. Ketoconazole inhibition of triazolam and alprazolam clearance: differential kinetic and dynamic consequences. Clin Pharmacol Ther. 1998;64:237–247. doi: 10.1016/S0009-9236(98)90172-2. [DOI] [PubMed] [Google Scholar]
- 29.Olkkola K, Ahonen J, Neuvonen P. The effect of the systemic antimycotics, itraconazole and fluconazole, on the pharmacokinetics and pharmacodynamics of intravenous and oral midazolam. Anesthes Analges. 1996;82:511–516. doi: 10.1097/00000539-199603000-00015. [DOI] [PubMed] [Google Scholar]
- 30.Varhe A, Olkkola KT, Neuvonen PJ. Oral triazolam is potentially hazardous to patients receiving systemic antimycotics ketoconazole or itraconazole. Clin Pharmacol Ther. 1994;56:601–607. doi: 10.1038/clpt.1994.184. [DOI] [PubMed] [Google Scholar]
- 31.Varhe A, Olkkola KT, Neuvonen PJ. Fluconazole, but not terbinafine, enhances the effects of triazolam by inhibiting its metabolism. Br J Clin Pharmacol. 1996;41:319–323. doi: 10.1046/j.1365-2125.1996.03189.x. [DOI] [PMC free article] [PubMed] [Google Scholar]
- 32.Olkkola KT, Backman JT, Neuvinen PJ. Midazolam should be avoided in patients receiving the systemic antimycotics ketoconazole or itraconazole. Clin Pharmacol Ther. 1994;55:481–485. doi: 10.1038/clpt.1994.60. [DOI] [PubMed] [Google Scholar]
- 33.Luurila H, Kivistö KT, Neuvonen PJ. Effect of itraconazole on the pharmacokinetics and pharmacodynamics of zolpidem. Eur J Clin Pharmacol. 1998;54:336–340. doi: 10.1007/s002280050439. [DOI] [PubMed] [Google Scholar]
- 34.Greenblatt DJ, von Moltke LL, Schmider J, et al. Inhibition of human cytochrome P; 450–3A isoforms by fluoxetine and norfluoxetine: in vitro and in vivo studies. J Clin Pharmacol. 1996;36:792–798. doi: 10.1002/j.1552-4604.1996.tb04252.x. [DOI] [PubMed] [Google Scholar]
- 35.Wright CE, Lasher-Sisson TA, Steenwyk RC, et al. A pharmacokinetic evaluation of the combined administration of triazolam and fluoxetine. Pharmacotherapy. 1992;12:103–106. [PubMed] [Google Scholar]
- 36.Piergies AA, Sweet J, Johnson M, et al. The effect of co-administration of zolpidem with fluoxetine: pharmacokinetics and pharmacodynamics. Int J Clin Pharmacol Ther. 1996;34:178–183. [PubMed] [Google Scholar]
- 37.Allard S, Sainati S, Roth-Schechter B, et al. Minimal interaction between fluoxetine and multiple-dose zolpidem in healthy women. Drug Metab Dispos. 1998;26:617–622. [PubMed] [Google Scholar]
- 38.Villikka K, Kivistö KT, Backman JT, et al. Triazolam is ineffective in patients taking rifampin. Clin Pharmacol Ther. 1997;61:8–14. doi: 10.1016/S0009-9236(97)90176-4. [DOI] [PubMed] [Google Scholar]
- 39.Villikka K, Kivistö KT, Luurila H, et al. Rifampin reduces plasma concentrations and effects of zolpidem. Clin Pharmacol Ther. 1997;62:629–634. doi: 10.1016/S0009-9236(97)90082-5. [DOI] [PubMed] [Google Scholar]
- 40.Backman JT, Olkkola KT, Neuvonen PJ. Rifampin drastically reduces plasma concentrations and effects of oral midazolam. Clin Pharmacol Ther. 1996;59:7–13. doi: 10.1016/S0009-9236(96)90018-1. [DOI] [PubMed] [Google Scholar]
- 41.Tucker GT. The rational selection of drug interaction studies: implications of recent advances in drug metabolism. Int J Clin Pharmacol Ther Toxicol. 1992;30:550–553. [PubMed] [Google Scholar]
- 42.Boobis AR. Prediction of inhibitory drug–drug interactions by studies in vitro. In: Pacifici GM, Fracchia GN, editors. Advances in Drug Metabolism in Man. Luxembourg: the European Commission; 1995. pp. 513–539. [Google Scholar]
- 43.Leemann TD, Dayer P. Quantitative prediction of in vivo drug metabolism and interactions from in vitro data. In: Pacifici GM, Fracchia GN, editors. Advances in Drug Metabolism in Man. Luxembourg: the European Commission; 1995. pp. 783–830. [Google Scholar]
- 44.Rodrigues AD, Wong SL. Application of human liver microsomes in metabolism-based drug-drug interations: in vitro-in vivo correlations and the Abbott Laboratories experience. Adv Pharmacol. 1997;43:65–101. doi: 10.1016/s1054-3589(08)60202-1. [DOI] [PubMed] [Google Scholar]
- 45.Bertz RJ, Granneman GR. Use of in vitro and in vivo data to estimate the likelihood of metabolic pharmacokinetic interactions. Clin Pharmacokin. 1997;32:210–258. doi: 10.2165/00003088-199732030-00004. [DOI] [PubMed] [Google Scholar]
- 46.von Moltke LL, Greenblatt DJ, Schmider J, et al. Metabolism of drugs by Cytochrome P450, 3A isoforms: implications for drug interactions in psychopharmacology. Clin Pharmacokin. 1995;29(Suppl 1):33–43. doi: 10.2165/00003088-199500291-00007. [DOI] [PubMed] [Google Scholar]
- 47.von Moltke LL, Greenblatt DJ, Schmider J, et al. In vitro approaches to predicting drug interactions in vivo. Biochem Pharmacol. 1998;55:113–122. doi: 10.1016/s0006-2952(97)00239-6. [DOI] [PubMed] [Google Scholar]
- 48.Greenblatt DJ, von Moltke LL. Can in vitro models predict drug interactions in vivo? A review of methods, problems, and successes. In: Southboro W Hori., editor. Drug–Drug Interactions: Analyzing in Vitro-in Vivo Correlations. MA: International Business Communications; 1997. pp. 2.2.1–2.2.28. [Google Scholar]
- 49.Ito K, Iwatsubo T, Kanamitsu S, et al. Quantitative prediction of in vivo drug clearance and drug interactions from in vitro data on metabolism, together with binding and transport. Ann Rev Pharmacol Toxicol. 1998;38:461–499. doi: 10.1146/annurev.pharmtox.38.1.461. [DOI] [PubMed] [Google Scholar]
- 50.Heykants J, Michiels M, Meuldermans W. The pharmacokinetics of itraconazole in animals and man: an overview. In: Fromtling R JR, et al., editors. Recent Trends in the Discovery, Development and Evaluation of Antifungal Agents. Prous, Barcelona: Science Publishers; 1987. pp. 223–249. [Google Scholar]
- 51.Heykants J, van Peer A, van de Velde V, et al. The clinical pharmacokinetics of itraconazole: an overview. Mycoses. 1989;32(Suppl 1):67–87. doi: 10.1111/j.1439-0507.1989.tb02296.x. [DOI] [PubMed] [Google Scholar]
- 52.Obach RS. Nonspecific binding to microsomes. Drug Metab Dispos. 1997;25:1359–1369. [PubMed] [Google Scholar]