Abstract
Aims
To use pharmacostatistical models to characterize tolcapone's pharmacokinetics in parkinsonian patients, and to identify any demographic subpopulations which may be at risk of either under- or over-exposure to this catechol-O-methyltransferase (COMT) inhibitor.
Methods
Four hundred and twelve patients participated in three multicentre, parallel, double-blind, placebo-controlled, dose-finding studies and received either placebo or tolcapone (50, 200 or 400 mg three times daily) in addition to levodopa/decarboxylase inhibitor therapy. Sparse blood samples were obtained from 275 patients for tolcapone assay and the concentrations (1414 in total) were analysed using the NONMEM program.
Results
The pharmacokinetic model which best described the data was a two-compartment open model with first-order absorption and possibly a lag-time. Tolcapone pharmacokinetics were shown to be stable, with no systematic trend between 2 and 6 weeks of treatment. The absorption of the drug was shown to be rapid and concomitant food intake had only a minor effect on the relative bioavailability (10–20% reduction compared with fasting). The overall clearance of tolcapone could be estimated with good precision (approximately 4.5–5 l h−1), and none of the investigated covariates (e.g. sex, age, body weight) had any clinically significant influence on this parameter. The volume of distribution showed relatively high variability and was calculated to be approximately 30 l, leading to an estimated half-life in patients of approximately 5–8 h.
Conclusions
Using sparse concentrations and mixed effect-effects modelling analysis it is possible to describe the pharmacokinetics of tolcapone in parkinsonian populations. The parameter estimates obtained agreed with those obtained from conventional pharmacokinetic studies and no subpopulation was shown to be at risk of either under- or over-exposure to tolcapone.
Keywords: COMT inhibitor, pharmacokinetics, tolcapone
Introduction
Tolcapone (3,4-dihydroxy-4′-methyl-5-nitrobenzophenone) is a catechol-O-methyltransferase (COMT) inhibitor which has been developed to improve the pharmacokinetics of levodopa and is used as an adjunct to combined levodopa and aromatic amino acid decarboxylase (AADC) inhibitor therapy [1, 2]. In the presence of AADC inhibition, 3-O-methylation of levodopa via COMT is the most important metabolic pathway, leading to fast elimination of levodopa and accumulation of its metabolite 3-O-methyldopa. Therefore tolcapone, as a potent, specific, and reversible COMT inhibitor, increases the availability of levodopa and ensures more constant levodopa delivery to the brain [3–7].
The pharmacokinetics and pharmacodynamics of tolcapone in healthy volunteers have been investigated in several studies [3, 4, 8–10] and have been reviewed elsewhere [11, 12]. The maximum concentration (Cmax) of tolcapone reached in elderly, healthy subjects after repeated administration of 200 mg three times daily was approximately 6–7 μg ml−1, and the area under the curve (AUC) was approximately 24–27 μg ml−1 h [4, 9]. These previous studies have also shown that the pharmacokinetics of tolcapone are linear and are characterized by rapid absorption and elimination; 2 h is the approximate terminal half-life (t1/2,λz) for tolcapone in healthy volunteers [4, 9].
The current study aimed to evaluate and characterize the pharmacokinetics of tolcapone in the target population of parkinsonian patients. The main objective was to use pharmacostatistical models to identify any demographic subpopulations, which may be at risk of either under- or over-exposure to tolcapone. We therefore included the collection of blood samples for pharmacokinetic evaluation in the dose-finding trials for tolcapone in parkinsonian patients who have a stable response to levodopa (i.e. are nonfluctuators) and those who exhibit fluctuations in their levodopa response (i.e. are fluctuators). Based on the pathophysiology of the disease, we did not expect there to be any differences in the pharmacokinetics of tolcapone between fluctuators and nonfluctuators. However, for practical purposes, the data from the two populations were analysed separately.
Methods
Subjects
A total of 412 patients with Parkinson's disease (262: (64%) males and 150 (36%) females) participated in the three dose-finding phase II studies from 49 centres world-wide. Two studies were in fluctuators and the third was in nonfluctuators. Local ethics committee approval was obtained, and each patient gave informed consent before screening for the study. Tolcapone pharmacokinetics could be evaluated in 275 patients (215 fluctuators and 60 nonfluctuators). A total of 981 concentration measurements were taken in fluctuators and 433 in nonfluctuators. The studies were conducted in full compliance with the principles of the Declaration of Helsinki (as amended in Tokyo, Venice and Hong Kong) or with the laws and regulations of the country in which the research was conducted, whichever afforded the greater protection to the individual.
The inclusion criteria for the studies have been described in previous publications focusing on the efficacy and safety aspects of the trials [13–15]. All patients were treated with either levodopa-carbidopa (Sinemet®) or levodopa-benserazide (Madopar®), and their dosage regimen was stable for at least one month prior to the start of the study. Most other antiparkinsonian drugs were excluded but, depending on the study group, some patients were allowed to take monoamine oxidase B inhibitors or dopamine agonists, other than apomorphine.
The demographics and the baseline laboratory values for the trial population are given in Table 1. The distribution of age, lean body weight (LBW) and creatinine clearance (CLCr) are shown in Figure 1. CLCr was calculated as: CLCr (ml min−1) = factor 1*(140-age)*BW/serum creatinine where factor 1 is 1.23 for males and 1.04 for females, BW is measured in kg, and serum creatinine in μm [16]. LBW was calculated as: LBW (kg) = (1.10*BW-128*BW2)/height2 for males, and LBW (kg) = (1.07*BW-148*BW2)/height2 for females, where BW is measured in kg, and height in cm [17, 18].
Table 1.
The demographic characteristics and baseline laboratory values for the trial population. The sample included 402 (98%) Caucasians, 1 black, 3 Orientals, and 6 patients of other ethnic origin. Of the trial population, 23% (n = 95) of patients received dopamine agonists, 87% reported drinking caffeine (n = 358), 57% (n = 234) reported drinking alcohol and 10% (n = 42) were smokers. All data are given as median values (minimum—maximum value).
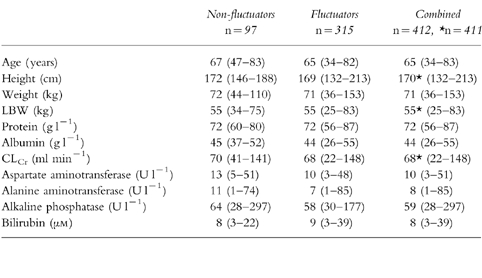
Figure 1.
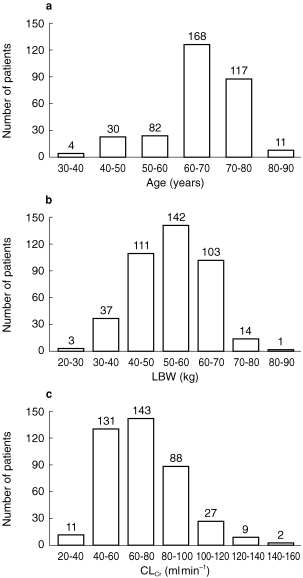
The distribution of a) age, b) LBW and c) CLCr values recorded in the sample population.
Correlation analysis revealed that the following variables were highly correlated according to the Spearman correlation coefficient (r2): age and CLCr(−0.62); height and body weight (BW) (0.65); height and LBW (0.87); BW and LBW (0.89); LBW and CLCr (0.61); aspartate transferase and alanine transferase (0.69).
Study design
All three studies were multicentre, parallel, placebo-controlled dose-finding studies. All patients entered a single-blind placebo run-in period of 1 or 2 weeks (placebo-baseline period) before entering a double-blind phase in which they were randomized to either continue receiving placebo or were given tolcapone. The tolcapone doses in the fluctuator studies were 50 mg (n = 75), 200 mg (n = 74) and 400 mg (n = 66) three times daily, whereas the patients randomized to tolcapone in the nonfluctuator study received either 200 mg (n = 33) or 400 mg (n = 29) three times daily for 6 weeks. The first dose of tolcapone or placebo was taken together with the first daily intake of levodopa, and the second and third intakes were at 6 h intervals.
Patients in the fluctuating groups continued to follow their usual dosage regimen of levodopa/AADC inhibitor (either carbidopa or benserazide) during the study period, unless levodopa dose reduction was felt necessary to control dopaminergic side-effects. However, the levodopa dosage could not be changed during the placebo run-in period or on the first day of the double-blind treatment. In the nonfluctuators, the levodopa dose of each patient was reduced by approximately 33–43% on the first day of test treatment, with the option to increase the dose again during the study to restore the therapeutic response. No increase in levodopa dose above baseline dosage was permitted in any of the studies. Generally, no dietary restrictions were specified and the relationship of food to drug intake was recorded.
A total of 5–8 blood samples was taken from each patient on 2–5 occasions. Blood samples were taken at baseline (i.e. prior to treatment during the placebo run-in period) and either on day 14, 21 or 28, and in all patients on day 42. During the treatment phase, the objective was to collect blood samples from each patient before drug intake, close to the time of Cmax for tolcapone and during the concentration decline phase. Therefore, blood samples (10 ml) were taken before the first dose of tolcapone or placebo and between 0.5 and 2 h and 3–4 h after intake.
Sample preparation
Blood samples were collected in ethylene diamine tetraacetic acid tubes, and separated by means of centrifugation at 4° C. The plasma samples were then stored at −40° C or less until analysis. Plasma concentrations of tolcapone were determined by reversed phase h.p.l.c. on Inertsil ODS 2 (5 μm) with isocratic elution and u.v. detection. The mobile phase consisted of a phosphate buffer/methanol mixture with tetrahydrofuran as modifier. The limit of quantification was approximately 0.1 μg ml−1. Further details of the analytical procedure have been described previously [19].
Data analysis
Model development
The goal of the modelling process was to determine a basic pharmacokinetic and statistical model which best describes the data. The model-building strategy used in this study consisted of four steps: the development of a basic population model, covariate model selection, full model selection, and finally model verification. The data from fluctuators and nonfluctuators were analysed separately and each potential influencing factor (covariate) was investigated individually. The two different datasets were used to avoid bias and for validation purposes, as well as keeping computation time manageable. Although the same procedures were applied for the different datasets, where possible the approach was varied. For example, the order of factors included into the model was altered to avoid potential procedure bias.
Data analysis was performed by means of nonlinear mixed effect models using the software package NONMEM version IV with double precision [20, 21]. Data input and data retrieval was facilitated with SAS programs. During the model-building process the First Order estimation method was used. Final estimates were obtained with the First Order Conditional Expectation method whenever possible.
Step 1: Basic population model
NONMEM's model library was used to define the basic population pharmacokinetic model (without covariates). Since all blood samples were taken after multiple dosing, steady-state calculations were applied. It was assumed that the dosing information on the day before blood sampling was representative for an individual patient and this regimen was used to generate steady-state concentrations. One and two compartment models (ADVAN1 to ADVAN4) were applied. As tolcapone might be absorbed by passive diffusion or an active transport system [22] zero or first-order input models and the inclusion or exclusion of a lag-time (tlag) were investigated. All models were parameterized in terms of absorption rate constant (ka) or duration of zero order input (t0), clearance (CL) and intercompartment clearance (Q), and volume of distribution (V; central volume, Vc, and peripheral volume, Vp) using the subroutine TRANS2 for the one compartment model and TRANS4 for the two compartment model. The absolute bioavailability ‘fasted’ (F1) was fixed to 0.6 [22].
Modelling of covariates
The influence of a covariate was modelled according to the following equations:
Continuous covariates (using BW as an example):
where TV(CL) is the typical value of clearance for a patient with the median covariate value (covariate specific typical value) and θBW is the estimated influence factor for body weight.
Categorical covariates (using sex as an example):
where ISex = Indicator variable sex (0 = male, 1 = female), θSex = V in females relative to males, TV(V) = Covariate specific typical value of volume (in this case for males)
Modelling of random effects
Random effects were modelled according to the following equations:
Intra-subject errors (residual errors: ε):
where εmult. and εadd. are normally distributed with expectation 0 and variances σ2mult. and σ2add. DV is the measured and CP the individually predicted concentration.
Inter-subject errors (biological variability: η): for example,
where ηCL is normally distributed with expectation 0 and variance σ2CL.
Inter-occasion variability (IOV): for example,
where CLij and ηij are the CL and the random IOV effect of the ith patient in period j, respectively [23]. Samples from study day 14 were assigned to period 1, samples from study days 21 or 28 to period 2 (no patient had samples at both days), and those from study day 42 were assigned to period 3.
Step 2. Covariate model selection
Estimates of individual parameters (so called POSTHOC estimates) and the differences between these and the population mean (ηi) were used for diagnostic plots for covariate selection. Log-transformed POSTHOC pharmacokinetic parameters or ηi were plotted vs the log-transformed covariates, and linear regression analyses were performed. For categorical covariates, analysis of variance (anova) was used with the log-transformed pharmacokinetic parameters as dependent variables and the categorical covariates as factors.
Individual covariates were temporarily included in the model and were only kept in the final model if the criteria outlined below (see Step 3. Full model selection) were met. The covariates with lowest P-value were included first. However, covariates that were thought to influence the pharmacokinetics based on physiological considerations, such as BW on V, were added temporarily to the model—even if they did not appear to, based on the graphical evaluation and the statistical pretests. The following continuous and categorical covariates were tested for significance: BW, height, the derived parameter LBW, tolcapone dose (i.e. 50 mg, 200 mg or 400 mg three times daily), duration of treatment, concomitant food intake, sex, age, albumin, protein, CLCr, smoking, coadministration of dopamine agonists, bilirubin, alkaline phosphatase and aspartate aminotransferase. The influence of race on the pharmacokinetics of tolcapone could not be estimated because only a few non-Caucasians participated in the trial.
Step 3. Full model selection
Covariate relationships were investigated further to confirm the absence of a relationship and to explore the possible substitution of one covariate with another with which it is correlated (e.g. BW and LBW) and to test whether a covariate which is significantly related to one parameter may be tested for a relationship with another parameter, where the two show correlation. To evaluate the significance of covariate effects, the difference in minimum value of the objective function (OF) provided by NONMEM between a model with and without a specific covariate relationship was compared with a χ2 distribution in which differences of 4, 6 and 11 were considered significant at the 5%, 1% and 0.1% levels, respectively. The 5% level was used as the default threshold. If the decision between the two alternative models was borderline, the following criteria were used to distinguish between them: (a) standard error (s.e.) of the estimates (parameter precision); (b) the overall goodness of fit, assessed by evaluation of plots of predicted (PRED) vs DV, residual (RES) vs PRED, weighted residuals (WRES) vs PRED, and the individual weighted residuals (IWRES) vs the individual predictions (IPRED). If no decision in favour of one or the other could be reached according to the above criteria, the model building process was continued using both options in parallel until a clear discrimination became obvious based on the previous criteria.
Step 4. Model verification
To explore the robustness of the final model, the covariates, certain characteristics of the structural model (e.g. absorption tlag), and the statistical model (e.g. correlation of random effects) were removed in a stepwise manner in order to ensure that each part of the model had a significant contribution [24].
Secondary pharmacokinetic parameters
Once the final model had been verified, the additional secondary pharmacokinetic parameters AUC and t1/2,λz were calculated for each subject based on the individual estimates of CL, Q, Vc and Vp. For AUC the following equation was used: AUC=dose*FRel/CL, where FRel is the relative bioavailability based on the absolute bioavailability fasted (F1) of 0.6 [22] and any additional covariate (e.g. food). The t1/2,λz was calculated as:
where
Results
The final model
The final models derived independently for both the fluctuator and nonfluctuator datasets were very similar in most aspects. For both datasets a two-compartment open model with first-order absorption fit the data best. A few minor modifications were used to optimize the fit for both datasets. In contrast to the nonfluctuator model, the tlag was excluded from the fluctuator model (see Model verification below). For CL and VP (and Vc for the fluctuator data) the inclusion of log normal intersubject error models improved the fit.
For the fluctuator dataset a random interoccasion variability was found to be significant for Vp. The intrasubject error was estimated using a proportional model and covariates were included into the final model according to the following equations:
Equations for the fluctuator dataset.
 |
 |
For the nonfluctuator dataset interoccasion variability for CL was found to be significant and was included into the model. The intrasubject error was estimated using a combined multiplicative and additive model. Covariates were included into the final model according to the following equations:
Equations for the nonfluctuator dataset.
Model verification
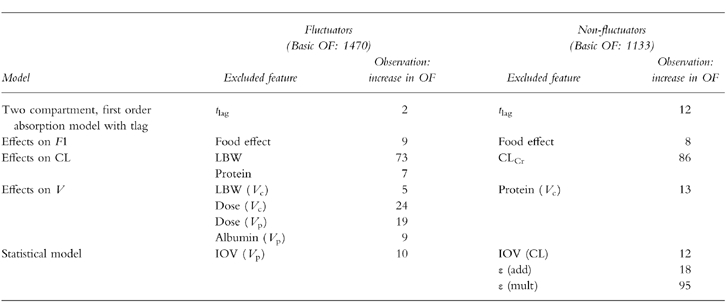
All exclusions of the individual parts of the models led to deterioration of the fit. Table 2 summarizes the effects of the model verification process on the OF values. It was verified that the inclusion of a tlag in the fluctuator model was not necessary as the temporary inclusion and then exclusion of this parameter changed the OF value by only 2 units.
Table 2.
Summary of effects from model verification.
Final estimates
A summary of the parameter estimates together with their precision is given in Table 3 and an example of how the modified model predicts the tolcapone plasma concentration for the 200 mg group of the fluctuator dataset is illustrated in Figure 2. A similar pattern was obtained with the other doses and dataset.
Table 3.
Summary of results from the final models.
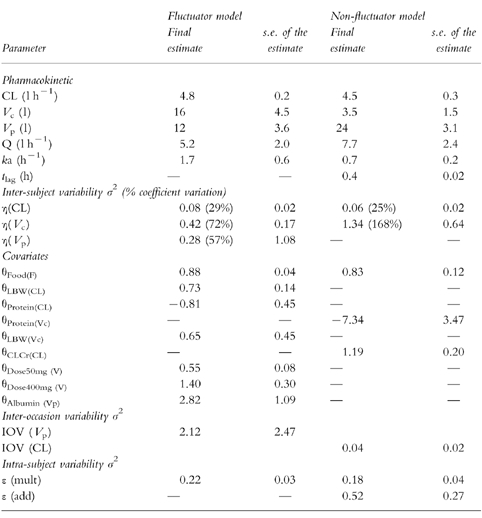
Figure 2.
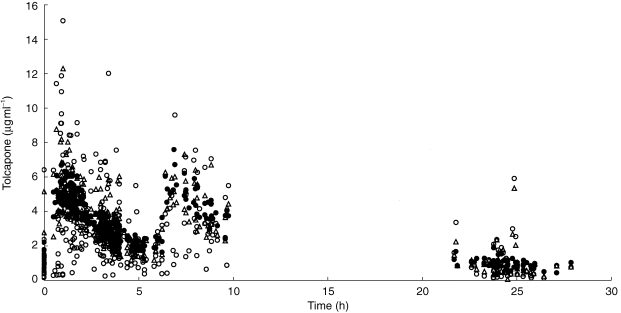
Measured (DV, ○), individually predicted (CP, ▵) and typically predicted (PRED, •) concentrations of tolcapone vs time for the 200 mg dose in the fluctuator data set. The time is given relative to the first drug intake of the day (time 0) with subsequent drug intakes at 6 and 12 hours.
Tolcapone was rapidly absorbed with a typical ka of 1.7 h−1 in the absence of a tlag (fluctuators) or with a typical ka of 0.7 h−1 after a tlag of approximately 0·5 h (nonfluctuators). Although concomitant food intake had no effect on ka or tlag, it was shown to decrease F1 fasted by approximately 10–15% in fluctuators and 15–20% in nonfluctuators.
In both datasets, tolcapone's total V (Vc plus Vp) was estimated to be approximately 28 l after 200 mg tolcapone three times daily. The intersubject variability of this parameter was high. During the model development process, the individual estimates for Vc plus Vp varied, but the sum of both was always around 30 l. Although V was independent of dose in nonfluctuators (both within and between patients), the V increased with increasing doses of tolcapone in fluctuators and, taking the estimated factors into account, the total V with 50 mg three times daily and 400 mg three times daily was 15 l and 39 l, respectively. Other influencing factors on V in fluctuators included LBW on Vc and serum albumin on Vp, and in nonfluctuators serum protein levels on Vc. However, these factors could only be estimated with relatively poor parameter precision. They were also relatively small and may have been driven by a few very high V estimates.
For both patient groups, CL was the pharmacokinetic parameter that could be obtained with the best precision. For both datasets this parameter was estimated to be typically around 4.6 l h−1 with an intersubject variability of approximately 30%. Estimates for both CL and intersubject variability were stable throughout the model development process. As shown in Figure 3, CL appeared to increase with LBW in the fluctuator dataset. The CL estimated for the nonfluctuators increased with increasing CLCr, although this effect was relatively modest. This is shown in Figure 4.
Figure 3.
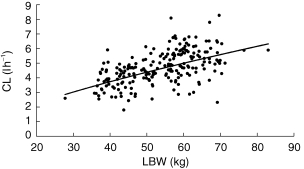
Graph showing the relationship between LBW (kg) and POSTHOC estimates of CL (l h−1). The line illustrates the prediction of the model.
Figure 4.
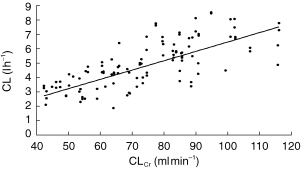
Graph showing the relationship between CLCr (ml min−1) and POSTHOC estimates of CL (l h−1). The line illustrates the prediction of the model.
The absence of an influence of treatment duration in the final model indicates that tolcapone pharmacokinetics do not change systematically between 2 and 6 weeks of multiple dose treatment. Similarly, age or sex did not show an influence in the final model, indicating that neither of these parameters have an important effect. In the fluctuator dataset, the pharmacokinetics of tolcapone were also independent of CLCr and coadministration of dopamine agonists. In the nonfluctuator dataset, the pharmacokinetics were independent of tolcapone dose, BW and albumin levels.
The average values for the secondary parameters AUC and t1/2,λz for each dose are summarized in Table 4. As expected for the fluctuators, the AUC values are dose proportional due to the independence of CL from dose. However, the apparent t1/2,λz of tolcapone is increasing with dose due to the dose dependency of V.
Table 4.
Calculated AUC and t1/2,λz for tolcapone after multiple dose treatment with different doses of tolcapone. Data are presented as means±s.d.

Discussion
Blood sampling can be difficult in parkinsonian patients, particularly those showing severe symptoms of the disease. However, using sparse blood sampling and data evaluation with population pharmacokinetic methods, it was possible to describe the pharmacokinetics of tolcapone in this target population. Samples were obtained from almost all patients participating in the dose-finding trials with tolcapone, and the quality of the data enabled the pharmacokinetics to be evaluated under a wide range of influencing factors in parkinsonian patients.
Our study showed a great consistency in the final models derived for two independent datasets, confirming the robustness of the process as well as the assumption that tolcapone pharmacokinetics are similar in parkinsonian patients with a fluctuating and nonfluctuating response to levodopa. The basic pharmacokinetic model was a two-compartment open model with first-order absorption and potentially a tlag. Such a model had already been used to fit data from a conventional single dose clinical pharmacology study with tolcapone in healthy young volunteers [22], and similar results were obtained (ka: 1.1 h−1; tlag: 0.5 h; CL: 7.1 l h−1, Vc: 4.9 l, Vss: 9.9 l). The consistency between the current analysis (using sparse data and mixed effect modelling with two independent datasets) and the earlier study (based on a data-rich situation applying nonlinear regression method) gives confidence in the modelling process as well as the validity of the results. The datasets differ in a few minor aspects and some fine-tuning was applied to optimize the fit individually for each dataset. For example the finding that a tlag is not always required for the final model is most likely a result of the timing of the blood sampling (i.e. only four samples were obtained between 0.5 and 1 h after drug intake for the nonfluctuators verses 37 samples in the fluctuators during the same interval), which can not always be so well controlled in therapeutic trials.
In general, the pharmacokinetics of tolcapone were not systematically changed during the treatment duration of 6 weeks and any influence of age, sex or the concomitant use of dopamine agonists on tolcapone pharmacokinetics was excluded. The fast absorption of tolcapone described in healthy volunteers was also confirmed in patients and the ka was estimated to be approximately 1–2 h−1. Although from an earlier study we know that food does affect the rate of absorption of tolcapone (Hoffmann-La Roche, data on file), it could not be described using the present approach. This was probably because the blood sampling during the absorption process was too sparse. The effect of food on the bioavailability of tolcapone as detected in healthy volunteers was confirmed in patients. When this drug is taken concomitantly with food there is a decrease of 10–20% in relative bioavailability. Based on the decrease in OF, this effect was statistically significant, but because of the relatively flat dose–response curve of tolcapone it is not considered to be clinically relevant [14]. The current recommendation is that tolcapone can be taken with or without food.
Tolcapone is highly bound to plasma albumin (>99.8%) and its distribution is therefore restricted [25]. In healthy volunteers the volume of distribution at steady state after intravenous dosing was estimated to be 9 l [22]. Our current analysis suggested a wider distribution of tolcapone in parkinsonian patients with a total V of tolcapone of approximately 30 l in both analyses. Although this parameter showed a high variability and could not be estimated with good precision, both independent analyses gave the same result and this was relatively consistent throughout the model development. It is therefore possible that the elderly parkinsonian patients exhibit a higher V for tolcapone than healthy young people. The influence of any covariates on V was not very strong and the findings were inconsistent between the two datasets indicating that the high estimates for V observed in a few patients may have driven the relationships. Based on the high protein binding of tolcapone, we would have expected some influence of serum protein or albumin levels on tolcapone distribution. However, despite a relatively wide range of values contained in our dataset, no relationship was detected. The dose dependency of V observed in the fluctuator dataset could not be confirmed by the nonfluctuating data. This could have been due to only a maximum of two doses of tolcapone (200 and 400 mg) being administered to this patient group. This would be in line with an earlier study in healthy volunteers where a slight nonlinearity in tolcapone pharmacokinetics was observed for doses up to 50 mg, and linear pharmacokinetics above this level [8].
Tolcapone CL could be estimated with great precision and the value obtained, i.e. approximately 4.5–5 l h−1 under the assumption of 60% bioavailability fasted, is close to the 7 l h−1 observed in healthy young volunteers [22]. Even the intersubject variability of tolcapone CL was estimated with good confidence and the value of 30% confirms the modest variability of tolcapone pharmacokinetics even in parkinsonian patients.
A few covariates with potential effect on tolcapone pharmacokinetics were identified, but none of these appeared to have any effect of clinical relevance. LBW had the greatest impact on CL in the fluctuator dataset. For a patient with a LBW of 15 kg below or above the median value of 55 kg (i.e. the majority of patients), the CL was predicted to be 80% and 119% of the TV, respectively. Therefore, an adjustment of tolcapone dose based on LBW does not appear to be justified. CLCr had the greatest impact on CL in nonfluctuators. However, for a patient with a CLCr value of 50 ml min−1, the tolcapone CL would still be 70% of the TV of 4.5 l h−1, which is considered to be acceptable without any dose adjustment. Although the main influencing factor on CL for the two populations was different, i.e. LBW for fluctuators and CLCr for nonfluctuators, both variables are intercorrelated and it is therefore possible that one factor reflects the other. Since tolcapone is not renally cleared an effect of CLCr on tolcapone was not expected [26]. We believe that the effect of LBW is more likely to be a true influence factor on CL and that the relationship with CLCr is artificial because body weight is part of the equation to calculate CLCr. Further analyses are under way to verify this hypothesis. Plasma protein concentrations were identified as minor factors which influence tolcapone CL. However, the variability in CL due to this influencing factor would not be more than ±10% for a range of 64–80 g l−1.
It appears that the pharmacokinetic characteristics derived for tolcapone in parkinsonian patients are in general agreement with the results from conventional pharmacokinetic studies in young and elderly volunteers [8, 9, 22] and that none of the covariates tested had any clinically important effects on the pharmacokinetics of tolcapone. Based on the estimates for CL, the average AUC calculated with the 200 mg dose of tolcapone was approximately 27 μg ml−1 h in patients, which fits well with the estimates in healthy elderly volunteers (24–27 μg ml−1 h) [9]. The estimated t1/2,λz of tolcapone (i.e. 5–8 h after 200 mg) was longer than that observed in healthy volunteers (i.e. approximately 2 h), due to the greater V in parkinsonian patients. However, since exposure to tolcapone was essentially unaffected and dose proportional, no adjustment of the dosing regimen in parkinsonian patients is warranted.
In conclusion, the pharmacokinetics of tolcapone recorded in the current study were in agreement with those obtained in healthy volunteers, even though a higher V was observed in patients with Parkinson's disease. The pharmacokinetics of tolcapone were stable between 2 and 6 weeks of treatment and no subpopulation at risk of either under- or over exposure to tolcapone was identified.
Acknowledgments
We would like to thank all the investigators and study nurses for their support in this study.
References
- 1.Da Prada M, Zürcher G, Napolitano A. Tolcapone (TO) inhibits both peripheral and central catechol-O-methyltransferase (COMT) Neurology. 1995;45:A252–A263. [Google Scholar]
- 2.Zürcher G, Dingemanse J, Da Prada M. Ro 40–7592, a potent inhibitor of extracerebral and brain catechol-O-methyltransferase: preclinical and clinical findings. In: Agnoli A, Campanella G, editors. New Developments in Therapy of Parkinson's Disease. Rome: John Libbey; 1991. pp. 37–43. [Google Scholar]
- 3.Dingemanse J, Jorga K, Zürcher G, et al. Pharmacokinetic–pharmacodynamic interaction between the COMT inhibitor tolcapone and single-dose levodopa. Br J Clin Pharmacol. 1995;40:253–262. doi: 10.1111/j.1365-2125.1995.tb05781.x. [DOI] [PMC free article] [PubMed] [Google Scholar]
- 4.Dingemanse J, Jorga K, Zürcher G, et al. Multiple-dose clinical pharmacology of the catechol-O-methyl-transferase inhibitor tolcapone in elderly subjects. Eur J Clin Pharmacol. 1996;50:47–55. doi: 10.1007/s002280050068. [DOI] [PubMed] [Google Scholar]
- 5.Waters CH, Kurth M, Bailey P, et al. Tolcapone in stable Parkinson's disease: efficacy and safety of long-term treatment. Neurology. 1997;49:665–671. doi: 10.1212/wnl.49.3.665. [DOI] [PubMed] [Google Scholar]
- 6.Rajput AH, Martin W, Saint-Hilaire MH, Dorflinger E, Pedder S. Tolcapone improves motor function in parkinsonian patients with the ‘wearing-off’ phenomenon: a double-blind, placebo-controlled, multicentre trial. Neurology. 1997;49:1066–1071. doi: 10.1212/wnl.49.4.1066. [DOI] [PubMed] [Google Scholar]
- 7.Baas H, Beiske AG, Ghika J, et al. on behalf of the study investigators. Catechol-O-methyltransferase inhibition with tolcapone reduces the ‘wearing off’ phenomenon and levodopa requirements in fluctuating parkinsonian patients. J Neurol Neurosurg Psychiat. 1997;63:421–428. doi: 10.1136/jnnp.63.4.421. [DOI] [PMC free article] [PubMed] [Google Scholar]
- 8.Dingemanse J, Jorga KM, Schmitt M, et al. Integrated pharmacokinetics and pharmacodynamics of the novel catechol-O-methyltransferase inhibitor tolcapone during first administration to humans. Clin Pharmacol Ther. 1995;57:508–517. doi: 10.1016/0009-9236(95)90035-7. [DOI] [PubMed] [Google Scholar]
- 9.Jorga K, Sedek G, Fotteler B, Zürcher G, Nielsen T, Aitken J. Optimizing levodopa pharmacokinetics with multiple tolcapone doses in the elderly. Clin Pharmacol Ther. 1997;62:300–310. doi: 10.1016/S0009-9236(97)90033-3. [DOI] [PubMed] [Google Scholar]
- 10.Sedek G, Jorga K, Schmitt M, Burns RS, Leese P. Effect of tolcapone on plasma levodopa concentrations after coadministration with levodopa/carbidopa to healthy volunteers. Clin Neuropharmacol. 1997;20:531–541. doi: 10.1097/00002826-199712000-00005. [DOI] [PubMed] [Google Scholar]
- 11.Jorga KM. Pharmacokinetics, pharmacodynamics, and tolerability of tolcapone: a review of early studies in volunteers. Neurology. 1998;50:S31–S38. doi: 10.1212/wnl.50.5_suppl_5.s31. [DOI] [PubMed] [Google Scholar]
- 12.Jorga KM. COMT inhibitors: Pharmacokinetic and pharmacodynamic comparisons. Clin Neuropharmacol. 1998;21:S9–S16. [Google Scholar]
- 13.Myllylä VV, Jackson M, Larsen P, Bass H. for the Tolcapone International Parkinson's Disease Study (TIPS) Group I. Efficacy and safety of tolcapone in levodopa-treated Parkinson's disease patients with ‘wearing-off’ phenomenon: a multicentre, double-blind, randomized, placebo-controlled trial. Eur J Neurol. 1997;4:333–341. [Google Scholar]
- 14.Kurth MC, Adler CH, St Hilaire M, et al. Tolcapone improves motor function and reduces levodopa requirement in patients with Parkinson's disease experiencing motor fluctuations: a multicentre, double-blind, randomised, placebo-controlled trial. Neurology. 1997;48:81–87. doi: 10.1212/wnl.48.1.81. [DOI] [PubMed] [Google Scholar]
- 15.Dupont E, Burgunder J-M, Findley LJ, Olsson J-A, Dorflinger E. and the Tolcapone in Parkinson's Disease Study Group II (TIPS II). Tolcapone added to levodopa in stable parkinsonian patients: a double blind placebo-controlled study. Mov Disord. 1997;12:928–934. doi: 10.1002/mds.870120615. [DOI] [PubMed] [Google Scholar]
- 16.Lott RS, Hayton WL. Estimation of creatinine clearance from serum creatinine concentration. Drug Intell Clin Pharm. 1978;12:140–150. [Google Scholar]
- 17.Hallynck TH, Soep HH, Thomis JA, Boelaert J, Daneels R, Dettli L. Should clearance be normalised to body surface or to lean body mass? Br J Clin Pharmacol. 1981;11:523–526. doi: 10.1111/j.1365-2125.1981.tb01163.x. [DOI] [PMC free article] [PubMed] [Google Scholar]
- 18.James WPT. Report of DHSS and the MRC. London: Her Majesty's Stationary Office; 1976. Research in Obesity. [Google Scholar]
- 19.Timm U, Erdin R. Determination of the catechol-O-metyltranferase inhibitor Ro 40–7592 in human plasma by high-performance liquid chromatography with coulometric detection. J Chromatogr. 1992;593:65–68. doi: 10.1016/0021-9673(92)80267-x. [DOI] [PubMed] [Google Scholar]
- 20.Beal SL, Sheiner L. The NONMEM system. Am Statistician. 1980;34:118–119. [Google Scholar]
- 21.Boeckmann AJ, Sheiner LB, Beal SL. User Guide part I to VI, Division of Clinical Pharmacology. San Francisco: University of California; NONMEM. [Google Scholar]
- 22.Jorga KM, Fotteler B, Heizmann P, Zürcher G. Pharmacokinetics and pharmacodynamics after oral and intravenous administration of tolcapone, a novel adjunct to Parkinson's disease therapy. Eur J Clin Pharmacol. 1998;54:443–447. doi: 10.1007/s002280050490. [DOI] [PubMed] [Google Scholar]
- 23.Karlsson MO, Sheiner LB. The importance of modelling inter-occasion variability in population pharmacokinetic analyses. J Pharmacokinet Biopharm. 1993;21:735–750. doi: 10.1007/BF01113502. [DOI] [PubMed] [Google Scholar]
- 24.Mandema JW, Verotta D, Sheiner LB. D’Argenio DZ. Advanced Methods of Pharmacokinetic and Pharmacodynamic Systems Analysis. Vol. 2. New York: Plenum Press; 1995. Building population pharmacokinetic-pharmacodynamic models; pp. 69–86. [Google Scholar]
- 25.Jorga KM, Kroodsma JM, Fotteler B, et al. Effect of liver impairment on the pharmacokinetics of tolcapone and its metabolites. Clin Pharmacol Ther. 1998;63:646–654. doi: 10.1016/S0009-9236(98)90088-1. [DOI] [PubMed] [Google Scholar]
- 26.Jorga KM, Fotteler B, Heizmann P, Gasser R. Metabolism and excretion of tolcapone, a novel inhibitor of catechol-O-methyltransferase. Br J Clin Pharmacol. 1999;48:513–520. doi: 10.1046/j.1365-2125.1999.00036.x. [DOI] [PMC free article] [PubMed] [Google Scholar]


