

Abstract
Aims
Ingestion of grapefruit juice (GFJ) alters the pharmacokinetics of various orally administered drugs. Quantitative evaluation of this GFJ–drug interaction is required for the proper clinical management of patients.
Methods
Using felodipine as a model drug, we constructed a pharmacokinetic model based on irreversible inhibition of intestinal cytochrome P450 3A4 (CYP3A4) by GFJ. We fitted previously publised data [5, 6] for felodipine ER (extended release formulation) to the ratio of CLGI,int before and after grapefruit juice ingestion by nonlinear least-squares regression analysis to estimate the reaction rate constant between GFJ and CYP3A4 (K) and the elimination rate constant of CYP3A4 (k).
Results
The model gave a turnover rate of CYP3A4 of 0.0849 h−1, corresponding to a half-life of 8.16 h, in agreement with reported values. The AUC-time profiles of felodipine ER in the case of different amounts and schedules of GFJ ingestion were simulated using the parameter values estimated from the model.
Conclusions
The modelling leads to the important conclusion that GFJ–felodipine interaction increases with increasing frequency and amount of GFJ ingestion, and that an interval of 2–3 days between GFJ intake and felodipine administration is necessary if GFJ–felodipine interaction is to be avoided.
Keywords: felodipine, grapefruit juice, modelling, pharmacokinetics
Introduction
There have been a number of reports showing that the oral intake of grapefruit juice (GFJ) results in increased plasma concentrations of several clinically used drugs administered orally, including dihydropyridine-type calcium antagonists such as felodipine [1–9], nifedipine [3, 10], nisoldipine [11], nitrendipine [12], and verapamil [13], terfenadine [14], cyclosporin A [15, 16], diazepam [17], midazolam [18], triazolam [19], saquinavir [20], ethinylestradiol [21], caffeine [22] and tacrolimus [23]. In contrast, the ingestion of GFJ does not alter the plasma concentrations of felodipine [7], nifedipine [10], midazolam [18] and cyclosporin A [15] after intravenous drug administration. This finding suggested that GFJ influences drug absorption in the intestine. The above drugs are substrates of cytochrome P450 3A (CYP3A4 and/or 3A5) and either substrates or inhibitors of P-glycoprotein (P-gp) [24]. Therefore, the mechanism of the GFJ–drug interaction is thought to involve inhibition of drug metabolism by CYP3A and and/or inhibition of drug efflux by P-gp [2, 25, 26] in the intestine. The relative contributions of these mechanisms to the increase in the plasma concentration of drugs in the presence of GFJ seem to be determined by the differences in the affinities of the drugs for the two proteins. Since CYP3A4 is a major drug-metabolizing enzyme in human intestine, it appears that some components of GFJ inhibit drug metabolism by intestinal CYP3A4 [2, 27], and dihydroxybergamottin [27], bergamottin [28] and GF-I-1 [29] have been identified as candidate inhibitors. We found that these furanocoumarin derivatives also inhibit P-gp function in Caco-2 cells [30]. However, calcium antagonists of the dihydropyridine type, used as antihypertensive agents, are only weak inhibitors of P-gp [24], and may be poor substrates, so the GFJ–felodipine interaction is likely to be predominantly determined by CYP3A4 inhibition.
Quantitative prediction of the GFJ–drug interaction is important in order to protect patients from possible adverse effects. In this study, we developed a pharmacokinetic model based on the irreversible inhibition of intestinal CYP3A4 by GFJ components, using felodipine as a model drug. The parameter values estimated from the model were used to predict the effect of amount and frequency of GFJ ingestion on the drug clearance.
Methods
Collection of data
For development of the pharmacokinetic model of felodipine–GFJ interaction in this study, we utilized pharmacokinetic data obtained from two clinical trials by Lundahl et al. [5, 6]. In the first, nine healthy male volunteers were given 10 mg felodipine ER orally together with either 200 ml tap water or GFJ at 0, 1, 4, 10 or 24 h before administration of felodipine [5]. In the second, 12 healthy male volunteers received 10 mg felodipine ER after daily intake of either 200 ml of tap water or GFJ for 1 day or 14 days [6].
Development of the model [31–34]
The developed model, based on irreversible inhibition of the drug-metabolizing enzyme CYP3A4 by components of GFJ, is shown in Figure 1.
Figure 1.
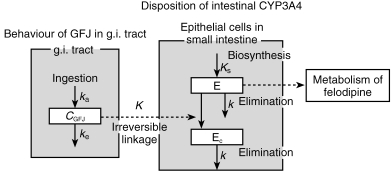
Pharmacokinetic/pharmacodynamic model of grapefruit juice–drug interaction based on irreversible enzyme inhibition. Cgfj; small intestinal GFJ concentration after GFJ ingestion (arbitrary unit: AU), ka: inflow rate constant of GFJ from stomach to small intestine (h−1), ke: outflow rate constant of GFJ from small intestine to colon (h−1), E: active CYP3A4 (mol), Ec: inactive CYP3A4 (mol), K: reaction rate constant of GFJ and CYP3A4 (AU−1·h−1), k: elimination rate constant of CYP3A4 (h−1), Ks: biosynthesis rate constant of CYP3A4 (mol h−1).
First, the intestinal intrinsic clearance (CLGI,int) and hepatic intrinsic clearance (CLH,int) are calculated in the absence of GFJ. It is assumed that felodipine is eliminated in the liver, not in the kidneys.
The CLH,int is determined based on the following equations,
| (a) |
where QH and CLiv are the hepatic blood flow and the total body clearance (CLiv) after intravenous administration, respectively. CLiv is 844.2 ml min−1 (obtained from Lundahl's report [7]). We assumed that the CLGI,int does not contribute to the CLiv after intravenous administration of the drug. Since there is no positive report that felodipine is secreted to the digestive tract and then metabolized after intravenous administration, it is assumed that the CLGI,int does not contribute to the CLiv after intravenous administration of the drug.
The total clearance (CLoral) after oral administration is calculated as follows,
| (b) |
The bioavailability in the liver (Fliver) and the absolute bioavailability (F) of the drug following oral intake are given as follows,
| (c) |
| (d) |
If we assume Fabs = 1, the bioavailability in the intestine (FGI) can be determined by using F and Fliver = 0.339 [7]. This is based on the report that felodipine is almost completely absorbed [2]. FGI = F/Fliver.
On the other hand, FGI can be expressed as follows,
| (e) |
where QGI is 898.3 ml min−1, as calculated from QH:QGI = 1:0.7034 and QH (1277.2 ml min−1) [35–38].
Thus, CLGI,int can be determined by using equations (a) (d) and (e). We can also determine the intestinal intrinsic clearance (CL′GI,int) in the presence of GFJ by the same procedure.
The intestinal intrinsic clearance of felodipine (CL′GI,int) in the presence of GFJ and that in the absence of GFJ (CLGI,int) can be determined as follows.
In the absence of GFJ,
| (f) |
| (g) |
In the presence of GFJ,
| (h) |
| (i) |
where Vmax (μmol min−1) and Et (μmol) are the maximum reaction velocity and the total active CYP3A4 content, respectively, in the absence of GFJ. The V ′max (μmol min−1) and E (μmol) are those in the presence of GFJ. Km (mm) and kp (min−1) are the Michaelis Menten constant of the enzyme reaction and the metabolic rate constant, respectively. We assumed that these two parameters are unaffected in the presence of GFJ, and that only the active CYP3A4 content (E) is changed in the presence of GFJ. This was based on the report that the effect of GFJ on oral felodipine kinetics is mainly selective downregulation of CYP3A4 in the small intestine [2], although Km might be affected.
Thus, the ratio (ε) of the active CYP3A4 contents in the presence and absence of GFJ is given by:
| (j) |
The small intestinal transit time of the solution was obtained by subtraction of gastric emptying time from colon arrival time. So, the concentration-time profile (CGFJ) of orally administered GFJ in the intestinal tract is assumed to follow the one-compartment model.
| (k) |
where ka (h−1) and ke (h−1) are the inflow rate constant of GFJ from stomach to small intestine and the outflow rate constant of GFJ from small intestine to colon, respectively, and t (h) is the time since GFJ ingestion. CGFJ is an arbitrary value.
After oral administration of felodipine, GFJ induces a significant increase of AUC compared with the control. The effect of GFJ on the metabolism of felodipine is mediated mainly through selective downregulation of CYP3A4 in the small intestine, and the intestinal CYP2D6 and CYP1A1 protein content are not affected [2]. We have developed this mathematical model for the purpose of explaining the GFJ–felodipine interaction based on these biochemical findings, and GFJ components are presumed to react specifically with CYP3A4 in intestinal cells, converting active CYP3A4 to inactive CYP3A4 with a rate constant of K(AU−1 h−1). Furthermore, it is assumed that CYP3A4 is synthesized at a constant rate, Ks (mol h−1), and is eliminated with the first-order rate constant, k (h−1). Thus, the total CYP3A4 content, Et (mol) should be given by Ks/k at steady state. The time-dependent changes of the active CYP3A4 content, E (mol), and the inactive CYP3A4 content in the presence of GFJ components, Ec (mol), are given by the following equations;
| (l) |
| (m) |
In these equations, it is assumed that the elimination rate constant of Ec is the same as that of E. In order to validate this assumption, we analysed the experimental data in two ways.
In analysis I, the elimination rate constant of Ec is assumed to be the same as the elimination constant (k) of E.
| (n) |
| (o) |
where ε is the ratio (E/Et) of active enzyme content to total enzyme content, and εc is the ratio (E/Et) of inactive enzyme content to total enzyme content.
In analysis II, the elimination rate constants of E (k) and Ec (k′) are separately estimated as different parameters.
Nonlinear least-squares regression analysis was conducted with the program MULTI (RUNGE) and K and k (and k′) were estimated to be as follows (estimated value ±s.d.);
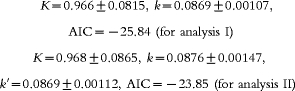 |
where AIC is an information criterion. Analysis I shows a better agreement between prediction and observation than analysis II, and this allowed us to decrease the number of parameters by using a single elimination constant, k.
Data analysis
The pharmacokinetic parameters for gastrointestinal transit of GFJ, such as ka and ke, were estimated by using reported data on the behaviour of orally administered GFJ in stomach and intestine [39]. The ka value was determined as the reciprocal of gastric emptying time (0.30 h), i.e. 3.33 (h−1). The intestinal transit time (4.10 h) was calculated from the difference between the gastric emptying time (0.30 h) and arrival time at the colon (4.40 h). The ke value was determined as the reciprocal of the intestinal transit time, 0.244 (h−1). By using these parameters, the change of CGFJ was simulated according to equation (k). CLGI,int, CL′GI,int and ε were calculated according to equations (a)–(e) by using data obtained after the single oral administration of 10 mg felodipine ER with GFJ or water [4] and data obtained after the single oral administration of 10 mg felodipine ER following daily intake of GFJ or water for 14 days. By using simulated CGFJ time profiles (equation k), ε-time profiles (7 points) were fitted to equations (n) and (o) with the nonlinear least-squares regression analysis program MULTI (RUNGE) [40] and both K and k were estimated. In this analysis, we wished to estimate the time-dependent change of felodipine AUC in the presence of grapefruit juice. But, AUC is the sum of the area under the plasma concentration curve from administration time to infinity. Therefore, we used tmax at the time of Cmax as a measure of the interaction effectiveness with grapefruit juice. For convenience, we took t as tmax+real time, since if t is simply taken as real time, the effect has a large value immediately after grapefruit ingestion, which seems unnatural and difficult to analyse.
By using the parameter values thus obtained and equations (k), (n), (o), we simulated the time-dependent changes of the active CYP3A4 content ratio (ε) and the increase of felodipine AUC was calculated by use of the following equation in the case of various amounts (1, 2, 3, 4, 5 and 6 times the regular intake) and frequencies (1, 2, 3, 4, 5, 6, 7, 8, 9 and 10 times per day) of GFJ ingestion. Simulations were also conducted for drug administration after GFJ ingestion daily for 7 days and three times per day for 7 days.
 |
where R is QGI/CLGI,int.
Results
Effects of drug administration time after ingestion of GFJ and 14 day ingestion of GFJ on metabolic clearance of felodipine
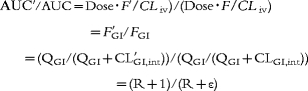
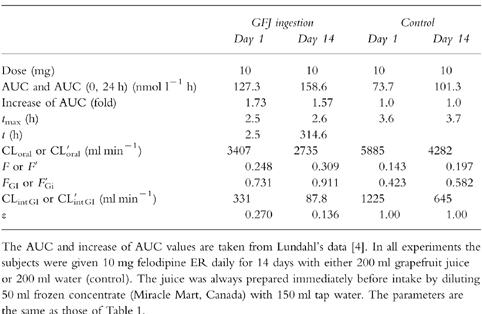
Table 1 and Table 2 show the pharmacokinetic data (AUC, increase ratio of AUC, oral clearance (CLoral = dose/AUC), tmax (h), t (h), CLiv, F, Fiv, FGI, QH, QGI, intestinal intrinsic clearance (CLGI,int) and active enzyme ratio (ε)) that were utilized for analysis in this study. Table 1 shows the pharmacokinetic data of felodipine ER administered at 0, 1, 4, 10, or 24 h after intake of GFJ, while Table 2 shows the effect of ingestion of GFJ for 1 day or 14 days on the pharmacokinetic data of felodipine.
Table 1.
Experimental data for interaction between single ingestion of GFJ and felodipine.
Table 2.
Experimental data for interaction between felodipine and GFJ ingested once a day for 14 days.
Intestinal transition of GFJ
To simulate the intestinal GFJ concentration profile (CGFJ), the inflow rate constant of GFJ from stomach to small intestine, ka (h−1), and the outflow rate constant of GFJ from small intestine to colon, ke (h−1) were used (see equation k). The CGFJ-time curves after single ingestion of GFJ or daily intake of GFJ for 14 days are shown in Figure 2a–I and Figure 2a–II, respectively.
Figure 2.
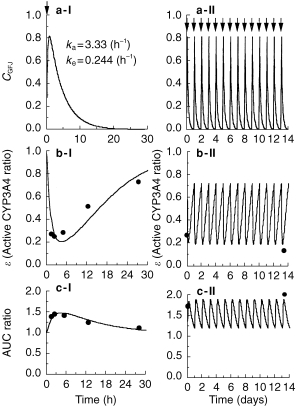
Intestinal GFJ concentration profiles after a single ingestion (Panel a-I) or ingestion once a day for 14 days (Panel a-II). Ratio of active CYP3A4 to total CYP3A4 (ε) after single ingestion (Panel b-I) and ingestion once a day for 14 days (Panel b-II), and increase (fold) of AUC after single ingestion (Panel c-I) and ingestion once a day for 14 days (Panel c-II). In Panel a, for simulation of the intestinal GFJ concentration profile (CGFJ), we used the inflow rate constant of GFJ from stomach to small intestine, ka = 3.33 (h−1), and the outflow rate constant of GFJ from small intestine to colon, ke = 0.244 (h−1) (see equation k in Materials and Methods). Pointing arrows represent time of grapefruit juice ingestion. In panels b and c, circles represent the data reported previously [3, 4] and solid lines represent the fitting curves according to the proposed pharmacokinetic model. In order to estimate K and k, pharmacokinetic data (ε-values-time profiles) of felodipine (Tables 1 and 2) after single or repeated ingestion of GFJ were fitted to equations (n) and (o) by nonlinear least-squares regression analysis. The estimated values of K and k, were 0.966±0.0815 (AU−1h−1) and 0.0869±0.00107 (h−1), respectively.
Estimation of the reaction rate constant (K) between GFJ and CYP3A4 and the elimination rate constant (k) of CYP3A4
Based on the irreversible enzyme inhibition model (Figure 1), pharmacokinetic data (e-values-time profiles) of felodipine (Tables 1 and 2) after single or repeated ingestion of GFJ were fitted to equations (n) and (o) with the nonlinear least-squares regression analysis program in order to estimate K and k. The estimated values of K and k were 0.922±0.0688 (AU−1h−1) and 0.0849±0.00913 (h−1), respectively. The simulation curves and the observed values of active CYP3A4 ratio (ε) and change of felodipine AUC after single or repeated ingestion of GFJ are shown in Figure 2c–I, II and Figure 2d–I, II. Good agreement was found between the observed and predicted values.
Simulation of the metabolic inhibition of CYP3A4 by GFJ
The inhibition-time profiles of felodipine metabolism after ingestion of GFJ in various amounts and at various frequencies were simulated by using the estimated parameters. We also simulated the profiles of the decline and recovery of ε after three ingestions of GFJ in one day, after one ingestion per day for 7 days, and after three ingestions per day for 7 days.
(a) Effect of amount of GFJ ingested (1, 2, 3, 4, 5 and 6 times the regular amount) on time profile of ε and AUC of felodipine
As shown in Figure 4, the ε-value was immediately reduced to 0.2 by a single dose of GFJ, and to 0.1 by double that dose. When the amount of GFJ was increased to 3, 4, 5, 6 times the regular dose, there was little further change of the ε-value. In each case, the ε-value recovered to the control level (1.0) within 2 days (Figure 3a). In a mirror image of the ε-values, the AUC of felodipine increased immediately after GFJ ingestion. The maximum increase of AUC was about 1.7-fold. The AUC values also recovered to the control level within 2 days (Figure 3b).
Figure 4.
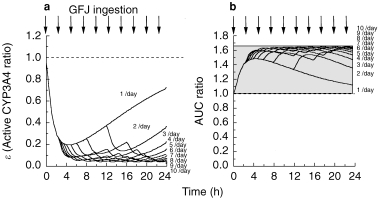
Effect of the frequency of grapefruit juice ingestion per day on simulation curves for the ratio of active CYP3A4 to total CYP3A4 (ε) in intestine (Panel a) and the increase (fold) of felodipine AUC (Panel b). The values of K and k were taken to be 0.966±0.0815 (AU−1h−1) and 0.0869±0.00107 (h−1), respectively.
Figure 3.
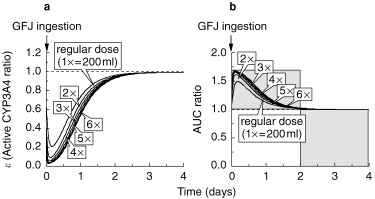
Effect of amount of grapefruit juice ingested at one time on simulation curves for the ratio of active CYP3A4 to total CYP3A4 (ε) in intestine (Panel a) and the increase (fold) of felodipine AUC (Panel b). The values of K and k were taken to be 0.966±0.0815 (AU−1h−1) and 0.0869±0.00107 (h−1), respectively.
(b) Effect of frequency of GFJ ingestion (1, 2, 3, 4, 5, 6, 7, 8, 9 and 10 times per day) on ε and on the AUC of felodipine
As shown in Figure 6, the ε-value immediately fell to 0.2 after one dose of GFJ, and to 0.05 after ingestion of GFJ 10 times in a day (Figure 4a). Correspondingly, the AUC of felodipine was immediately increased 1.5-fold by GFJ ingestion. The maximum increase of the AUC was 1.65-fold after ingestion of GFJ 10 times in a day (Figure 4b).
Figure 6.
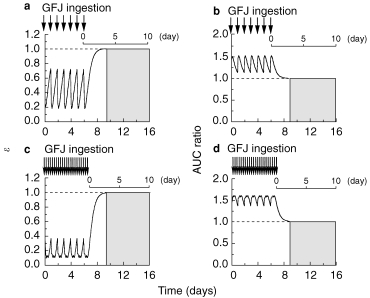
Simulation curves for the ratio of active CYP3A4 to total CYP3A4 (ε) (Panels a, c) and the increase (fold) of felodipine AUC (Panels b, d) after GFJ ingestion once a day for 7 days and three ingestions per day for 7 days, at 07.00 h, 12.00 h and 18.00 h. The values of K and k were taken to be 0.966±0.0815 (AU−1h−1) and 0.0869±0.00107 (h−1), respectively.
(c) Simulation of the time profiles of ε and AUC of felodipine after three ingestions of GFJ in a day
A simulation study of ε and AUC of felodipine after three ingestions of GFJ (at 07.00 h, 12.00 h, 18.00 h) in 1 day was carried out. The ε-value immediately fell to 0.2 after GFJ ingestion at 07.00 h, and to 0.1 after GFJ ingestion at 12.00 h, and remained at 0.1 after the third GFJ ingestion at 18.00 h. Thereafter, it took 2.5 days for ε to recover to the control level (Figure 5a). Furthermore, the AUC of felodipine increased 1.5-fold after the first dose of GFJ and further increased to about 1.6 times the control after the second and third doses. The AUC took 2.5 days to revert to the control level (Figure 5b).
Figure 5.
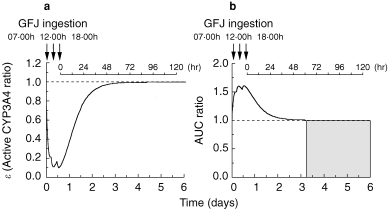
Simulation curves for the ratio of active CYP3A4 to total CYP3A4 (ε) (Panel a) and the increase (fold) of felodipine AUC (Panel b) after three ingestions of grapefruit juice, at 07.00h, 12.00h and 18.00h. The values of K and k were taken to be 0.966±0.0815 (AU−1 h−1) and 0.0869±0.00107 (h−1), respectively.
(d) Simulation of the time profiles of ε and AUC of felodipine after once-daily or three-times-daily ingestions of GFJ for 7 days. The time profiles of ε and AUC of felodipine during once daily or three times daily (at 07.00 h, 12.00 h, 18.00 h) ingestions of GFJ for 7 days were simulated using the developed model. The ε-value varied between 0.2 and 0.7 during a single GFJ ingestion per day for 7 days, and took 3 days to recover to the control value after the last ingestion (Figure 6a). The AUC ratio varied between 1.1 and 1.5, and also took 3 days to recover after the last GFJ ingestion (Figure 6b). In the case of three GFJ ingestions per day for 7 days, the ε-value varied between 0.1 and 0.4 and took 3 days to recover (Figure 6c), while the AUC ratio varied between 1.3 and 1.6, again taking almost 3 days to recover to the control value after the last GFJ ingestion (Figure 6d).
Discussion
Quantitative evaluation of this GFJ–drug interaction is required for the proper clinical management of patients. Therefore, we have constructed a pharmacokinetic model, using felodipine as a model drug. This model (Figure 1) was constructed on the assumption that CYP3A4 is down-regulated irreversibly by components of GFJ. Lown et al. reported that CYP3A4 protein content was decreased by GFJ at the level of Western blotting [2], supporting the idea that the enhanced oral availability of CYP3A4 substrates induced by ingestion of GFJ is based on downregulation of CYP3A4 [2, 25]. We fitted Lundahl's data (Tables 1 and 2) [5, 6] for felodipine to equations (n) and (o) of our model by nonlinear least-squares regression analysis to estimate the reaction rate constant between GFJ and CYP3A4 (K) and the elimination rate constant of CYP3A4 (k) Good agreement was obtained between observed data and values predicted by the model, as shown in Figure 2. As regards agreement of the model predictions with other reported values, several authors have reported more marked effects of GFJ on the AUC of felodipine [1, 3, 4], but all of these studies used felodipine plain tablets. Our model was developed using data obtained with an extended release (ER) formulation, which has a nearly constant release rate over several hours. We used this data set [5, 6], because it is the only one giving information about the results of GFJ administration at various times before drug administration. The results obtained in this study suggest that our model is relevant for the increase of AUC on the ER formulation (1.13-to 3.11-fold; 2, 8, 9) rather than that on the plain tablets (1.86-to 3.34-fold; 1, 3, 4). So, our model may be applicapable only for the ER formulation and be slightly less useful when it includes the plain tablet. In this study, we did not take into consideration the variability of the interaction among subjects. However, it is considered that the variability of the interaction among subjects is one of the important factor as well as the drug formulation on the prediction of the extent of the interaction. More detailed studies considering this important factor will be required to predict the extent of the interaction between felodipine and GFJ. Moreover, the increase in AUC after grapefruit juice was significantly less for an ER formulation than for plain tablets [42]. This may be because of a progressive decline in microsomal CYP3A content from duodenum to jejunum to ileum [43], whereas the absorption rate of felodipine ER is related to erosion of the hydrophilic matrix of the ER tablet, and drug absorption may be lower in the more distal parts of the gastrointestinal tract [44]. It was suggested by the analysis using our model that twice the amount of GFJ would produce a maximum effect on felodipine pharmacokinetics (Figure 3). These results were supported by the previous experimental data by Edgar et al. [1], suggesting the validity of our model. The estimated parameter values were 0.922 (AU−1h−1) for K and 0.0849 (h−1) for k. The half-life time (t1/2) is obtained as 8.16 h, in reasonable agreement with t1/2 of rat CYP3A1 protein (12±3 h) and heme (7±2 h) [43]. The repeated administration of GFJ during the day might be expected to produce a cumulative reduction of CYP3A4 content and activity whereas this would not be the case for GFJ given only once daily. In developing our model, we analysed the elimination rate constant of active CYP3A4 independently of that of inactive CYP3A4, but found that this gave no improvement over the use of a single rate constant. Therefore, in this analysis, we assumed that their elimination rate constants are the same. It is desirable to minimize the number of parameters to be estimated in this study because we have only 7 points as observed data.
We next simulated the inhibition profiles of ε after ingestion of GFJ at various amounts and frequencies by using the estimated parameters. The AUC of felodipine in the case of changing the ingested amount of GFJ (2, 3, 4, 5, 6 times the regular amount) increased by a maximum of 1.7-fold compared with the control, and reverted to the control level within 2 days after the final GFJ ingestion (Figure 3b). Furthermore, the change of AUC ratio of felodipine in the presence of GFJ predicted by this model corresponded well to the change in the ratio of active CYP3A4 content (ε) to total CYP3A4. The change occurred within 4 h after GFJ ingestion. This result is consistent with the finding that reduction of intestinal CYP3A4 content by GFJ occurred within 4 h at the Western blotting level [25]. The AUC of felodipine increased 1.5-fold compared with the control in the case of two ingestions of GFJ per day, and 1.65-fold in the case of 10 ingestions per day (Figure 4b). Next, we simulated the AUC of felodipine after three ingestions in 1 day with meals at 07.00 h, 12.00 h and 18.00 h. The ε-value was reduced to 0.2 immediately after GFJ ingestion at 07.00 h and to 0.1 after GFJ ingestion at 12.00 h, then remained at 0.1 after GFJ ingestion at 18.00 h. After the three ingestions, it took 2.5 days for ε to recover to the control level before GFJ ingestion (Figure 5a). Correspondingly, the AUC of felodipine increased 1.5-fold after GFJ ingestion at 07.00 h, almost 1.6-fold after GFJ ingestion at 12.00 h, and to 1.6-fold after GFJ ingestion at 18.00 h. After the three ingestions, it took 2.5 days for the AUC value to revert to the original level before GFJ ingestion (Figure 5b).
We next conducted a simulation study of ε and AUC of felodipine after one ingestion or three ingestions (at 07.00 h, 12.00 h, 18.00 h) per day for 7 days. The ε-value varied between 0.2 and 0.7 after a single GFJ ingestion per day for 7 days, and it took 3 days for the ε-value to recover to the control value after the last GFJ ingestion (Figure 6a). The AUC ratio varied between 1.1 and 1.5 during GFJ ingestion once per day for 7 days, and it took 3 days to recover after the last GFJ ingestion (Figure 6b). The ε-value varied between 0.1 and 0.4 after GFJ ingestion three times a day for 7 days, and again it took 3 days to recover after the last GFJ ingestion (Figure 6c). The AUC ratio varied between 1.3 and 1.6 after GFJ ingestion three times a day for 7 days, and also took almost 3 days to revert to the control level (Figure 6d). As described, our model also predicts that repeat GFJ administration during the day would produce a greater pharmacokinetic interaction. In the case of the interaction between felodipine and GFJ, it was observed by the administration of GFJ three times a day [2], but was not observed on once daily GFJ administration [6]. So, the effect of repeated GFJ ingestion is different by the experimental designs. While, it was estimated by using our model that the elimination half-life of the effect of the GFJ was 8 h, it may be necessary for making the experimental designs to take into consideration the important points described above to predict the extent of the interaction between felodipine and GFJ.
In this study, we considered only the effect of GFJ on CYP3A4 content in the intestine. It is known that P-gp in the intestine also contributes to the low bioavailability of some drugs, but the contributions of the two mechanisms (CYP3A4 and P-gp) seem to differ from case to case. In the future, it will be necessary to consider quantitatively the effect of P-gp on the absorption of drugs such as cyclosporin and tacrolimus. So far, dihydroxybergamottin [27], bergamottin [28] and GF-I-1 (FC726) [29] have been identified as specific inhibitors of CYP3A4 in GFJ. We also found that these furanocoumarin derivatives inhibit the efflux functions mediated by the efflux transporters such as P-gp in Caco-2 cells [31], but the inhibitory mechanism is unclear now.
In conclusion, we have developed a pharmacokinetic model of the GFJ–felodipine interaction, and used it to simulate the effects of various amounts and frequencies of GFJ ingestion. The interaction increased with increasing amount and frequency of GFJ ingestion, with a maximum increase of 1.6- to 1.8-fold in the AUC of felodipine. The AUC value recovered to the control level within 2 or 3 days after the final GFJ ingestion. Thus, in order to prevent GFJ–felodipine ER interaction, it is necessary withhold GFJ for 2 or 3 days before administration of the drug.
Acknowledgments
This work was supported in part by grants from the Asahi-Beer Foundation, Urakami Foundation, Skylark Foundation and a Grant-in-Aid for Scientific Research from the Ministry of Education, Science and Culture, Japan.
References
- 1.Edgar B, Bailey D, Bergstrand R, Johnsson G, Regardh CG. Acute effects of drinking grapefruit juice on the pharmacokinetics and dynamics of felodipine and its potential clinical relevance. Eur J Clin Pharmacol. 1992;42:313–317. doi: 10.1007/BF00266354. [DOI] [PubMed] [Google Scholar]
- 2.Lown KS, Bailey DG, Fontana RJ, et al. Grapefruit juice increases felodipine oral availability in human by decreasing intestinal CYP3A protein expression. J Clin Invest. 1997;99:2545–2553. doi: 10.1172/JCI119439. [DOI] [PMC free article] [PubMed] [Google Scholar]
- 3.Bailey DG, Spence JD, Munoz C, Arnold JMO. Interaction of citrus juices with felodipine and nifedipine. Lancet. 1991;337:268–269. doi: 10.1016/0140-6736(91)90872-m. [DOI] [PubMed] [Google Scholar]
- 4.Bailey DG, Malcom J, Arnold O, Munoz C, Spence JD. Grapefruit juice–felodipine interaction: mechanism, predictability, and effect of naringin. Clin Pharmacol Ther. 1993;53:637–642. doi: 10.1038/clpt.1993.84. [DOI] [PubMed] [Google Scholar]
- 5.Lundahl JUE, Regardh CG, Edgar B, Johnsson G. Relation between time of intake of grapefruit juice and its effect on pharmacokinetics and pharmacodynamics of felodipine in healthy subjects. Eur J Clin Pharmacol. 1995;49:61–67. doi: 10.1007/BF00192360. [DOI] [PubMed] [Google Scholar]
- 6.Lundahl JUE, Regardh CG, Edgar B, Johnsson G. The interaction effect of grapefruit juice is maximal after the first glass. Eur J Clin Pharmacol. 1998;54:75–81. doi: 10.1007/s002280050424. [DOI] [PubMed] [Google Scholar]
- 7.Lundahl JUE, Regardh CG, Edgar B, Johnsson G. Effects of grapefruit juice ingestion-pharmacokinetics and haemodynamics of intravenously and orally administered felodipine in healthy men. Eur J Clin Pharmacol. 1997;52:139–145. doi: 10.1007/s002280050263. [DOI] [PubMed] [Google Scholar]
- 8.Bailey DG, Arnold JMO, Bend JR, Tran LT, Spence JD. Grapefruit juice–felodipine interaction: reproducibility and characterization with the extended release drug formulation. Br J Clin Pharmacol. 1995;40:135–140. [PMC free article] [PubMed] [Google Scholar]
- 9.Bailey DG, Bend JR, Malcom J, Arnold O, Tran LT, Spence JD. Erythromycin–felodipine interaction: magnesium, mechanism, and comparison with grapefruit juice. Clin Pharmacol Ther. 1996;60:25–33. doi: 10.1016/S0009-9236(96)90163-0. [DOI] [PubMed] [Google Scholar]
- 10.Rashid TJ, Martin U, Clarke H, Waller DG, Renwick AG, George CF. Factors affecting the absolute bioavailability of nifedipine. Br J Clin Pharmacol. 1995;40:51–58. doi: 10.1111/j.1365-2125.1995.tb04534.x. [DOI] [PMC free article] [PubMed] [Google Scholar]
- 11.Bailey DG, Arnold JMO, Strong HA, et al. Grapefruit juice and naringin on nisoldipine pharmacokinetics. Clin Pharmacol Ther. 1993;54:589–594. doi: 10.1038/clpt.1993.195. [DOI] [PubMed] [Google Scholar]
- 12.Soons PA, Vogels BA, Roosemalen MC, et al. Grapefruit juice and cimetidine inhibit stereoselective metabolism of nitrendipine in humans. Clin Pharmacol Ther. 1991;50:394–403. doi: 10.1038/clpt.1991.156. [DOI] [PubMed] [Google Scholar]
- 13.Fhur U, Harder S, Lopez-Rojas P, et al. Increase of verapamil concentrations in steady state by coadministrtion of grapefruit juice. Arch Pharmacol. 1994;349:R134. doi: 10.1007/s00228-002-0436-7. [DOI] [PubMed] [Google Scholar]
- 14.Benton RE, Honig PK, Zamani K, Cantilena LR, Woosley RL. Grapefruit juice alters terfenadine pharmacokinetics, resulting in prolongation of repolarization on the electrocardiogram. Clin Pharmacol Ther. 1996;59:383–388. doi: 10.1016/S0009-9236(96)90105-8. [DOI] [PubMed] [Google Scholar]
- 15.Ducharme MP, Provenzano R, Dehoorne-Smith M, Edwards DJ. Trough concentrations of cyclosporine in blood following administration with grapefruit juice. Br J Clin Pharmacol. 1993;36:457–459. doi: 10.1111/j.1365-2125.1993.tb00395.x. [DOI] [PMC free article] [PubMed] [Google Scholar]
- 16.Ducharme MP, Warbasse LH, Edwards DJ. Disposition of intravenous and oral cyclosporine after administration with grapefruit juice. Clin Pharmacol Ther. 1995;57:485–491. doi: 10.1016/0009-9236(95)90032-2. [DOI] [PubMed] [Google Scholar]
- 17.Ozdemir M, Aktan Y, Boydag BS, Cingi MI, Musmul A. Interaction between grapefruit juice and diazepam in human. Eur J Drug Metab Pharmacokin. 1998;23:55–59. doi: 10.1007/BF03189827. [DOI] [PubMed] [Google Scholar]
- 18.Kupferschmidt HH, Ha HR, Ziegler WH, Meier PJ, Krahenbuhl S. Interaction between grapefruit juice and midazolam in human. Clin Pharmacol Ther. 1995;58:20–28. doi: 10.1016/0009-9236(95)90068-3. [DOI] [PubMed] [Google Scholar]
- 19.Hukkinen SK, Varhe A, Olkkola KT, Neuvonen PJ. Plasma concentrations of triazolam are increased by concomitant ingestion of grapefruit juice. Clin Pharmacol Ther. 1995;58:127–131. doi: 10.1016/0009-9236(95)90188-4. [DOI] [PubMed] [Google Scholar]
- 20.Kupferschmidt HHT, Fattinger KE, Ha HR, Follath F, Krahenbuhl S. Grapefruit juice enhances the bioavailability of the HIV protease inhibitor saquinavir in man. Br J Clin Pharmacol. 1998;45:355–359. doi: 10.1046/j.1365-2125.1998.t01-1-00687.x. [DOI] [PMC free article] [PubMed] [Google Scholar]
- 21.Weber A, Jager R, Borner A, Klinger G, Vollanth R, Matth K. Can grapefruit juice influence ethinylestradiol bioavailability? Contraception. 1996;53:41–47. doi: 10.1016/0010-7824(95)00252-9. [DOI] [PubMed] [Google Scholar]
- 22.Fuhr U, Klittich K, Atab AH. Inhibitory effect of grapefruit juice and its bitter principal, naringenin, on CYP1A2 dependent metabolism of caffeine in man. Br J Clin Pharmacol. 1993;35:431–436. doi: 10.1111/j.1365-2125.1993.tb04162.x. [DOI] [PMC free article] [PubMed] [Google Scholar]
- 23.Westveer MK, Farquhar ML, George P, Mayers JT. Co-administration of grapefruit juice increases tacrolimus levels in liver transplant recipients. Ann Meet Am Soc Transplant Physicians. 1996;202:P115. [Google Scholar]
- 24.Wacher VJ, Wu C-Y, Benet LZ. Overlapping substrate specificities and tissue distribution of cytochrome P450, 3A and P–glycoprotein: implications for drug delivery and activity in cancer chemotherapy. Mol Carcinogenesis. 1995;13:129–134. doi: 10.1002/mc.2940130302. [DOI] [PubMed] [Google Scholar]
- 25.Schmiedlin-Ren P, Edwards DJ, Fitzsimmons ME, et al. Mechanisms of enhanced oral availability of CYP3A4 substrates by grapefruit constituents, decreased enterocyte CYP3A4 concentration and mechanism-based inactivation by furanocoumarins. Drug Metab Dispos. 1997;25:1228–1233. [PubMed] [Google Scholar]
- 26.Takanaga H, Ohnishi A, Matsuo H, Sawada Y. Inhibition of vinblastine efflux mediated by P-glycoprotein by grapefruit juice components in Caco-2 cells. Biol Pharm Bull. 1998;21:1062–1066. doi: 10.1248/bpb.21.1062. [DOI] [PubMed] [Google Scholar]
- 27.Edwards DJ, Bellevue Fh III, Woster PM. Identification of 6′,7′-dihydroxybergamottin, a cytochrome P450 inhibitor, in grapefruit juice. Drug Metab Dispos. 1996;24:1287–1290. [PubMed] [Google Scholar]
- 28.He K, Iyer KR, Hayes RN, Sinz MW, Woolf TF, Hollenberg PF. Inactivation of cytochrome P450 3A4 by bergamottin, a component of grapefruit juice. Chem Res Toxicol. 1998;11:252–259. doi: 10.1021/tx970192k. [DOI] [PubMed] [Google Scholar]
- 29.Fukuda K, Ohta T, Oshima Y, Ohashi N, Yoshikawa M, Yamazoe Y. Specific CYP3A4 inhibitors in grapefruit juice: furocoumarin dimers as components of drug interaction , Pharmacogenetics. 1997;7:391–396. doi: 10.1097/00008571-199710000-00008. [DOI] [PubMed] [Google Scholar]
- 30.Matsuo H, Ohnishi A, Yamada S, et al. Effect of furanocoumarin derivatives in grapefruit juice on the uptake of vinblastin by Caco-2 cells and on the activity of cytochrome P450 3A4. Submitted. [DOI] [PMC free article] [PubMed]
- 31.Katashima M, Iruno T, Shimojo F, et al. Pharmacokinetics and pharmacodynamics of FK143, a nonsteroid 5α-reductase, in healthy volunteers. Clin Pharmacol Ther. 1998;63:354–366. doi: 10.1016/S0009-9236(98)90167-9. [DOI] [PubMed] [Google Scholar]
- 32.Katashima M, Yamamoto K, Gugiuram M, Sawada Y, Iga T. Comparative pharmacokinetic/pharmacodynamic study of proton pump inhibitors, omeprazole and lansoprazole in rats. Drug Metab Dispos. 1995;23:718–723. [PubMed] [Google Scholar]
- 33.Sugiura M, Yamamoto K, Sawada Y, Iga T. Prediction of therapeutic doses based on the pharmacokinetic/pharmacodynamic model of omeprazole, a proton pump inhibitor. Xenobio Metab Dispos. 1992;7:813–820. [Google Scholar]
- 34.Katashima M, Yamamoto K, Tokuma Y, Hata T, Sawada Y, Iga T. Pharmacokinetic and pharmacodynamic study of a new nonsteroidal 5α-reductase inhibitor, 4-[3-[3-[bis (4-isobutylphenyl) methylamino]benzoyl]-1H-indol-1-yl]butyric acid, in rats. J Pharmacol Exp Ther. 1998;284:914–920. [PubMed] [Google Scholar]
- 35.Mapleson WW. An electronic analogue for uptake and exchange of inert gases and other agents. J Appl Physiol. 1963;18:197. doi: 10.1152/jappl.1963.18.1.197. [DOI] [PubMed] [Google Scholar]
- 36.Benowitz N, Forsyth RP, Melmon KL, Rowland M. Lidocaine disposition kinetics in monkey and man I. Prediction by a perfusion model. Clin Pharmacol. 1974;16:887. doi: 10.1002/cpt1974161part187. [DOI] [PubMed] [Google Scholar]
- 37.Spector WS, editor. Handbook of Biological Data. Philadelphia: W.B.Saunders; 1956. pp. 163–283. [Google Scholar]
- 38.Dedrick RL, Zaharko DS, Lutz RJ. Transport binding of methotrexate in vivo. J Pharm Sci. 1973;62:882. doi: 10.1002/jps.2600620603. [DOI] [PubMed] [Google Scholar]
- 39.Christensen FN, Davis SS, Hardy JG, Taylor MJ, Whalley DR, Wilson CG. The use of gamma scintigraphy to follow the gastrointestinal transit of pharmaceutical formulations. J Pharm Pharmacol. 1985;37:91–95. doi: 10.1111/j.2042-7158.1985.tb05013.x. [DOI] [PubMed] [Google Scholar]
- 40.Yamaoka K, Tanigawara Y, Nakagawa T, Uno T. A pharmacokinetic analysis program (MULTI) for microcomputer. J Pharmacobio-Dyn. 1981;4:879–885. doi: 10.1248/bpb1978.4.879. [DOI] [PubMed] [Google Scholar]
- 41.Shiraki H, Guengerich FP. Turnover of membrane proteins: kinetics of induction and degradation of seven form of rat liver microsomal cytochrome P-450, NADPH-cytochrome P-450 reductase, and epoxide hydrolase. Archiv Biochem Biophys. 1984;2325:86–96. doi: 10.1016/0003-9861(84)90257-1. [DOI] [PubMed] [Google Scholar]
- 42.Edgar B, Bailey DG, Bergstrand R, Johnsson G, Lurje L. Formulation dependent interaction between felodipine and grapefruit juice. Clin Pharmacol Ther. 1990;47(suppl.):181. [Google Scholar]
- 43.Paine MF, Khalighi M, Fisher JM, et al. Characterization of interintestinal and intraintestinal variations in human CYP3A-dependent metabolism. Pharmacol Exp Ther. 1997;283:1552–1562. [PubMed] [Google Scholar]
- 44.Abrahamsson B, Alpsten M, Hugosson M, et al. Absorption, gastrointestinal transit, and tablet erosion of felodipine extended-release (ER) tablets. Pharm Res. 1993;10:709–714. doi: 10.1023/a:1018959732744. [DOI] [PubMed] [Google Scholar]