

Abstract
Aims
To examine the pharmacokinetics of ciprofloxacin and fleroxacin in plasma and sputum of patients with an acute exacerbation of chronic bronchitis or bronchiectasis following the first dose and again during the third day of treatment.
Methods
Twelve patients, aged >35 years, with acute infective exacerbation of bronchitis or bronchiectasis were allocated randomly to treatment with either fleroxacin 400 mg daily or ciprofloxacin 500 mg twice daily in an open, parallel group design. Plasma and sputum were collected during the first and third days of treatment. The time course of concentrations in sputum was modelled assuming that it acted as a negligibly small compartment of distribution.
Results
The mean sputum to plasma ratios of both ciprofloxacin and fleroxacin were approximately 1 on both days 1 and 3. Peak concentrations of ciprofloxacin in sputum were achieved 1.6 (95% CI on mean difference 0.8–2.3) and 1.2 (0.4–1.9) h later than in plasma on day 1 and day 3, respectively (mean difference±95% confidence interval). For fleroxacin, the corresponding delay in time to peak concentrations was less marked and not significant. Fleroxacin accumulated in plasma (accumulation index 1.52±0.07) and sputum (accumulation index 1.79±0.39) from day 1 to day 3. Accumulation did not occur for ciprofloxacin because the dose interval (12 h) was considerable longer than its half life (3–4 h).
Conclusions
The sputum to plasma ratio of ciprofloxacin and fleroxacin is approximately 1. The time to peak concentrations of ciprofloxacin in sputum is slightly delayed compared with plasma. Fleroxacin accumulates over time in both plasma and sputum consistent with its longer half-life.
Keywords: ciprofloxacin, fleroxacin, pharmacokinetics, plasma, sputum
Introduction
The quinolones are a chemical class of antimicrobial drugs which act by inhibition of an essential bacterial enzyme DNA gyrase. They have high activity against a broad spectrum of gram-negative and gram-positive bacteria [1–3], and in particular against the respiratory pathogens Haemophilus influenzae and Moraxella catarrhalis. They have intermediate activity against Streptococcus pneumoniae and Mycoplasma pneumoniae [1].
Minimum inhibitory concentrations (MIC) are only one index of the likely clinical efficacy of antibacterials for the treatment of respiratory tract infections. Adequate penetration of antibacterials into the site of infection is also important. Beta-lactam antibiotics, while having superior MICs against Strep. pneumoniae, arguably the most important respiratory pathogen, do not penetrate very well into body tissues and fluids thus decreasing their potential effectiveness. By contrast, ciprofloxacin [4] and fleroxacin [5] penetrate well into most body tissues, with tissue:plasma ratios equal to, or often exceeding 1. The better penetration of the quinolones into body tissues and fluids may compensate for the lower MICs against bacteria such as Strep. pneumoniae in sites such as lung tissue and sputum. If these agents are to be used with confidence in the treatment of respiratory tract infections, it is important to have good data about their penetration into lung tissue and sputum.
Ciprofloxacin is widely used for the treatment of bacterial lower respiratory tract infections. The pharmacokinetics of ciprofloxacin in healthy volunteers include a time to peak concentrations after oral dosage (tmax) of 1–1.5 h, oral availability of 0.5–0.7, protein binding of 0.2–0.3, volume of distribution (V) of 2–3 l kg−1, half-life (t1/2) of 3–4 h and fraction excreted unchanged in the urine of 0.4–0.6 [4]. Fleroxacin is a newer trifluorinated quinolone. The pharmacokinetics of fleroxacin in healthy volunteers include a tmax of 1–1.5 h, an oral availability of 0.98–1, protein binding of 0.2–0.3, V of 1.3–1.8 l kg−1, t1/2 of 10–12 h and a fraction excreted unchanged in the urine of 0.6–0.7 [6].
The purpose of this study was to examine the pharmacokinetics of fleroxacin and ciprofloxacin in both plasma and sputum of patients with acute exacerbations of chronic bronchitis or bronchiectasis after the first dose and again during the third day of treatment.
Methods
Patients
All hospital patients admitted for management of acute exacerbation of chronic bronchitis or bronchiectasis were screened for possible entry to the study. Males and females aged >18 years were eligible for the study, provided they were able and willing to give written informed consent and could take oral medications. Exclusion criteria included pregnant or nursing women, and patients with; known or suspected hypersensitivity reactions to nalidixic acid or other quinolone derivatives, evidence of severe renal impairment (measured or estimated creatinine clearance <30 ml min−1), positive HIV serology, liver function test results more than twice the upper limit of normal, seizures or a seizure tendency, concurrent theophylline medication (because ciprofloxacin inhibits the metabolism of theophylline), or a recent history of receipt of any investigational compound within the previous 2 weeks. The study was approved by the Ethics Committee of the Southern Regional Health Authority (Canterbury) of New Zealand.
Study protocol
The study was a single centre, open, randomised, balanced design. After satisfying entry criteria, subjects were randomised to receive either fleroxacin or ciprofloxacin. In the fleroxacin group, the patients received 400 mg orally (Quinodis, Roche) once each day for 3 or more days. The ciprofloxacin treated patients received 500 mg twice daily orally (Ciproxin, Bayer) for 3 or more days. Both drugs were taken on an empty stomach and with approximately 150 ml water. The doses of fleroxacin and ciprofloxacin were chosen because they were the doses approved in New Zealand for moderately severe respiratory tract infections.
Blood was sampled at the following times on days 1 and 3 for the measurement of drug concentrations in plasma: predose, 0.5, 1, 1.5, 2, 2.5, 3, 3.5, 4, 5, 6, 8, 10 and 12 h. The 12 h sample in the ciprofloxacin group was taken just prior to the next dose. In the fleroxacin group, further samples were taken at 18 h and just prior to the next dose at 24 h. Actual times of sampling were recorded, and used in the analysis.
Sputum was collected for the measurement of drug concentrations at the following times: predose, 0.5, 1, 2, 3, 4, 5, 6, 8, 10, 12 h. Any other samples during the night were also collected in the fleroxacin group, and a 24 h sample taken. Actual times of sampling were recorded and used in the analysis. It was not possible for all patients to produce an adequate volume of sputum at the required frequency, particularly on day 3 when the patient's condition had often improved.
Assays
Blood was collected in disodium edetate tubes. Plasma and sputum samples were stored at −35° C until analysis. Concentrations of ciprofloxacin and fleroxacin in plasma and sputum were determined using modifications of the high performance liquid chromatographic method of Chan et al. [7] using pipemidic acid as an internal standard. Sputum samples were homogenized in phosphate buffer [8] then precipitated with perchloric acid and centrifuged. Peaks were measured using a fluorescence detector with an excitation wavelength of 280 nm and an emission wavelength of 455 nm. Standards were prepared in blank serum and blank mixed sputum. All specimens were assayed in duplicate. The standard curves extracted from plasma and sputum were very similar and consistent from day to day, indicating good stability of the drugs under the conditions of storage of the samples and standards.
Intra-day coefficients of variation of plasma ciprofloxacin ranged from 2.7% to 5.9% and for sputum 3.4% to 11.7%. The corresponding coefficients of variation of the assay of fleroxacin ranged from 5.0% to 11.3% for plasma and 4.3% to 12.4% for sputum. The interday coefficients of variation of ciprofloxacin at 8.0 mg l−1, 4.0 mg l−1 and 0.25 mg l−1 were 3.5%, 4.5% and 8.3% and for fleroxacin 4.9%, 3.1% and 4.0%, respectively. The minimal assayable concentration of both ciprofloxacin and fleroxacin in plasma and sputum was 0.05 mg l−1.
Model independent pharmacokinetic analysis
The areas under the curves, peak concentrations and times to peak concentrations, were determined by model independent methods. The area under the time course of plasma concentrations over a dosage interval, AUC(0,τ), was estimated by the linear trapezoidal method for the absorption phase and the log-linear trapezoidal method for the elimination phase. The area to infinite time, AUC(0,∞) after the first dose, was calculated by adding the quotient Cτ/λz to AUC0–τ where λz is the slope of the terminal phase of the semilogarithmic plot of concentration vs time, and Cτ is the concentration in plasma collected just before the next dose. The AUC(0,τ) value over the dose intervals on day 3 should equal the AUC(0,∞) value after the first dose, if there is no change in the clearance or the fractional absorption of the drugs, and if steady-state is attained. The accumulation index is given by the quotient:
Analogous values of AUC(0,τ) and AUC(0,∞) and accumulation index were calculated for sputum. The mean sputum to plasma ratios were calculated as:
and
The peak concentration (Cmax) and time to peak (tmax) values in plasma and sputum were determined by fitting an empirical quadratic function to the coordinates of the three highest concentrations. The values of Cmax and tmax were estimated from the turning point of the curve [9].
Model dependent pharmacokinetic analysis
The time courses of the concentrations of ciprofloxacin and fleroxacin in plasma were generally fitted using a two compartment model with first order absorption. Accordingly, the plasma concentrations were fitted by a triexponential equation of the general form
| (1) |
where Ci and λi are concentration parameters and apparent rate constants, respectively. The sum of the concentration parameters was set at zero because the drugs were administered orally. Thus, ΣCi =0. The plasma concentrations were fitted to a one compartmental model in one patient given multiple doses of fleroxacin (i.e. one concentration, Ci, was set to zero). The model equations are consistent with previous kinetic analyses of ciprofloxacin and fleroxacin after oral dosage [4, 10].
Sputum was modelled as a peripheral compartment of distribution of the drugs. It was assumed that the drugs enter and are lost from sputum by first order processes and that the amounts of drug in sputum do not significantly affect concentrations in plasma, i.e. sputum is considered as a negligibly small compartment. The time courses of sputum concentration were therefore fitted by the equation [11, 12]:
| (2) |
where Vc and Vs are the volumes of the central and sputum compartments, respectively; kps and ksp are the first order rate constants of transfer from plasma to sputum and loss from sputum, respectively. Loss from sputum is likely to be due to diffusion back to plasma but does not need to be specified in the model as sputum is considered as a negligibly small compartment.
The values of the kinetic parameters were determined by simultaneously fitting the equations to the plasma and sputum concentrations using the MINIM programme [13]. A weighting of 1/C was used. A weighting of 1/C2 was also investigated but often fitted the peak concentrations in plasma poorly. In some cases, the absorption of the drugs was very rapid with only one sample collected over the absorption phase. In these cases, convergence to a best fit function was not attained and a fixed value of ka of 8.3 h−1 was used, corresponding to a half-life of absorption of 5 min, which was considered a reasonable upper limit for the rate constant of absorption.
The complex constant, kps×Vc/Vs, was estimated as a single term since the values of the individual parameters cannot be determined separately. This constant is a proportionality factor, which is small if sputum concentrations are low. By contrast, the rate constant, ksp, determines the comparative patterns of plasma and sputum concentrations. If this rate constant is small, or of the same order as λz, then the concentrations in sputum are more sustained than in plasma and the peak concentration in sputum is achieved at a later time.
The ratio of the AUC values from sputum and plasma should equal the ratio of the rate constants. Thus:
| (3) |
Statistical analyses
The data are recorded as means±s.d. 95% confidence intervals on differences in mean values are also presented. Comparisons were made using the paired t-test where appropriate.
Adverse events
Any adverse event during the trial period was recorded regardless of whether or not it was likely to be related to the treatment.
Results
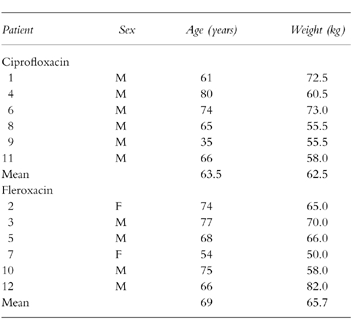
One hundred and eight patients were screened but only 12 met the entry criteria during the time frame of the study. The major reasons for exclusion were inadequate sputum production and/or concurrent theophylline administration. There were no withdrawals after entry to the study. The demographic features are shown in Table 1.
Table 1.
Demographic data.
The only major protocol violation was patient number 4 in the ciprofloxacin group who took an extra ciprofloxacin tablet on day 2. This patient was not excluded from the trial as it was felt that the short half-life of ciprofloxacin would result in a return to virtual steady-state conditions by day 3. Some patients were unable to produce enough sputum on demand to obtain data at all time points, particularly on day 3 of treatment. This prevented analysis of the kinetics of transfer of drug into and out of sputum in one patient from each group on the third day of treatment.
Both ciprofloxacin and fleroxacin were rapidly absorbed, with peak concentrations in plasma usually achieved within 2 h of dosing (Figure 1, Table 2). There was considerable interpatient variation in the peak plasma concentrations of both drugs, particularly on day 3 of treatment when the peak concentrations varied about threefold. Ciprofloxacin was eliminated from both plasma and sputum substantially more quickly than fleroxacin. The mean terminal rate constants of elimination of ciprofloxacin and fleroxacin (day 1) were 0.20 and 0.04 h−1 (Table 2), corresponding to half-lives of around 3 and 15 h, respectively. A feature of the kinetics of both drugs in plasma was the narrow range in the values of the rate constants of elimination λz for both drugs. By contrast, the AUC of plasma concentrations of both drugs showed marked interpatient variation (Table 2).
Figure 1.
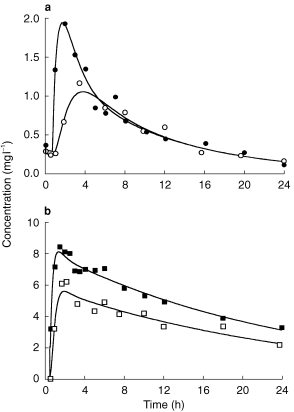
Time courses of concentrations of ciprofloxacin (a) and fleroxacin (b) in plasma (closed symbols) and sputum (open symbols). Data are shown for patient 1 of the ciprofloxacin group on day 3 and patient 2 of the fleroxacin group on day 1. The curves represent the best fit of equations 1 and 2.
Table 2.
Pharmacokinetic parameters of ciprofloxacin and fleroxacin. For each drug, plasma data from all six patients were available on both days. For sputum, data were available for six patients on day 1 and 5 on day 3 for each drug (mean±s.d.).
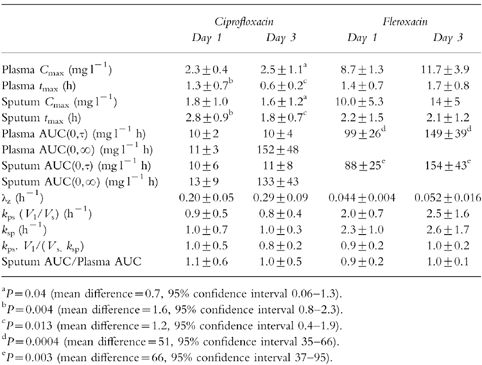
The plasma AUC values of each drug (0,∞ on day 1 and 0,τ on day 3) were very similar indicating that the total absorption and clearance of the drugs did not change with repeated dosage. The AUC values measured over the dose interval did, however, increase with fleroxacin from day 1 to day 3 but not with ciprofloxacin. Fleroxacin was administered every 24 h and the AUC over day 3 was greater than the AUC over the first 24 h (accumulation index 1.52±0.07, P < 0.0004; Table 2) This accumulation is consistent with the longer half life of fleroxacin. Ciprofloxacin was administered at a dosage interval (12 h) which is considerably longer than its half life of elimination (3–4 h) and, consequently, it did not accumulate from day 1 to day 3.
Both fleroxacin and ciprofloxacin achieved concentrations in sputum that were similar to those in plasma. For both drugs, the sputum AUC(0,τ) values on day 3 were not significantly different from the AUC(0,∞) values on day 1 of treatment. However, for fleroxacin, as was seen with the plasma concentrations, the sputum AUC(0,τ) values over day 3 of treatment were higher than the AUC(0,τ) over the first day (accumulation index 1.79±0.31, P = 0.003; Table 2). This again indicates significant accumulation of fleroxacin.
The mean sputum to plasma ratios were not significantly different from 1, on either the first or third days of treatment, whether calculated by the AUC method or from the rate constants of transfer (Figure 2, Table 2). There were, however, substantial interpatient differences in these ratios, particularly for ciprofloxacin, where the AUC ratios varied nearly threefold.
Figure 2.
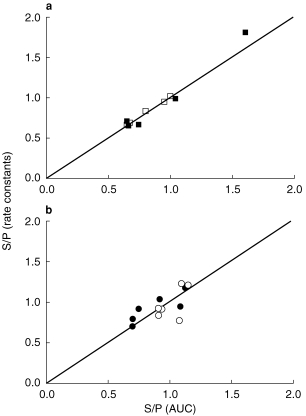
Comparison of sputum to plasma ratios (S/P) calculated by the AUC method (S/P = AUC(plasma)/AUC(plasma)) or the method based on rate constants (S/P = kps.Vc/(Vs.kps)) for ciprofloxacin (a) and fleroxacin (b). The lines of identity are shown. Day 1 (closed symbols), day 3 (open symbols).
The concentrations in sputum increased more slowly than in plasma but declined in parallel with the plasma concentrations (Figure 1, Table 2). The peak concentrations in sputum of ciprofloxacin were 1.6±0.8 and 1.2±0.8 h later than in plasma on day 1 and day 3, respectively. The differences for fleroxacin were less marked, and only approached statistical significance on day 1.
The time courses of both drugs in plasma and sputum were generally fitted well by the model equations (Figure 1). For one patient taking ciprofloxacin, there was a marked delay between the rise in plasma concentrations and the appearance of the drug in sputum, although sputum concentrations increased rapidly after this delay. The sputum data could not therefore be fitted to the theoretical equation. For this patient, the results of the noncompartmental analysis only are reported.
The rate constants of transfer of the drugs into and out of sputum were determined from the fits to the theoretical equations (Table 2). In the patients taking ciprofloxacin, the rate constants of transfer were determined with moderate precision. For example, the coefficients of variation of the kinetic constants were less than 25% in four of the five patients whose sputum data allowed fitting to the model. Because of the often faster loss of fleroxacin from sputum, the precision of the determination of the rate constants of transfer were somewhat poorer. From the data collected after the first dose of fleroxacin, the coefficient of variation of the kinetic constants was less than 25% in only three of the six patients and there was a high correlation (r > 0.95) between the two parameters in all patients. Although the precision of the determination of the rate constants was sometimes low, the ratio of the two rate constants was consistently similar to the ratio of the total AUC values (Table 2, Figure 2), as predicted by equation 3.
Adverse effects
Eleven of the 12 patients experienced adverse events, in most cases more than 1 per patient. A definite relationship between these events to the test drug is difficult to determine because of the confounding effects of the illness being treated and the many other medications taken concurrently. Adverse events ‘possibly’ or ‘probably’ related to ciprofloxacin included headache (3 cases), sore throat (1), heartburn (1), aching joints (1) and swollen ankle (1). Adverse events ‘possibly’ or ‘probably’ related to fleroxacin included headache (1 case), indigestion (2), rash (1), Achilles tendonitis (1), loose bowel motions (1), hot flush (1), and photosensitivity (1).
Discussion
The major finding of the study was that concentrations in sputum of both ciprofloxacin and fleroxacin are very similar to those in plasma, whether this is after a single dose or at steady state, i.e. the sputum:plasma ratio is approximately 1 for both drugs. This conclusion can be made with a high degree of confidence because the ratio is based upon AUC analysis which is considerably more accurate than single time-point estimations of the sputum/plasma ratios. Furthermore, the conclusions from area analysis were confirmed by the method using rate constants. We are not aware of any other studies that have examined the sputum to plasma ratio of either ciprofloxacin or fleroxacin by a full AUC analysis. Our findings, however, are supported by those of Weidekamm & Portmann [5] who found that concentrations of fleroxacin in sputum were similar to those in plasma, based on numerous single time-point analyses covering a wide range of times after dosing.
For ciprofloxacin, the concentration-time profiles in plasma and sputum were not parallel in the first few hours after dosage. This led to the analysis of sputum as a separate compartment of distribution of ciprofloxacin. The tmax in sputum was significantly longer in sputum than in plasma but the difference was not large (1–2 h), and is not likely to be significant clinically. For fleroxacin, sputum behaves as if it is slightly closer to the same (central) pharmacokinetic compartment as plasma.
The accumulation of fleroxacin in both plasma and sputum between day 1 and day 3 may have clinical significance. Weidekamm et al. (1988) [14] determined an accumulation index for fleroxacin of 1.4 based on a half-life of 10.0±1.8 h (s.d.) in 77 healthy volunteers. Our mean accumulation indices of 1.52 over 3 days in plasma and 1.79 in sputum are slightly greater and are consistent with the longer half-life in our patients (16 h). The long half-life of fleroxacin indicates that a loading dose may be useful if maximum concentrations are desired in plasma and tissue early in the time course of therapy. Alternatively, patients such as the elderly who are likely to have longer half-lives, could be started with normal doses but continued at reduced doses.
The concentrations of the fluoroquinolones in bronchial tissue are greater than in both plasma and sputum. For example, there are several reports of higher concentrations of ciprofloxacin in samples of lung tissue taken by biopsy than in serum. The concentration ratios (lung tissue:serum) are very variable but are consistently greater than 1 [15–17]. By contrast, we found that the concentrations in plasma and sputum were similar. Thus, the higher concentrations in biopsied lung tissue may indicate greater tissue binding but not necessarily greater antimicrobial activity in the lung than in serum or plasma.
In conclusion, the sputum to plasma ratio is approximately 1 for both ciprofloxacin and fleroxacin after both single and multiple doses. There is a minor but statistically significant delay in time to peak concentrations of ciprofloxacin in sputum compared with plasma. For both ciprofloxacin and fleroxacin, the pharmacokinetics in sputum and plasma are similar, indicating that the calculations of accumulation and the design of dosage schedules, such as in renal or hepatic disease, can be based upon the kinetics of the drugs in plasma using standard pharmacokinetic approaches.
Acknowledgments
We would like to acknowledge the financial support of Roche NZ Ltd.
References
- 1.Chin NX, Brittain DC, Neu HC. In vitro activity of RO 23–6240 a new fluorinated 4-quinolone. Antimicrob Agents Chemother. 1986;29:675–680. doi: 10.1128/aac.29.4.675. [DOI] [PMC free article] [PubMed] [Google Scholar]
- 2.Paganoni R, Herzog Ch, Braunsteiner A, Hohl P. Fleroxacin: in vitro activity worldwide against 20, 807 clinical isolates and comparison to ciprofloxacin and norfloxacin. J Antimicrob Chemother. 1988;22(Suppl D):3–17. doi: 10.1093/jac/22.supplement_d.3. [DOI] [PubMed] [Google Scholar]
- 3.Georgopoulos A, Breyer S, Georgopoulos M, Mailer H, Graninger W. In vitro activity of fleroxacin. J Antimicrob Chemother. 1988;22(Suppl D):25–29. doi: 10.1093/jac/22.supplement_d.25. [DOI] [PubMed] [Google Scholar]
- 4.Vance-Bryan K, Guay DRP, Rotschafer JC. Clinical pharmacokinetics of ciprofloxacin. Clin Pharmacokinet. 1990;19:434–461. doi: 10.2165/00003088-199019060-00003. [DOI] [PubMed] [Google Scholar]
- 5.Weidekamm E, Portmann R. Penetration of fleroxacin into body tissues and fluids. Am J Med. 1993;94(Suppl 3A):75S–80S. [PubMed] [Google Scholar]
- 6.Stuck AE, Kim DK, Frey FJ. Fleroxacin clinical pharmacokinetics. Clin Pharmacokinet. 1992;22:116–131. doi: 10.2165/00003088-199222020-00003. [DOI] [PubMed] [Google Scholar]
- 7.Chan CY, Lam AW, French GL. Rapid HPLC assay of fluoroquinolones in clinical specimens. J Antimicrob Chemother. 1989;23:597–604. doi: 10.1093/jac/23.4.597. [DOI] [PubMed] [Google Scholar]
- 8.Myers CM, Blumer JL. High performance liquid chromatography of ciprofloxacin and its metabolites in serum, urine and sputum. J Chromatogr. 1987;422:153–164. doi: 10.1016/0378-4347(87)80448-6. [DOI] [PubMed] [Google Scholar]
- 9.Heinzel G, Woloszczak R, Thomann P. Topfit 2 0 Pharmacokinetic and Pharmacodynamic Data Analysis System for the PC. New York: Gustav Fischer-Verlag; 1993. [Google Scholar]
- 10.Panneton A-C, Bergeron MG, LeBel M. Pharmacokinetics and tissue penetration of fleroxacin after single and multiple 400- and 800-mg-dosage regimens. Antimicrob Agents Chemother. 1988;32:1515–1520. doi: 10.1128/aac.32.10.1515. [DOI] [PMC free article] [PubMed] [Google Scholar]
- 11.Coburn WA. Simultaneous pharmacokinetic and pharmacodynamic modelling. J Pharmacokinet Biopharmaceut. 1981;9:367–388. doi: 10.1007/BF01059272. [DOI] [PubMed] [Google Scholar]
- 12.Noe DA, Kumor KM. Drug kinetics in low flux (small) anatomic compartments. J Pharm Sci. 1983;72:718–719. doi: 10.1002/jps.2600720637. [DOI] [PubMed] [Google Scholar]
- 13.Purves RD. Anomalous parameter estimates in the one-compartment model with first-order absorption. J Pharm Pharmacol. 1993;45:934–936. doi: 10.1111/j.2042-7158.1993.tb05628.x. [DOI] [PubMed] [Google Scholar]
- 14.Weidekamm E, Portmann R, Partos C, Bell D. Single and multiple dose pharmacokinetics of fleroxacin. J Antimicrob Chemother. 1988;22(Suppl D):145–154. doi: 10.1093/jac/22.supplement_d.145. [DOI] [PubMed] [Google Scholar]
- 15.Baldwin DR, Wise R, Andrews JM, Gill M, Honeybourne D. Comparative bronchoalveolar concentrations of ciprofloxacin and lomefloxacin following oral administration. Respir Med. 1993;87:595–601. doi: 10.1016/s0954-6111(05)80262-8. [DOI] [PubMed] [Google Scholar]
- 16.Reid TMS, Gould IM, Golder D, et al. Brief report: Respiratory tract penetration of ciprofloxacin. Am J Med. 1989;87(Suppl 5A):60S–61S. doi: 10.1016/0002-9343(89)90024-7. [DOI] [PubMed] [Google Scholar]
- 17.Schlenkoff D, Dalhoff A, Knopf J, Opferkuch W. Penetration of ciprofloxacin into human lung tissue following intravenous injection. Infection. 1986;14:299–300. doi: 10.1007/BF01643967. [DOI] [PubMed] [Google Scholar]