

Abstract
Aims
The pharmacokinetics of orally administered bambuterol were investigated in healthy adult subjects, with particular regard to time to steady state, pharmacokinetic linearity, intraindividual variability for the parent drug and its active β2-adrenergic metabolite terbutaline and bioequivalence between tablet and solution.
Methods
Twenty-six healthy Caucasian subjects were included and 23 (12 women) completed this open, randomised, crossover study. Racemic bambuterol hydrochloride was administered orally as 10 mg, 20 mg, and 10 + 20 mg tablets, and as a solution once daily for 2 weeks at about 19.00 h. Plasma concentrations and urinary recoveries of bambuterol and terbutaline were measured after single doses and during repeated treatments.
Results
Absorption of bambuterol was biphasic. The initial rate could not be assessed directly, but it was faster than that during the second phase where absorption was rate-limiting for elimination (mean terminal half-life: 16 h). Steady-state AUC(0,24 h) of bambuterol, reached within 1 week, was not dose-linear. Mean terminal half-life of terbutaline was 22 h and steady-state was reached within one week of bambuterol treatment. Contrary to bambuterol, overall pharmacokinetics of terbutaline indicated dose-linearity. Day-to-day intraindividual variation in AUC(0,24 h) of terbutaline, 15% with the tablet, was half that of bambuterol. Urine data indicated that intraindividual variability was slightly smaller with the solution. Tablets were bioequivalent with the solution with regard to terbutaline (90% confidence interval: 87–100%).
Conclusions
With oral bambuterol steady state was reached within 1 week. Regarding generated terbutaline, pharmacokinetics judged to be were linear, intraindividual variability of AUC at steady state was on average 15% with the tablet, and tablets were bioequivalent with the solution.
Keywords: bambuterol, bioequivalence, human, pharmacokinetics, terbutaline
Introduction
Bambuterol is the bisdimethylcarbamate of the β2-adrenoceptor agonist terbutaline. Bambuterol, which is inactive at adrenergic receptors, is converted to terbutaline via oxidation and hydrolysis [1, 2].
The basal pharmacokinetics of bambuterol and generated terbutaline in healthy adults have been investigated by Nyberg et al. [3]. Total clearance of bambuterol administered intravenously was 1.25 l min−1, 10% of which was of renal origin. The terminal half-life of bambuterol was 2.6 h after intravenous administration. The initial rate of elimination after oral administration was similar to that after intravenous administration, but the terminal decline was slower and absorption rate limited (flip-flop behaviour). Terbutaline was generated slowly after administration of bambuterol. These observations explain why the plasma profile of terbutaline after oral bambuterol administration shows little fluctuation within dosing intervals. The bioavailability of bambuterol and terbutaline generated from bambuterol is about the same: 10% of the administered bambuterol dose.
The objective of the present study was to investigate the pharmacokinetics after single and repeated oral dosing of bambuterol (as racemic bambuterol hydrochloride, hereinafter referred to as bambuterol) using the final and registered compositions of tablets and solution (Bambec®, AstraZeneca Pharmaceutical Productions, Södertälje, Sweden) in therapeutically recommended doses −10 mg and 20 mg once daily – plus a supratherapeutic tablet dose −30 mg – in a group of healthy Caucasian adults. Bioequivalence between tablet and solution formulations was assessed.
Methods
Subjects and procedures
The study was approved by the local Ethics Committee of Lund/Malmö University Hospital and performed in accordance with the Declaration of Helsinki. Subjects gave written informed consent before entry after full verbal and written information. Twenty-six healthy Caucasian subjects were included and 23 subjects (12 women) completed all treatments. Mean (n = 26) age was 28.9 (range 20–56) years and mean weight was 66.8 (46–81) kg. Hydrolytic capacity, estimated at an average of 14.9 (10.4–24.4) nmol butyrylthiocholine min−1 5 µl−1 blood by use of a modification of a published method [4], and creatinine clearance, on average 121.6 (59–180) ml min−1, were similar to values previously obtained in healthy adults [3].
The women were allowed to use contraceptive pills. Other medicines, occasionally taken during the study, did not disqualify the subject from further participation or evaluation. Bambuterol tablets 10, 20, 30 (10 + 20) mg, and bambuterol solution 20 mg were administered in an open, crossover, and randomised fashion. Fifteen doses were administered during each treatment; there was at least an 8 day wash-out period between dose 1 and dose 2 and a 14 day wash-out between treatments. Study drugs were given orally once daily at about 19.00 h after an individually standardized supper. Subjects abstained from food and beverages for at least 2 h postdosing.
Venous blood (10 ml) was drawn via an indwelling catheter hourly up to 4 h, then less frequently up to 24 h after dose 1 and dose 15 of all treatments, and after dose 8 of bambuterol tablet 20 mg. Blood was collected into sodium-heparinized Venoject® sampling tubes into which 100 µl of a 1 mm solution of an esterase inhibitor (D2456, a bambuterol analogue [5]) had been added. The tubes were immediately centrifuged and the plasma was stored at −20°C.
Urine was collected in consecutive pools up to 96 h after dose 1 (0–24 h plus 6 × 12 h) and up to 120 h after dose 15 of all treatments (0–24 h plus 8 × 12 h). Furthermore, urine was collected in 24 h periods after dose 8 through dose 14 of bambuterol tablet and solution 20 mg. Aliquots were frozen and stored at −20 °C. Deviations up to ±30 min from scheduled time were considered acceptable for 24 h collection periods. The consequences of larger deviations were evaluated and adjustments made, if necessary, before using the data in evaluation of intraindividual variability.
Clinical laboratory assessments and drug analysis
Standard clinical laboratory values were checked before entry, after the last treatment, and once during the study, because subjects were involved in the study for several months. Typical symptoms associated with β2-adrenoceptor agonists – tremor, restlessness, headache, palpitations, and muscle cramps – were scored.
Bambuterol was analysed using gas chromatography plus mass spectrometry [5]. At the limits of quantification (LOQ), 1 nmol l−1 in plasma and 8 nmol l−1 in urine, the within-day coefficient of variation (CV) was about 4% and 5%, respectively.
Terbutaline was analysed by use of coupled-column high performance liquid chromatography with electrochemical detection according to a modification of a previously described method [6]. At 8 nmol l−1 in plasma, the CV was 2.1% within a day and 3.6% between days. The applied LOQ was 4 nmol l−1. The same method was used for terbutaline in urine. The assay calibration curve was then extended up to 5000 nmol l−1 to allow for measurement of the higher concentrations in urine. At 80 nmol l−1 (the LOQ) the within-day variation was 3.7% in the urine analysis.
Symbols and calculations
- T10, T20, T30
Bambuterol tablets 10, 20, 10 + 20 mg, respectively
- S20
Bambuterol solution 20 mg
- LOQ
Limit of quantification
- C
Concentration
- t
Time
- Cmax, Cmin
Observed maximum and minimum plasma concentrations, respectively
- tmax
The time when Cmax was observed
- AUC
Area under the curve of the plasma concentration vs time, calculated using the trapezoidal rule up to 24 h. Extrapolation to infinity (∞) after dose 1 was done assuming monoexponential decline after the last measurable concentration according to the estimated terminal half life.
- MRT
-
Mean residence time: Single dose: AUMC(0,∞)/AUC(0,∞); AUMC, area under the first moment curve of the plasma concentration vs time, and AUC were calculated using the trapezoidal rule up to 24 h. Extrapolation to infinity was done as described above both for AUC and for AUMC.
Repeated dosing: [AUMC(0,24 h) + 24 h × AUC(24 h,∞]/AUC(0,24 h).
- Ae
Amount excreted in urine during a collection period
- CLR
Renal clearance, Ae during a defined period of time divided by the corresponding AUC
- t½,z
Terminal half-life, ln2 divided by the elimination rate constant, which was calculated from urinary excretion data {ln (dAe/dt) regressed on midpoint of collection period}
Missing concentrations and concentrations <LOQ were estimated as judged appropriate in relation to measured concentrations.
Statistical analysis
Arithmetic means were used to describe data graphically and in Tables 1 - 3.
Table 1.
Pharmacokinetic parameters of bambuterol.
| Data after dose 1 | Data during treatment | ||||||||||
|---|---|---|---|---|---|---|---|---|---|---|---|
| Parameter | Treatment | n | Mean | Min | Max | Dose 8 | Dose 15 | n | Mean | Min | Max |
| Cmax (nmol l−1) | T10 | 20 | 3.69 | 1.0 | 8.8 | 23 | 4.35 | 1.7 | 11.1 | ||
| T20 | 23 | 8.56 | 3.5 | 16.9 | X | X | 23 | 10.11 | 3.8 | 21.4 | |
| T20 | – | – | – | – | X | 24 | 10.30 | 2.6 | 30.2 | ||
| S20 | 24 | 6.13 | 1.7 | 13.6 | X | 25 | 7.51 | 2.5 | 14.9 | ||
| T30 | 22 | 14.23 | 5.3 | 30.4 | X | 23 | 16.75 | 7.4 | 46.1 | ||
| AUC1 (nmol l−1 h) | T10 | 15 | 37.3 | 16 | 62 | X | 19 | 20.1 | 5 | 39 | |
| T20 | 22 | 66.8 | 34 | 161 | X | 24 | 60.3 | 19 | 136 | ||
| T20 | – | – | – | – | X | 24 | 55.3 | 15 | 143 | ||
| S20 | 21 | 55.5 | 23 | 93 | X | 25 | 56.6 | 12 | 112 | ||
| T30 | 20 | 108.6 | 42 | 160 | X | 23 | 123.7 | 42 | 376 | ||
| MRT (h) | T10 | 15 | 21.1 | 8 | 34 | X | 19 | 8.0 | 2 | 29 | |
| T20 | 22 | 19.2 | 8 | 34 | X | 22 | 16.4 | 3 | 56 | ||
| T20 | – | – | – | – | X | 24 | 14.4 | 3 | 28 | ||
| S20 | 21 | 19.2 | 8 | 29 | X | 24 | 14.8 | 2 | 34 | ||
| T30 | 20 | 18.3 | 6 | 31 | X | 22 | 15.2 | 4 | 31 | ||
| t½,z (h) | T10 | 6 | 20.14 | 15.2 | 26.7 | X | 10 | 20.90 | 10.5 | 50.7 | |
| T20 | 12 | 18.47 | 8.6 | 32.8 | X | 18 | 16.52 | 7.3 | 40.7 | ||
| S20 | 15 | 18.82 | 6.6 | 27.4 | X | 19 | 13.31 | 6.8 | 20.1 | ||
| T30 | 16 | 16.85 | 7.0 | 32.6 | X | 20 | 15.04 | 7.0 | 33.8 | ||
AUC(0,∞) after dose 1 and AUC(0,24 h) after doses 8 and 15. X shows the dosing interval from which data are given during repeated treatment.
Table 3.
Statistical analysis, mean ratios of dose-normalized AUC and urinary recovery, and intraindividual coefficients of variation, 95% or 90% (bioequivalence test) confidence limits. Bold text indicates statistical significance.
| Bambuterol | Terbutaline | ||||
|---|---|---|---|---|---|
| Issue | Specification | AUC | Ae | AUC | Ae |
| Time to steady state | T20: dose 15 vs 8 | – | – | 0.94 (0.87; 1.02) | 0.99 (0.85; 1.14) |
| S20: dose 15 vs 8 | – | – | – | 1.02 (0.89; 1.18) | |
| Dose proportionality, | T20 vs T10 | 1.52 (1.26; 1.84) | 1.17 (1.03; 1.33) | 0.87 (0.80; 0.95) | 0.95 (0.84; 1.06) |
| Pharmacokinetic linearity | T30 vs T20 | 1.43 (1.20; 1.71) | 1.33 (1.16; 1.51) | 1.06 (0.97; 1.15) | 1.12 (1.00; 1.26) |
| T30 vs T10 | 2.17 (1.80; 2.63) | 1.55 (1.37; 1.76) | 0.93 (0.85; 1.01) | 1.06 (0.95; 1.19) | |
| Intraindividual variability (%) | T20 | 34 (26; 48) | 36 (32; 41) | 15 (11; 21) | 27 (24; 30) |
| S20 | – | 26 (23; 29) | – | 18 (16; 20) | |
| Bioequivalence | T20 vs S20 | – | – | 0.93 (0.87; 1.00) | 0.90 (0.86; 0.94) |
| T20 vs S201 | – | – | 0.94 (0.88; 1.01) | ||
Dose-normalized ratio.
Pharmacokinetic parameters were calculated nonpara-metrically, and treatments were statistically compared and described using multiplicative or additive anova models usually with the factors subject, period, treatment, and dose number. The combined effect of treatment and dose number for CLR and possible interaction between treatment and dose number were addressed in the analysis of time to steady state. Data from the subjects completing at least two treatments (n = 24) were used.
It was assumed that bambuterol had reached steady state after dose 8 and terbutaline after dose 15. Time to steady state for terbutaline was then investigated by comparing AUC(0,24 h) after dose 15 and dose 8 of T20 and Ae(0,24 h) after dose 15 and doses 8–14 of T20 and S20.
Dose proportionality was addressed by use of AUC/ dose and Ae/dose.
Variability in steady-state pharmacokinetics was estimated by assessing intraindividual variability in Ae(0,24 h) after doses 8–15 of T20 and S20, and AUC(0,24 h) after dose 8 and dose 15 of T20. (The assumption of this analysis was that steady state was reached at dose 8).
Bioequivalence of generated terbutaline between tablet and solution was evaluated by use of the ratio of AUC(0,24 h) and the ratio of Ae(0,24 h) after dose 15 of T20 and S20. The criterion for bioequivalence was a 90% confidence interval contained within 80–125%. The bioequivalence test was performed both on nominal (no dose correction) and actual doses (dose normalization).
The observed single-dose Ae(0,24 h) of bambuterol was compared with a prediction, Ae(0,24 h)pred, based on the excretion after dose 1 up to 96 h and terminal half-life (equation 1).
 |
(1) |
This calculation depends on the assumption that there is only one half-life and renal elimination of bambuterol after 96 h is negligible). The mean ratio between observation and prediction was estimated. Were there an initial more rapid phase of bambuterol absorption, observed Ae(0,24 h) would be larger than the prediction based on t½,z.
The relationship between dosing interval AUCs in steady state of terbutaline and bambuterol (systemic capacity to generate and eliminate terbutaline in relation to systemic exposure to administered bambuterol) was described with a potency function (equation 2).
| (2) |
A linear mixed effect model analysis was performed using log transformed data. The parameters A and ln B were assumed to be normally distributed random variables within the group of investigated subjects. The observational error of terbutaline AUCs was assumed to be log-normally distributed, whereas no assumptions were made regarding bambuterol AUCs.
Results
For reasons not attributable to the medication, three of initially 24 subjects discontinued, two men after one treatment and one man after two treatments. The first two subjects were replaced by two men who completed all treatments.
Pharmacokinetics of bambuterol (Tables 1 and 3)
Mean bambuterol tmax values for the four administrations ranged from 1.4–1.8h (individual tmax≤6h). The concentration rapidly decreased for a few hours after the peak and then declined slowly (Figures 1 and 2). For concentrations at 6–24 h (depending on dose), estimates often had to be used, several values being below LOQ. Peak plasma concentration and AUC(0,24 h) were similar after dose 8 and dose 15 of T20. Steady-state AUC of bambuterol was not linearly correlated to dose (Figure 3). Single dose AUC(0,∞) tended to be larger than steady-state AUC(0,24 h) after T10.
Figure 1.

Mean plasma concentrations of bambuterol (upperpanels) and terbutaline (lower panels) after T10 and T30. The right panels show log-transformed mean values. Dashed lines are con-centrations after single doses and continuous lines are concentrations after dose 15.
Figure 2.

Mean plasma concentrations of bambuterol (upperpanels) and terbutaline (lower panels) after S20 and T20. The right panels show log-transformed mean values. Dashed lines are con-centrations after single doses and continuous lines are concentrations after dose 15 of S20 and T20 plus dose 8 of T20.
Figure 3.
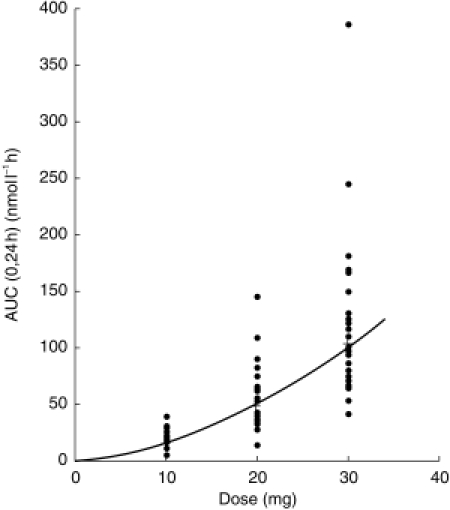
Individual (•) and mean (+) AUC(0,24 h) of bambuterol after dose 15 of bambuterol tablets 10, 20, and 30 mg.
CLR of bambuterol, determined over the dosing interval, was dose-dependent during repeated treatment (less reliable estimates were obtained after single dose), the mean ranging from 214 ml min−1 after T10–143 ml min−1 after T30. The observed Ae(0,24 h) was 124 (95% confidence interval: 118–131)% of the prediction (equation 1). t½,z, on average 13–21 h (overall mean 16 h), was similar after dose 1 and dose 15. t½,z did not differ between doses, an indication that CLR must have been fairly stable at the very low plasma concentrations during the terminal phase. The intraindividual coefficient of variation in AUC(0,24 h) after T20 was similar to that of Ae(0,24 h), which in turn was more pronounced than after S20.
Pharmacokinetics of terbutaline (Tables 2,3)
Table 2.
Pharmacokinetic parameters of terbutaline generated from bambuterol.
| Data after dose 1 | Data during treatment | ||||||||||
|---|---|---|---|---|---|---|---|---|---|---|---|
| Parameter | Treatment | n | Mean | Min | Max | Dose 8 | Dose 15 | n | Mean | Min | Max |
| Cmax (nmol l−1) | T10 | 21 | 7.10 | 4.5 | 9.8 | X | 24 | 12.20 | 5.9 | 16.7 | |
| T20 | 23 | 12.17 | 6.9 | 18.1 | X | 24 | 21.45 | 11.7 | 34.1 | ||
| T20 | – | – | – | – | X | 24 | 20.40 | 7.0 | 32.2 | ||
| S20 | 25 | 10.30 | 5.9 | 15.0 | X | 24 | 20.55 | 12.3 | 30.1 | ||
| T30 | 23 | 16.32 | 9.8 | 28.2 | X | 23 | 31.36 | 16.0 | 62.8 | ||
| Cmin (nmol l−1) | T10 | – | – | – | – | X | 24 | 5.19 | 0 2 | 8.3 | |
| Cmin (nmol l−1) | T20 | – | – | – | – | X | 24 | 10.59 | 2.0 | 17.7 | |
| T20 | – | – | – | – | X | 24 | 10.05 | 3.0 | 18.9 | ||
| S20 | – | – | – | – | X | 25 | 10.85 | 4.9 | 17.1 | ||
| T30 | – | – | – | – | X | 23 | 16.68 | 5.5 | 27.0 | ||
| AUC1 (nmol l−1 h) | T10 | 21 | 208.1 | 157 | 263 | X | 24 | 196.0 | 58 | 270 | |
| T20 | 24 | 387.6 | 182 | 608 | X | 24 | 368.3 | 160 | 541 | ||
| T20 | X | 24 | 350.9 | 157 | 543 | ||||||
| S20 | 25 | 349.4 | 162 | 532 | X | 24 | 366.7 | 203 | 554 | ||
| T30 | 23 | 556.9 | 291 | 883 | X | 23 | 550.0 | 252 | 801 | ||
| MRT (h) | T10 | 21 | 33.8 | 24 | 55 | X | 24 | 30.3 | 7 | 55 | |
| T20 | 24 | 33.7 | 23 | 57 | X | 24 | 33.9 | 16 | 54 | ||
| T20 | – | – | – | – | X | 24 | 34.4 | 20 | 57 | ||
| S20 | 25 | 33.7 | 22 | 55 | X | 24 | 34.0 | 22 | 54 | ||
| T30 | 23 | 34.7 | 24 | 60 | X | 23 | 35.0 | 22 | 57 | ||
| t½,z (h) | T10 | 17 | 26.50 | 12.5 | 49.5 | X | 22 | 22.25 | 13.5 | 47.4 | |
| T20 | 22 | 22.46 | 14.8 | 36.5 | X | 23 | 22.81 | 14.4 | 41.7 | ||
| S20 | 23 | 23.60 | 12.2 | 54.1 | X | 24 | 19.99 | 13.9 | 32.3 | ||
| T30 | 23 | 22.10 | 12.4 | 40.2 | X | 23 | 22.64 | 14.3 | 47.6 | ||
| CLR (ml min−1) | T10 | 21 | 108.2 | 58 | 144 | X | 24 | 111.1 | 72 | 216 | |
| T20 | 24 | 111.6 | 87 | 155 | X | 24 | 103.9 | 72 | 140 | ||
| T20 | – | – | – | – | X | 24 | 109.3 | 68 | 143 | ||
| S20 | 25 | 112.6 | 66 | 165 | X | 24 | 112.1 | 82 | 154 | ||
| T30 | 23 | 112.3 | 82 | 157 | X | 23 | 108.8 | 84 | 140 | ||
AUC(0,∞) after dose 1 and AUC(0,24 h) after doses 8 and 15.
Mean terbutaline tmax values for the four administrations ranged from 2.9–5.4h (individual tmax usually <12 h). The plasma concentration slowly decreased after tmax (Figures 1 and 2). The minimum concentration during repeated dosing was about half of the maximum. Peak plasma concentration was similar and AUC(0,24 h) did not statistically differ significantly between dose 8 and dose 15 of T20. T20 was bioequivalent with S20, the geometric mean AUC(0,24 h) of T20 compared with S20 with respect to generated terbutaline being 93% (90% confidence interval: 87–100%) using nominal doses and 94% (88–101%) using assayed contents of bambuterol. There was a slight treatment effect on steady-state AUC/dose of terbutaline, but the deviation from dose linearity was small (Figure 4). Moreover, single-dose AUC(0,∞) was consistent with steady-state. AUC(0,24 h) (Table 2). Mean MRT of terbutaline, was about 35 h after a single dose as well as in steady state. Figure 5 indicates that the steady-state relationship between terbutaline and bambuterol AUCs was nonlinear. The typical values of A and B (Equation 2) were 0.486 and 53.0, respectively. The 95% CI of A (0.432–0.540) did not include unity, thus supporting the visual indication of a nonlinear relationship, implying that the ratio between terbutaline and bambuterol AUCs decreased as the dose increased.
Figure 4.
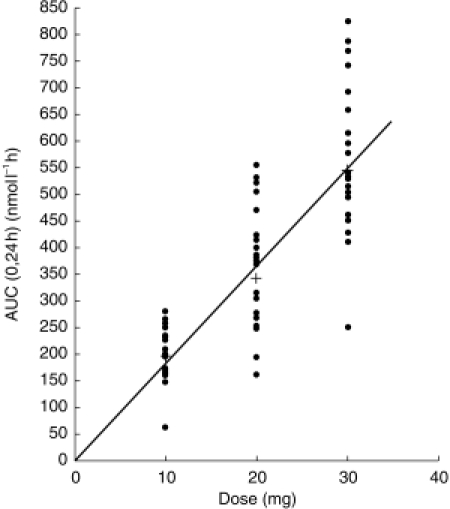
Individual (•) and mean (+) AUC(0,24 h) of terbutaline after dose 15 of bambuterol tablets 10, 20, and 30 mg.
Figure 5.

AUC(0,24 h) of terbutaline vs AUC(0,24 h) of bambuterol after dose 15 of bambuterol tablets 10 (▴), 20 (○), and 30 mg (•) and bambuterol solution 20 mg (□). The continuous line represents the outcome of a linear mixed effect model analysis of the relationship between ln AUC of terbutaline and ln AUC of bambuterol (cf. text).
CLR of terbutaline, about 110 ml min−1, could not be shown to be dependent on treatment and dose number. t½,z, on average 20–26 h (overall mean 22 h), was similar after dose 1 and dose 15, and could not be shown to differ between treatments.
After T20, the intraindividual coefficient of variation of AUC(0,24 h) was lower than that of Ae(0,24 h), which in turn was greater than that of Ae(0,24 h) after S20. Urine data supported the bioequivalence between tablet and solution suggested with plasma data and showed dose linearity.
Adverse effects
Clinical laboratory values outside normal reference ranges were not judged to be clinically relevant. No adverse events were classified as serious. Tremor was the most common adverse event actively asked for and incidence was related to dose.
Discussion
Biphasic absorption of bambuterol
This study confirmed that the terminal elimination of orally administered bambuterol is slow and most likely absorption-rate limited. However, during the first few hours after dosing this flip-flop behaviour of bambuterol was not seen. Furthermore, the 24h urinary excretion was shown to be 24% higher than predicted by terminal half-life. Thus, initially, some bambuterol appeared to be more rapidly absorbed than suggested by the terminal absorption-rate-limited half-life.
Steady-state pharmacokinetics
The t½,z of 16 h and the similarity between dose 8 and dose 15 confirmed the assumption that bambuterol was in steady state after 1 week of regular treatment (99% of the steady-state level is reached after seven half-lives). For T10 single-dose AUC(0,∞) of bambuterol was higher than steady-state AUC(0,24 h), indicating that the terminal phase of elimination had not been reached at the point from which the single-dose AUC was extrapolated.
The comparison between dose 8 and dose 15 of T20 and S20 showed that terbutaline was also at steady state after 1 week, which would be expected since mean t½,z was 22 h. The t½,z of oral plain terbutaline tablets is about 17 h [7]. t½,z of terbutaline was higher in this study probably because its presentation is prolonged during administration of bambuterol [3]. The observed plasma concentration at dosing time in steady state was consistent with the value predicted from t½,z and the single dose 24 h value, showing that t½,z was a major determinant for accumulation of terbutaline.
Pharmacokinetic linearity
For terbutaline, single-dose AUC(0,∞) was similar to AUC(0,24 h) in steady state. However, for bambuterol this comparison was not valid for T10 because plasma concentrations could not be reliably estimated after the single dose up to the point where the terminal phase of elimination started.
Dose proportionality was seen for terbutaline but not for bambuterol in the present study. Hydrolysis of bambuterol is catalysed to a major extent by plasma cholinesterase. Bambuterol is a potent inhibitor of plasma cholinesterase and therefore partly inhibits its own metabolism [8]; as recently proposed for asthmatic children [9], this is a plausible reason for the observed pharmacokinetic nonlinearity. The observed dose-dependent renal clearance should not have been an important factor since it accounts only for about 10% of the total clearance of bambuterol [3].
Previous data indicate that the ratio between terbutaline and bambuterol AUCs is higher after oral than after intravenous administration of bambuterol [3]. Thus, presystemic generation of terbutaline (or intermediary metabolites) should be quantitatively important after oral administration of bambuterol. Our data on bambuterol indicate that this first-pass biotransformation of bambuterol to terbutaline has limited capacity. Bambuterol probably inhibits plasma cholinesterase in the gastrointestinal tract. Considering the observed dose linearity for terbutaline, any loss of presystemic capacity to generate terbutaline must have been compensated for systemically. Previous data in subjects with low plasma cholinesterase activity support this, since mean AUC(0,24 h) of terbutaline after bambuterol 20 mg in that group was similar to the mean in subjects with normal plasma cholinesterase activity after the same dose [10].
Clinical pharmacokinetic aspects of dosing bambuterol to adults
A linear relationship between the serum concentration and bronchodilating response to terbutaline has been seen between 1.6 and 6 ng ml−1 (7–27 nmol l−1) [11–13]. Mean maximum and minimum terbutaline steady-state plasma concentrations (equivalent to serum concentration; Kerstin Tegnér, personal communication) were approximately within this range with clinically recommended doses of bambuterol (10–20 mg) in this study, although occasional individual values were not. The doubling of the plasma concentration of terbutaline during treatment implies that 24 h bronchodilation of oral bambuterol might not be obtained for a few days.
Intraindividual variability in AUC of bambuterol after doses 8 and 15 of T20 was approximately twice that of generated terbutaline. Bioanalytical variability was low in both cases and so could not explain the difference. An important factor was probably that the turnover of terbutaline between dosing intervals is relatively low (about 50% [7]) during treatment compared with bambuterol, most of which is eliminated during a 24 h dosing interval. A balance between presystemic and systemic generation of terbutaline might also contribute to the more stable concentration of terbutaline during treatment, low presystemic generation being compensated for by a high degree of systemic biotransformation of bambuterol and vice versa.
Conclusions
The present study with oral bambuterol showed that steady state was reached within a week. Regarding generated terbutaline, pharmacokinetics were judged to be linear, intraindividual variability of AUC at steady state was on average 15%, and tablets were bioequivalent with the solution.
Acknowledgments
The authors thank Britt-Marie Kennedy and Sven Jönsson (bioanalysis); Wiking Månsson, Marita Nilsson, Gunilla Öberg (clinical co-ordination); Marika Garskis Canka (data co-ordination); Sylvia Idström (language); Lars Borgström (scientific discussions).
References
- 1.Svensson L, Tunek A. The design and bioactivation of pre- systemically stable prodrugs. Drug Metab Rev. 1988;19:165–194. doi: 10.3109/03602538809049622. [DOI] [PubMed] [Google Scholar]
- 2.Tunek A, Levin E, Svensson L. Hydrolysis of 3H-bambuterol, a carbamate prodrug of terbutaline, in blood from humans and laboratory animals in vitro. Biochem Pharmacol. 1988;37:3867–3876. doi: 10.1016/0006-2952(88)90068-8. [DOI] [PubMed] [Google Scholar]
- 3.Nyberg L, Rosenborg J, Weibull E, Nilsson M, Jönsson S, Kennedy B. Pharmacokinetics of bambuterol in healthy subjects. Br J Clin Pharmacol. 1998;45:471–478. doi: 10.1046/j.1365-2125.1998.00695.x. [DOI] [PMC free article] [PubMed] [Google Scholar]
- 4.Augustinsson K-B, Eriksson H, Faijersson Y. A new approach to determining cholinesterase activities in samples of whole blood. Clin Chim Acta. 1978;89:239–252. doi: 10.1016/0009-8981(78)90322-4. [DOI] [PubMed] [Google Scholar]
- 5.Lindberg C, Jönsson S, Paulson J. Determination of bambuterol, a prodrug of terbutaline in plasma and urine by gas chromatography mass spectrometry. Biomed Environ Mass Spectrom. 1990;19:218–224. doi: 10.1002/bms.1200190403. [DOI] [PubMed] [Google Scholar]
- 6.Kennedy B, Blomgren A, Edholm L, Roos C. Quantitative determination of terbutaline in human plasma after administration of bambuterol using coupled columns and electrochemical detection. Chromatographia. 1987;24:895–899. [Google Scholar]
- 7.Nyberg L. Pharmacokinetic parameters of terbutaline in healthy man. An overview. Eur J Respir Dis. 1984;65(Suppl 134):149–160. [PubMed] [Google Scholar]
- 8.Tunek A, Svensson L. Bambuterol, a carbamate ester prodrug of terbutaline, as inhibitor of cholinesterase in human blood. Drug Metab Dispos. 1988;16:759–764. [PubMed] [Google Scholar]
- 9.Ahlström H, Alvero J, Alvero R, et al. Pharmacokinetics of bambuterol during oral administration to asthmatic children. Br J Clin Pharmacol. 1999;48:299–308. doi: 10.1046/j.1365-2125.1999.00028.x. [DOI] [PMC free article] [PubMed] [Google Scholar]
- 10.Bang U, Nyberg L, Rosenborg J, Viby-mogensen J. Pharmacokinetics of bambuterol in subjects homozygous for the atypical gene for plasma cholinesterase. Br J Clin Pharmacol. 1998;45:479–484. doi: 10.1046/j.1365-2125.1998.00697.x. [DOI] [PMC free article] [PubMed] [Google Scholar]
- 11.Lamont H, Van der Straeten M, Pauwels R, Moerman E, Bogaert M. The combined effect of theophylline and terbutaline in patients with chronic obstructive airway diseases. Eur J Respir Dis. 1982;63:13–22. [PubMed] [Google Scholar]
- 12.Billing B, Dahlqvist R, Garle M, Hörnblad Y, Ripe E. Separate and combined use of terbutaline and theophylline in asthmatics. Effects related to plasma levels. Eur J Respir Dis. 1982;63:399–409. [PubMed] [Google Scholar]
- 13.van den Berg B, Leferink J, Tabingh-suermondt W, et al. Terbutaline serum concentrations related to different lung function parameters and beta-receptor function. Int J Clin Pharmacol Ther Toxicol. 1983;21:24–30. [PubMed] [Google Scholar]