

Abstract
Aims
Albendazole (ABZ; methyl 5-propylthio-1H-benzimidazol-2-yl carbamate) is a broad spectrum anthelmintic whose activity resides both in the parent compound and its sulphoxide metabolite (ABS). There are numerous reports of ABZ metabolism in animals but relatively few in humans. We have investigated the sulphoxidation of ABZ in human liver microsomes and recombinant systems.
Methods
The specific enzymes involved in the sulphoxidation of ABZ were determined by a combination of approaches; inhibition with an antiserum directed against cytochrome P450 reductase, the effect of selective chemical inhibitors on ABZ sulphoxidation in human liver microsomes, the capability of expressed CYP and FMO to mediate the formation of ABS, regression analysis of the rate of metabolism of ABZ to ABS in human liver microsomes against selective P450 substrates and regression analysis of the rate of ABS sulphoxidation against CYP expression measured by Western blotting.
Results
Comparison of Vmax values obtained following heat inactivation (3min at 45°C) of flavin monoxygenases (FMO), chemical inhibition of FMO with methimazole and addition of an antiserum directed against cytochrome P450 reductase indicate that FMO and CYP contribute ≈ 30% and 70%, respectively, to ABS production in vitro. Comparison of CLint values suggests CYP is a major contributor in vivo. A significant reduction in ABZ sulphoxidation (n = 3) was seen with ketoconazole (CYP3 A4; 32–37%), ritonavir (CYP3 A4: 34–42%), methimazole (FMO: 28–49%) and thioacetamide (FMO; 32–35%). Additive inhibition with ketoconazole and methimazole was 69 ± 8% (n = 3). ABS production in heat – treated microsomes (3 min at 45 °C) correlated significantly with testosterone 6β-hydroxylation (CYP3A4; P < 0.05) and band intensities on Western blots probed with an antibody selective for 3A4 (P < 0.05). Recombinant human CYP3 A4, CYP1A2 and FMO3 produced ABS in greater quantities than control microsomes, with those expressing CYP3A4 producing threefold more ABS than those expressing CYP1A2. Kinetic studies showed the Km values obtained with both CYP3A4 and FMO3 were similar.
Conclusions
We conclude that the production of ABS in human liver is mediated via both FMO and CYP, principally CYP3A4, with the CYP component being the major contributor.
Keywords: albendazole, anthelmintic, FMO, metabolism, P450
Introduction
Albendazole [methyl 5-propylthio-1H-benzimidazol-2-yl carbamate; ABZ] is a broad-spectrum anthelmintic agent active against gastrointestinal nematodes and the larval stages of cestodes such as Echinococcus granulosus and Taenia solium [1]. Animal studies have demonstrated rapid conversion of ABZ to a sulphoxide (ABS) and subsequently a sulphone (ABSO) (Figure 1). ABS is considered to be responsible for the systemic biological activity of albendazole whereas ABSO is pharmacologically inert [2]. Evidence from preclinical studies and microsomal investigations in a number of species point to the involvement of two systems in the metabolism of ABZ. The flavin-containing monoxygenases (FMO) and cytochromes P450 (CYP; CYP450) appear to mediate conversion of ABZ to ABS, whereas the biotransformation of ABS to ABSO involves only CYP [3, 4]. However, the involvement of these enzyme systems in the human metabolism of ABZ is poorly understood. The increased usage of this drug against systemic infections, often for long periods and in combination with other agents means such information is essential in the prediction of drug interactions and adverse events associated with therapy. The aim of these investigations is twofold. Firstly, to establish the relative role of the FMO and CYP in the production of ABS and secondly to assess the contribution of individual CYP isoenzymes to this reaction. These investigations included use of specific CYP inhibitors, inhibitory antiserum, heterologous expression systems and correlations of albendazole sulphoxidation with reactions known to be catalysed by certain CYP isoenzymes.
Figure 1.
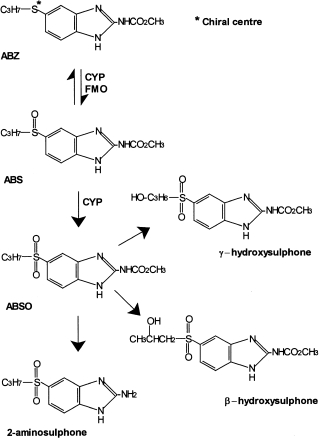
Structures of albendazole (ABZ), albendazolesulpoxide (ABS), albendazole sulphone (ABSO) and other minor metabolites. The asterisk indicates the site where a chiral centreis generated by sulphoxidation
Methods
Chemicals and reagents
ABZ was obtained from SmithKline Beecham Pharmaceuticals (Brentford,UK) and ABS from Robert Young & Co. (Glasgow). Methimazole, phenacetin, paracetamol, tolbutamide, testosterone, 6β-OH testosterone, 11β-OH testosterone, sulphaphenazole, diethyldithiocarbamate, glucose-6-phosphate, glucose-6-phosphate dehydrogenase, NADP+ and NADPH were purchased from the Sigma Chemical Company (Poole, Dorset, UK). Furafylline and 6-OH chlorzoxazone were obtained from Ultrafine Chemicals (Manchester, UK). Chlorpropamide and 4-OH tolbutamide were gifts from Hoechst AG (Frankfurt, Germany). Ketoconazole was a gift from Janssen (Beerse, Belgium). The cytochrome P450 reductase antiserum was a gift from Dr M. McManus (University of Queensland, Australia). H.p.l.c. grade acetonitrile, dichloromethane, ethyl acetate and methanol were supplied by Fisons plc (Loughborough, UK). All other reagents were of the highest grade obtainable.
Human liver samples
Histologically normal human livers were obtained from renal transplant donors. Consent for their donation was obtained from the next-of-kin. The Ethics Committee of the Mersey Region Health Authority granted approval for their use in this study. Liver samples were transferred on ice to the laboratory within 30 min where they were sectioned into 10–20 g portions, frozen in liquid nitrogen and stored in plastic sealed containers at −80 °C until use.
Preparation of human liver microsomes
Washed microsomes were obtained by differential centifugation. Protein concentration was determined spectrophotometrically [5] and the concentration of cytochrome P450 was determined by the method of Omura & Sato [6].
Analysis of albendazole and albendazole sulphoxide
Chromatography
The h.p.l.c. system consisted of a SpectraSeries P100 isocratic pump fitted with a Rheodyne® injection system and 50 µl loop, detection via a Spectra-Physics Spectra 100 variable wavelength detector connected to a Spectra-Physics SP4290 integrator and Spectra-Physics SP8780 autosampler (ThermoQuest Ltd, Manchester, UK). The mobile phase consisted of 1% triethylamine in distilled water: acetonitrile (86:14 v/v) buffered to pH 2.8 with orthophosphoric acid and flowing at 3.0 ml min−1 through a prepacked Novapak® phenyl column (10 cm × 5 mm i.d, 4 µm particle size: Fisons plc, Lougborough, UK) housed in a radial compression chamber (Z-module®; Millipore Waters) fitted with a Novapak® phenyl Guard-Pak® guard column with detection at 254 nm.
The extraction of all compounds was adapted from the method of Hoaksey et al. [7] using dichloromethane (DCM) as the solvent. Termination of microsomal incubations with ice cold acetonitrile (200 µl) was followed by addition of the internal standard, proguanil (500 ng) and DCM (5 ml). Tubes were capped and vortex mixed (10 s) before being centrifuged (1500 g; 15min). The organic layer was transferred to a clean glass tube (10 ml capacity) and a second aliquot of DCM (5 ml) was added to the aqueous layer, vortex mixed (10 s) and centrifuged (1500 g; 15min). The two organic layers were combined and the total organic phase was evaporated to dryness at 37 °C under a steady stream of nitrogen. Samples were reconstituted in mobile phase (100 µl), vortex mixed (20 s) and an aliquot (50 µl) injected onto the column.
Standard curves and assay specifications
Standard curves were constructed by spiking known amounts of ABS into phosphate buffer containing microsomal protein (0.1 mg) and processed as described above. Standard concentrations were plotted against their corresponding peak area ratios. Linear regression (GraFit® version 3.0) was performed to determine slope, intercept and correlation coefficient. Concentrations of unknown samples were determined by interpolation using the standard curve. Standard curves were linear (r2 ≥ 0.99) for ABS between 25 and 500 ng ml−1. The assay specifications determined were as follows: the inter- and intra-assay coefficient of variation was 4.3–6.4% and 5.6–6.6%, respectively, extraction efficiency was 77–80% and the minimum detection limit was 0.5 ng ml−1 at a working sensitivity of 0.005 a.u.f.s.
Determination of optimal conditions for microsomal incubations
All microsomal incubations were performed in a shaking water bath at 37 °C. Incubation tubes containing phosphate buffer (0.067 m; pH 7.4), microsomal protein and NADPH generating system (NADP+ (1 mm), glucose-6-phosphate (10 mm), magnesium chloride (5 mm) and glucose-6-phosphate dehydrogenase (2 units)) were allowed to equilibrate (37 °C, 3 min) prior to initiating the reaction by the addition of ABZ. The final total volume was 1 ml. All reactions were terminated with ice cold acetonitrile (200 µl) and treated as described above.
Microsomal incubations were optimized for protein concentration (0–2 mg; 6 µm ABZ; 10min) and incubation time (0–30min; 1 µm ABZ; 0.1 mg protein) to obtain linear incubation conditions. Incubation time was also optimized in reaction tubes containing MET (25 µm) due to the effects of MET on some CYP isoforms [8]. Controls for nonenzymatic conversion of ABZ contained protein (0.1 mg), phosphate buffer (0.067 m; pH 7.4) and ABZ (at the same concentration as in tests) and incubated without NADPH generating system.
NADPH cytochrome P450 oxidoreductase antiserum amount was optimized as follows: Tubes (duplicate) containing microsomal protein (0.1 mg) were incubated on ice (30min) with increasing volumes of NADPH cytochrome P450 oxidoreductase antiserum or control preimmune serum (0–50 µl). Tubes were then incubated (10min) as already described with ABZ (10 µl methanol, 6 µm final concentration).
The concentration of MET required for maximum inhibition was determined by incubating, as described previously, protein (0.1 mg), ABZ (10 µl methanol, 6 µm final concentration) and increasing concentrations of MET (0–50 µl distilled water, 0–50 µm) for 10 min.
FMO was heat inactivated by incubating tubes (0.1 mg protein and phosphate buffer) without NADPH generating system in a waterbath set at 45 °C for a total of 4 min 30 s (the initial 90 s is to equilibrate the contents).
Determination of kinetic parameters Km and Vmax
Kinetic studies were performed by incubating human liver microsomes (0.1 mg) with ABZ (10 µl methanol,1–12.5 µm final concentration) alone or in the presence of MET (25 µm), cytochrome P450 oxidoreductase antisera (30 µl preincubated on ice, 30 min) or following inactivation of FMO by heat (45 °C, 3 min). Tubes (duplicate) containing the reaction mixture in phosphate buffer (0.067 m, pH 7.4) and NADPH generating system were allowed to equilibrate in a shaking water bath (37 °C, 3 min). MET was added to the appropriate tubes and the reaction initiated by the addition of ABZ and terminatedafter 10min with ice cold acetonitrile (200 µl).
Effect of inhibitors and alternative substrates on ABS production
The inhibitors selected were used at concentrations specific for individual CYP isoenzymes [9–11]. These were: furafylline (FUR) and α-naphthoflavone (NAP) for CYP1 A1/2, sulphaphenazole (SULP) for CYP2C9, quinidine (QUIN) for CYP2D6, diethyldithiocarbamic acid (DDC) for CYP2E1, ketoconazole (KET) and ritonavir (RIT) [12] for CYP3 A4. For FMO, these were the alternative substrates MET and thioacetamide (THIO) [13] used at concentrations equivalent to or higher than their Km values [14, 15].
All inhibitors were dissolved in methanol and were evaporated to dryness at 37 °C under nitrogen and the drug was reconstituted in protein (0.1 mg; 15min on ice). MET was dissolved in distilled water and added directly to the reaction tube. Inhibitor studies were performed as follows: protein (0.1 mg), phosphate buffer, NADPH generating system and reconstituted inhibitor were mixed and equilibrated in a water bath (37 °C, 3 min). MET was added at this stage to the appropriate reaction tubes followed by ABZ (10 µl methanol; 6 µm) to initiate the reaction. Reactions were terminated after 10 min with ice cold acetonitrile (200 µl). Control tubes for nonenzymatic conversion of ABZ contained all components of the reaction mixture, except NADPH generating system, with the highest concentration of inhibitor.
Screen for inhibition of ABS production by CYP inhibitors and FMO cosubstrates
FUR (5 and 20 µm), NAP (0.25 and 1.0 µm), SULP (10 and 50 µm), QUIN (0.5 and 1.0 µm), DDC (10 and 50 µm), KET (0.5 and 1 µm), RIT (0.5 and 1 µm), THIO (250 and 500 µm) and MET (10 and 25 µm) were incubated as described above. Tubes containing the mechanism-based inhibitors FUR or DDC were mixed and preincubated (37 °C, 20min) prior to incubation with ABZ (6 µm) (as described previously) and additional NADPH (1 mm).
Determination of inhibitor concentrations required to reduce ABS production by 25% (IC25) or 50% (IC50)
Increasing concentrations of KET (0.05–1.0 µm), RIT (0.05–1.0 µm), NAP (0.05–1.0 µm), THIO (50–500 µm) and MET (1–25 µm) were incubated with ABZ (6 µm) as described previously.
Additive inhibition of ABS production
Two sets of tubes were prepared: the first set (duplicate) contained increasing concentrations of KET (0.1–1.0 µm), the second contained a fixed concentration of KET (1 µm) and increasing concentrations of MET (1–25 µm final conc.). The tubes were incubated with ABZ (6 µm) as described previously.
Determination of individual enzyme activities and quantification by immunoblot
Microsomes were assessed for their ability to catalyse phenacetin-O-de-ethylation (CYP1 A2), tolbutamide 4-hydroxylation (CYP2C9), chlorzoxazone 6-hydroxylation (CYP2E1) and testosterone 6β-hydroxylation (CYP3 A4) and immunoblotted by SDS-PAGE for CYP3 A4 and CYP1 A2 content. Preparation of the individual human liver microsomes, protein content, cytochrome P450 contents and SDS-PAGE immunoblotting for CYP3 A4 and CYP1 A2 was performed as previously described [16] while enzyme assays for CYP probe substrates were performed at concentrations equivalent to Km [12]. Sets of tubes (n = 4) containing protein (0.1 mg) from individual human livers (n = 10) and phosphate buffer (0.067 m, pH 7.4) were prepared. From each set two tubes were heat-treated (3 min at 45 °C) whilst the remaining two tubes were maintained on ice. Following heat treatment the tubes were allowed to cool before addition of NADPH–generating system. All reaction tubes were then incubated with ABZ (6 µm) as described previously.
Determination of kinetic parameters Km and Vmax in recombinant microsomes expressing CYP3 A4 and FMO3
Catalytic activity was assessed in recombinant microsomes derived from genetically engineered human lymphoblastoma or baculovirus infected insect cell lines expressing a single CYP or FMO enzyme (Gentest Corporation, Woburn, MA, USA). Reactions were performed in Eppendorf® tubes (1.5 ml). Tubes containing phosphate buffer and NADPH generating system were allowed to equilibrate in a water bath (37 °C, 3min) before the addition of protein and ABZ (10 µl methanol). Reactions were terminated with 200 µl acetonitrile. Samples were then transferred to clean test tubes and drug extracted as described previously.
Initially recombinant microsomes expressing CYP1A2, 2C9, 3A4 (100 µg protein), FMO3 (50 µg protein) and control microsomes were incubated with ABZ (6 µm; 60 min) as described previously. For microsomes where ABS production was above control values, conditions were optimized for protein (CYP3A4 at 14.5–58 µg protein and FMO3 at 50–200 µg protein; 30min incubation) and time (CYP3A4 at 21.75 µg protein and FMO3 at 25 µg protein incubated for 0, 15, 30, 45 and 60min) with ABZ (6 µm) as described previously.
To determine kinetic parameters, CYP3A4 protein (21.75 µg) and FMO3 protein (50 µg) were incubated with increasing concentrations of ABZ (10 µl methanol, 1–10 µm final concentration) for 30 min as described previously.
Data analysis
Three models (one and two site Michaelis – Menten, and one site plus nonsaturable binding) were fitted to untransformed data for rate vs substrate concentration from all of the enzyme kinetic incubations using the nonlinear regression program GraFit® version 3.0 [17, 18] with data weighted proportionally.
Model discrimination was based on the F-test, rejecting the null hypothesis when P < 0.05. In each case the model associated with the smallest value of reduced chi – squared produced the best fit. When P > 0.05, the simplest model (model I) was used. The mean values of each kinetic parameter and inhibitory data were compared using two-way analysis of variance with Bonferroni modified t-test. Inhibitor concentrations (IC25) were estimated using GraFit® [17]. Correlations were determined by Spearmans Rank Correlation using SPSS version 7.5.
Results
Optimization of incubation conditions
The production of ABS by human liver microsomes was linear between 0.05 and 2 mg protein and between 3 and 30 min for ABZ, but between 3 and 20 min for ABZ with MET. Incubation conditions were performed using microsomal protein (0.1 mg) incubated for 10 min to ensure linear conditions with and without MET. Increasing concentrations of NADPH cytochrome P450 oxidoreductase antiserum and MET produced a reduction in ABS (Figure 2) up to 20 µl cytochrome P450 oxidoreductase antiserum and 10 µm MET after which no further change was observed. ABS production was unchanged in the presence of the control preimmune serum. At a fixed concentration of ABZ (6 µm), the effect of heat treatment, MET (25 µm) and NADPH cytochrome P450 oxidoreductase antiserum (30 µl) caused a reduction in ABS production of 20 ± 3%, 34 ± 5% and 41 ± 11%, respectively (mean± sd; n = 3). Additive inhibition with cytochrome P450 oxidoreductase antiserum, heat treatment and MET (25 µm) produced a maximum reduction of 71 ± 7% (n = 3).
Figure 2.
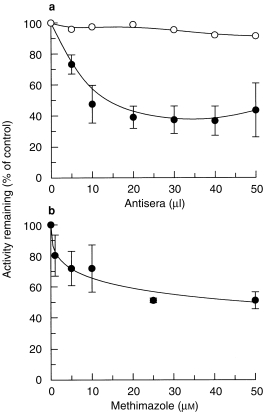
Effects of (a) increasing volumes of cytochrome P450 reductase antiserum (•) and pre-immune serum (○) and (b) increasing concentrations of MET on ABS production in human liver microsomes. Data are mean (s.d) of three livers.
Determination of the kinetic parameters Km and Vmax
The effects of incubation with MET (inhibition of FMO), NADPH cytochrome P450 oxidoreductase antiserum (inhibition of CYP) and after heat treatment (inhibition of FMO) on the kinetic profile of ABS production following incubation with increasing concentrations of ABZ are summarised in Figure 3a. Although all three models could be fitted to most of the kinetic data the lack of any significant difference (F-test, P > 0.05) among the models meant that the kinetic parameters, Km and Vmax, were calculated using the simplest model (Model I). These are summarised in Table 1. Although incubations were performed under linear conditions the insolubility of ABZ at high concentrations meant that saturation of the enzyme systems could not be attained for control, heat-treated and MET microsomal incubations. Hence the model fitted to these data had to extrapolate to estimate Vmax (and therefore Km). Assuming that NADPH cytochrome P450 oxidoreductase antiserum inhibition of CYP activity and inhibition/inactivation of FMO activity would, respectively, leave FMO and CYP activity, respectively, intact to metabolize ABZ, comparisons of the Vmax values show that FMO and CYP are responsible for 29.5 ± 12.2% (cytochrome P450 oxidoreductase antiserum, n = 3) and 63.2 ± 8.2% (heat inactivation, n = 3) to 67.2 ± 8.6% (inhibition by MET, n = 3) of total ABS production, respectively. Intrinsic clearance (CLint) values show that CYP mediated metabolism of ABZ (77.1 and 93.7 µl min−1 mg−1) was not significantly different from the controls (99.7 µl min−1 mg−1) but FMO contributed significantly less (40.7 µl min−1 mg−1, P = 0.0033) to the overall metabolism (Table 1). Transformation of these data, represented by v vs v/S plots (Figure 3b) show monophasic kinetics for each reaction consistent with the contribution of a single enzyme system.
Figure 3.
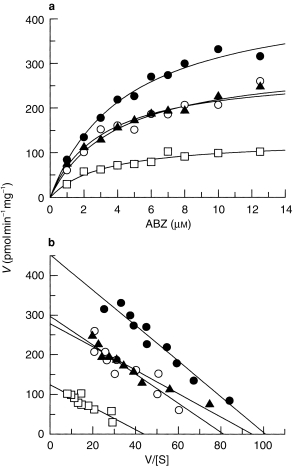
The effects of methimazole (○), heat treatment (▴) and cytochrome P450 reductase antiserum (□) on the kinetics of ABZ metabolism (to ABS) in human liver microsomes. Data arethe mean of three livers. Control values are (•).
Table 1.
The effects of methimazole, heat treatment and cytochrome P450 reductase antiserum on the estimated kinetic parameters obtained for ABS production in human liver microsomes. Data are mean (±sd) for three livers. Significantly different from control valuea.
| Inhibitor | Km (μm) | Vmax (pmol min−1 mg−1) | CLint (μl min−1 mg−1) |
|---|---|---|---|
| Controls | 4.64±0.83 | 456.8±83.2 | 99.7±17.3 |
| Methimazole (25 μm) | 4.03±0.91 | 306.5±69.2a | 77.1±13.8 |
| Heat treatment (3 min at 45° C) | 3.72±2.18 | 288.7±69.0a | 93.7±45.6 |
| P450 oxidoreductase antiserum (30 μl) | 3.59±1.52 | 128.0±26.8a | 40.7±18.6a |
Effects of inhibitors and substrates on ABS production
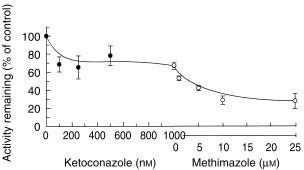
Screening of putative inhibitors of CYP and alternative substrates of FMO (Figure 4) showed a significant reduction in ABS production (P < 0.025) by KET (32–37%), MET (28–49%), RIT (34–42%) and THIO (32–35%). Minimal inhibition was observed with NAP, FUR, SULP, QUIN or DDC, however, some activation of ABS production occurred at higher concentrations of NAP (25%, P = 0.03) and QUIN (67%, P = 0.001). Rank order of potency was determined to be KET > RIT > MET > THIO based on the IC25 data obtained (0.07 µm, 0.08 µm, 6.0 µm and 190 µm, respectively, n = 3). The additive inhibitory effects of KET (1 µm) and MET (25 µm) did not give complete inhibition of ABS production, despite both inhibitors exhibiting saturation of inhibition, but gave an overall reduction of 69 ± 8% (n = 3) (Figure 5).
Figure 4.
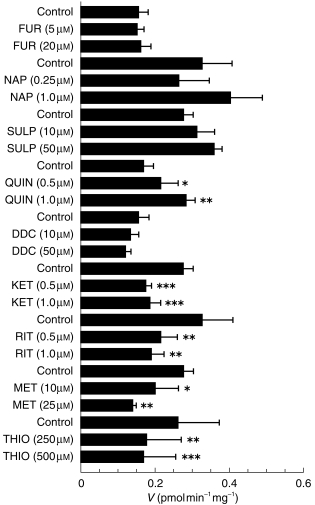
The effects of inhibitors of CYP and alternative substrates for FMO on the production of ABS in human liver microsomes. Data are mean (s.d.) of three livers. *P < 0.025; **P < 0.005; ***P < 0.001.
Figure 5.
Additive inhibition of ABS production in human liver microsomes by ketoconazole alone (•) and plus methimazole (○). Data are mean (s.d.) of three livers.
Correlation analysis of ABS production with CYP probe substrate activities and CYP immunoblots
In heat-treated microsomes, significant correlations were obtained with CYP3 A4 activity and immunoblot band intensity (P < 0.05) with Spearman Rank Correlation coefficients of 0.90 and 0.67, respectively (Figure 6a,b, respectively). Significant correlations were not observed with either CYP1 A2, CYP2C9 or CYP2E1 activities or immunoblots (data not shown).
Figure 6.
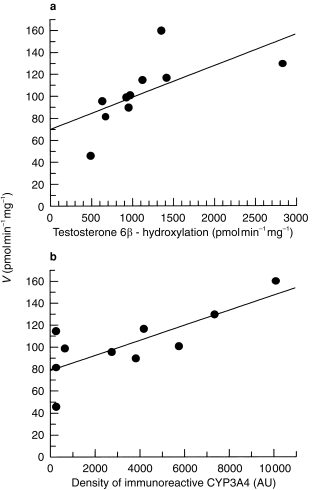
Correlation of ABS production with (a) catalytic activity of testosterone 6 hydroxylation (CYP3A4) and (b) density of immunoreactive CYP on SDS-PAGE immunoblotted for CYP3A4.
Determination of kinetic parameters in recombinant microsomes
A screen of recombinant microsomes expressing CYP 1A2, 2C9, 3A4 and FMO3 showed ABS production in excess of the control values with CYP 1A2, 3A4 and FMO3, with CYP3A4 producing approximately threefold more ABS than CYP1A2. The production of ABS from recombinant microsomes expressing CYP3A4 and FMO3 were linear for protein concentration between 14.5 and 58 µg and 25–200 µg, respectively, and for incubation time between 15 and 60min. Initial kinetic studies estimated the parameters Km and Vmax to be 10.1 µm and 369 pmol min−1 mg−1 (CYP3A4) and 9.6 µm and 1103 pmol min−1 mg−1 (FMO3). As already noted for human microsomes, the kinetic plots for these recombinant microsomes (data not shown) did not attain Vmax and the estimated Kms are high on the substrate concentration range. Kinetic parameters were not determined for CYP1A2 due to low activity in these microsomes.
Discussion
The importance of phenotyping the enzyme systems/pathways involved in the biotransformation of a xenobiotic is reflected in the many adverse drug interactions that occur due to the inhibition or induction of enzyme systems [19]. Previous investigations suggest involvement of both CYP and FMO enzymes in the formation of ABS. To determine the contribution of these two enzyme systems to ABS production in human liver microsomes, FMO and CYP were inactivated and inhibited selectively.
Heat treatment at 45 °C inactivates FMO [15] with little effect on CYP activity [20] although higher temperature (50 °C) can cause some loss of CYP 2 A6 and 2C9 [21]. Methimazole (MET) is an alternative substrate that is widely used to probe for the presence of FMO [22]. MET can inhibit some CYP isoenzymes [8, 14], however, at the low concentrations and short incubation times used in these studies MET is a selective competitive substrate for FMO [8, 13]. NADPH cytochrome P450 oxidoreductase antiserum exhibits good selectivity for reactions involving CYP, inhibiting the reduction of cytochrome c (a substrate for cytochrome P450 reductase), CYP mediated reactions and probe CYP substrates in human liver microsomes to the same extent [20], although all CYP activity may not be completely inhibited. The most appropriate conditions for maximum inhibition with MET and cytochrome P450 oxidoreductase antiserum were 25 µm and 30 µl, respectively, after which no further inhibition was observed. Incubation of ABZ with preimmune serum indicated that inhibition by cytochrome P450 oxidoreductase antiserum was not due to nonspecific binding of protein to ABZ.
Initial studies with MET and antiserum indicated that the relative contributions of FMO and CYP towards ABS production were be similar (34% MET; 41% antiserum) with an additive inhibition of 69–71%. Incomplete additive inhibition may be due to the contribution of a third enzyme not completely inhibited by either the antiserum or MET under these conditions. Although CYP and MET appear to contribute equally to the metabolism of ABZ, FMO and CYP were selectively inhibited and the kinetic profiles of the remaining activity determined. To accurately profile the enzyme kinetics of ABZ An extensive substrate range would be necessary, increasing the likelihood of including clinically relevant in vivo concentrations and improving chances of detecting biphasicity [23]. However, poor solubility of ABZ at high concentrations (i.e. > 12.5 µm) and the limits of detection at lower concentrations of ABZ (i.e. < 0.25 µm) restricted the range of working concentrations used. Xenobiotic biotransformations in vivo, where only low substrate concentrations are usually achieved, are often determined by the enzyme with the highest affinity for the xenobiotic and are often more clinically relevant [23]; hence the concentration range used was considered appropriate.
The parameter Vmax/Km is a measure of in vitro intrinsic clearance (CLint) and is not not influenced by in vivo factors such as hepatic blood flow or plasma protein binding [24, 25]. When more than one enzyme catalyses the same reaction, as already indicated in ABZ metabolism by inhibition with MET, heat-treatment and cytochrome P450 oxidoreductase antiserum, the relative contributions of each enzyme to the metabolism of the substrate in vivo can be determined using this parameter. Kinetic profiles and parameters were determined after selective inhibition of CYP and FMO. Although all the kinetic models fitted most of the kinetic data, none fitted significantly better than the single enzyme Michaelis – Menten model. Thus, the kinetic parameters were determined using this model. Whereas the Km for each reaction was indistinguishable statistically, both Vmax and CLint for FMO mediated ABS production were significantly lower (P = 0.0001 and P = 0.0033, respectively) than control values (Table 1). This indicates that the FMO component is relatively minor and that CYP is the major contributor of ABS production in vivo. Transformation of these data to Eadie – Hofstee plots (Figure 3b) shows there is little or no evidence of nonlinearity for any of the reactions, this combined with the fit of the single enzyme kinetic model to the kinetic data (model I) suggests a single enzyme system involved in the production of ABS despite evidence for ABS production being mediated by more than one enzyme. The similarities in Km for both CYP mediated (microsomes inhibited by MET/heat inactivated) and FMO mediated (inhibited by cytochrome P450 reductase antiserum) enzyme reactions may explain in part the absence of biphasicity in the Eadie-Hofstee plots obtained over this substrate concentration range.
Using inhibitors selective for individual CYP iso-enzymes and alternative FMO substrates, significant inhibition (P < 0.05) of ABS production was produced with KET, RIT, MET and THIO whereas little or no significant inhibition was observed for with other inhibitors (Figure 4). Some activation of ABZ sulphoxidation was noted for NAP and QUIN, which was unexpected for QUIN but activation by NAP has been attributed to a unique characteristic of CYP3A which allows two molecules, two substrates or substrate and activator, to bind to the active site simultaneously [26]. NAP is a substrate of CYP3A4 and can act as either activator or inhibitor of some CYP3A mediated reactions at concentrations > 1 µm [27, 28]. The inhibition of ABS production by KET and RIT is similar to that seen for the CYP3A4 probe substrate reaction testosterone 6β-hydroxylation (KET IC50 0.22 µm and RIT IC50 0.034 µm) [12, 29], indicating that CYP mediated production of ABS is predominantly via CYP3A4. Evidence for CYP3A4 involvement is supported both by the metabolism of ABZ by microsomes expressing recombinant CYP3A4 and the positive and statistically significant correlations of ABS production in heat inactivated human liver microsomes (to remove influence of FMO mediated ABS production) with testosterone 6β-hydroxylation (P < 0.05) and the band density of immunoreactive CYP3A4 (P < 0.05). Although ABZ biotransformation was also observed in microsomes expressing recombinant CYP1A2 (activity was insufficient for an estimation of the kinetic parameters), no significant inhibition was obtained with NAP or FUR and significant correlations were not obtained with phenacetin O de-ethylation (CYP1A2), nor with immunoreactive CYP1A2. Despite evidence of CYP1A1/2 involvement in the biotransformation of ABZ in the rat [4, 30] and human hepatoma cell lines [31], the data presented here for its involvement in this reaction in human liver microsomes is inconclusive. Absence of significant correlations of ABZ biotransformation with tolbutamide 4-hydroxyl-ation (CYP2C9) and chlorzoxazone 6-hydroxylation (CYP2E1), the lack of biotransformation in recombinant microsomes expressing CYP2C9 and little or no inhibition by SULP and DDC, suggests that there is little or no involvement of these enzymes in the production of ABS. However, the involvement of CYP 2A6, 2B6, 2C8 or 2C19 cannot be discounted. The contribution of FMO to the production of ABS in human liver microsomes (FMO3 is the principal FMO form in human liver) is shown by the inhibitory effects of the alternative FMO substrates MET and THIO and the biotransformation of ABZ in recombinant microsomes expressing FMO3. MET was a more potent inhibitor than THIO, due probably to its higher affinity for FMO [15]. The additive inhibition of KET and MET (69%) (Figure 5) is in good agreement with that observed with cytochrome P450 oxidoreductase antiserum and MET (71%). It can be seen that both KET and MET completely inhibited CYP3A4 and FMO therefore the remaining activity is likely to be due to another enzyme, possibly a CYP isoenzyme that is less susceptible to inhibition by the cytochrome P450 oxidoreductase antiserum.
In conclusion, the biotransformation of ABZ in human liver microsomes appears to be mediated by two or more enzymes. One of the enzymes is of the FMO family (probably FMO3, the major form in human liver) and the other enzyme(s) is of the CYP family, the most probable major contributor being CYP3A4. Inhibition of either enzyme by other drugs could alter the concentrations of ABZ and ABS in vivo. Of interest also is the influence such drug interactions may have on the chemotherapeutic ability of ABZ, since ABS exists in the plasma as two enantiomers [32] and as it is unknown which (or both) enantiomer carries anthelmintic activity. In addition because CYP1A2 can be induced by ABZ itself [30] a clarification of its involvement in ABZ metabolism in humans is required. These issues warrant further investigation.
Acknowledgments
The authors gratefully acknowledge the financial support of SmithKline Beecham Pharmaceuticals.
References
- 1.Horton RJ. Benzimidazoles in a wormy world. Parasitology Today. 1990;6:106. doi: 10.1016/0169-4758(90)90225-s. [DOI] [PubMed] [Google Scholar]
- 2.Gottschall DW, Theodorides VJ, Wang R. The metabolism of benzimidazole anthelmintics. Parasitology Today. 1990;6:115–124. doi: 10.1016/0169-4758(90)90228-v. [DOI] [PubMed] [Google Scholar]
- 3.Souhaili-el Amri H, Fargetton X, Delatour P, Batt AM. Sulphoxidation of albendazole by the FAD-containing and cytochrome P450 dependent monooxygenases from pig liver microsomes. Xenobiotica. 1987;17:1159–1168. doi: 10.3109/00498258709167408. [DOI] [PubMed] [Google Scholar]
- 4.Souhaili-el Amri H, Mothe O, Totis M, Masson C, Batt AM, Delatour P. Albendazole sulfonation by rat-liver cytochrome-P-450C. J Pharmacol Exp Ther. 1988;246:758–764. [PubMed] [Google Scholar]
- 5.Lowry OH, Rosebrough NJ, Farr AL, Randall RJ. Protein measurement with the Folin Phenol reagent. J Biol Chem. 1951;193:265–275. [PubMed] [Google Scholar]
- 6.Omura T, Sato R. Carbon monoxide binding pigment of liver microsomes. I. Evidence for its hemoprotein nature. J Biol Chem. 1964;239:2370–2378. [PubMed] [Google Scholar]
- 7.Hoaksey PE, Awadzi K, Ward SA, Coventry PA, Orme ML'E, Edwards G. Rapid and sensitive method for the determination of albendazole and albendazole sulphoxide in biological-fluids. J Chromatogr Biomed Appl. 1991;566:244–249. doi: 10.1016/0378-4347(91)80131-u. [DOI] [PubMed] [Google Scholar]
- 8.Guo Z, Raeissi S, White RB, Stevens JC. Orphenadrine and methimazole inhibit multiple cytochrome P450 enzymes in human liver microsomes. Drug Metab Dispos. 1997;25:390–393. [PubMed] [Google Scholar]
- 9.Halpert JR, Guengerich FP, Bend JR, Correia MA. Selective inhibitors of cytochromes P450. Toxicol Appl Pharmacol. 1994;124:163–175. doi: 10.1006/taap.1994.1061. [DOI] [PubMed] [Google Scholar]
- 10.Newton DJ, Wang RW, Lu AYH. Cytochrome P450 inhibitors. Evaluation of specificities in the in vitro metabolism of therapeutic agents by human liver microsomes. Drug Metab Dispos. 1995;23:154–158. [PubMed] [Google Scholar]
- 11.Ono S, Hatanaka T, Hotta H, Satoh T, Gonzalez FJ, Tsutsui M. Specificity of substrate and inhibitor probes for cyto- chrome P450: evaluation of in vitro metabolism using cDNA-expressed human P450s and human liver microsomes. Xenobiotica. 1996;26:681–693. doi: 10.3109/00498259609046742. [DOI] [PubMed] [Google Scholar]
- 12.Eagling VA, Back DJ, Barry MG. Differential inhibition of cytochrome P450 isoforms by the protease inhibitors, ritonavir, saquinavir and indinavir. Br J Clin Pharmacol. 1997;44:190–194. doi: 10.1046/j.1365-2125.1997.00644.x. [DOI] [PMC free article] [PubMed] [Google Scholar]
- 13.Ziegler DM. Methimazole and inhibitors of FMO [Personal Communication. Facsimile] 1997 [Google Scholar]
- 14.Kedderis GL, Rickert DE. Inhibition of the microsomal N-hydroxylation of 2-amino-6-nitrotoluene by a metabolite of methimazole. Biochem Biophys Res Comm. 1983;113:433–438. doi: 10.1016/0006-291x(83)91744-8. [DOI] [PubMed] [Google Scholar]
- 15.Ziegler DM. Enzymatic Basis Detoxication. New York: Academic Press Inc; 1980. Microsomal flavin-containing monooxygenase: oxygenation of nucleophilic nitrogen and sulphur compounds; pp. 201–227. [Google Scholar]
- 16.Gentile DM, Tomlinson ES, Maggs JL, Park BK, Back DJ. Dexamethasone metabolism by human liver in vitro. Metabolite identification and inhibition of 6-hydroxylation. J Pharmacol Exp Ther. 1996;277:105–112. [PubMed] [Google Scholar]
- 17.Leatherbarrow RJ. Erithacus Software Ltd; 1992. Grafit® (ZVersion 3.0) [Google Scholar]
- 18.Tracy TS, Marra C, Wrighton SA, Gonzalez FJ, Korzekwa KR. Involvement of multiple cytochrome P450 isoforms in naproxen O-demethylation. Eur J Clin Pharmacol. 1997;52:293–298. doi: 10.1007/s002280050293. [DOI] [PubMed] [Google Scholar]
- 19.Griffin JP, D'Arcy PFA. Manual of Adverse Drug Interactions. 5. Amsterdam: Elsevier Science B V; 1997. [Google Scholar]
- 20.McManus ME, Stupans I, Burgess W, Koenig JA, de la Hall PM, Birkett DJ. Flavin – containing monooxygenase activity in human liver microsomes. Drug Metab Dispos. 1987;15:256–261. [PubMed] [Google Scholar]
- 21.Grothusen A, Hardt J, Brautigam L, Bocker R. A convenient method to discriminate between cytochrome P450 enzymes and flavin–containing monooxygenases in human liver microsomes. ArchToxicol. 1996;71:64–71. doi: 10.1007/s002040050359. [DOI] [PubMed] [Google Scholar]
- 22.Ziegler DM. Flavin–containing monooxygenases: enzymes adapted for multisubstrate specificity. Trends Pharmacol Sci. 1990;11:321–324. doi: 10.1016/0165-6147(90)90235-z. [DOI] [PubMed] [Google Scholar]
- 23.Rodrigues AD. Use of in vitro human metabolism studies in drug development. An industrial perspective. Biochem Pharmacol. 1994;48:2147–2156. doi: 10.1016/0006-2952(94)00312-2. [DOI] [PubMed] [Google Scholar]
- 24.Houston JB. Utility of in vitro drug metabolism data in predicting in vivo metabolic clearance. Biochem Pharmacol. 1994;47:1469–1479. doi: 10.1016/0006-2952(94)90520-7. [DOI] [PubMed] [Google Scholar]
- 25.Kroemer HK, Echizen H, Heidemann H, Eichelbaum M. Predictability of the in vivo metabolism of verapamil from in vitro data: Contribution of individual metabolic pathways and stereoselective aspects. J Pharmacol Exp Ther. 1992;260:1052–1057. [PubMed] [Google Scholar]
- 26.Shou M, Grogan J, Mancewicz JA, et al. Activation of CYP3A4: Evidence for the simultaneous binding of two substrates in a cytochrome P450 active site. Biochem. 1994 1990;33:6450–6455. doi: 10.1021/bi00187a009. [DOI] [PubMed] [Google Scholar]
- 27.Lee HS, Jin CB, Chong HS, Yun CH, Park JS, Kim DH. Involvement of CYP3A4 in the metabolism of 7,8–benzoflavone by human liver microsomes. Xenobiotica. 1994;24:1053–1062. doi: 10.3109/00498259409038665. [DOI] [PubMed] [Google Scholar]
- 28.Lee HS, Jin C, Park J, Kim DJ. Modulation of cytochrome P450 activities by 7,8-benzoflavone and its metabolites. Biochem Mol Biol Internatl. 1994;34:483–491. [PubMed] [Google Scholar]
- 29.Baldwin SJ, Bloomer JC, Smith GJ, Ayrton AD, Clarke SE, Chenery RJ. Ketoconazole and sulfaphenazole as the respective selective inhibitors of P4503a and 2C9. Xenobiotica. 1995;25:261–270. doi: 10.3109/00498259509061850. [DOI] [PubMed] [Google Scholar]
- 30.Souhaili–el Amri H, Fargetton X, Benoit E, Batt AM. Inducing effect of albendazole on rat liver drug metabolizing enzymes and metabolite pharmacokinetics. Toxicol Appl Pharmacol. 1988;92:141–149. doi: 10.1016/0041-008x(88)90236-0. [DOI] [PubMed] [Google Scholar]
- 31.Rolin S, Souhaili-el Amri H, Batt AM, Levy M, Bagrel D, Siest G. Study of the in vitro bioactivation of albendazole in human liver microsomes and hepatoma cell lines. Cell Biol Toxicol. 1989;5:1–14. doi: 10.1007/BF00141060. [DOI] [PubMed] [Google Scholar]