

Abstract
Aims
To evaluate the prerequisites for using ethanol dilution to estimate total body water, we studied the within- and between-subject variation in the parameter estimates of a two-compartment model for ethanol pharmacokinetics with parallel Michaelis-Menten and first-order renal elimination. Because sampling of breath might be preferable in some clinical situations the parameter estimates derived from breath and venous blood were compared.
Methods
On two occasions, ethanol 0.4 g kg−1 was given by intravenous infusion to 16 volunteers after they had fasted overnight. The proposed model was fitted by means of nonlinear regression to concentration-time data measured in the breath, venous blood and urine during 360 min. The model contained six parameters: Vmax and Km (Michaelis-Menten elimination constants), CLd (intercompartmental distribution parameter), VC and VT (volumes of the central and tissue compartment, respectively) and CLR (renal clearance). The volume of distribution, Vss, was calculated as the sum of VC and VT.
Results
The mean ± total s.d. of the parameter estimates derived from blood data were Vmax 95 ± 25 mg min−1, Km 27 ± 19 mg l−1, CLd 809 ± 232 ml min−1, VC 14.5 ± 4.3 l, VT 21.2 ± 4.4 l, CLR 3.6 ± 2.0 ml min−1 and Vss 35.8 ± 4.3 l. The variation within subjects amounted to 3%, 9%, 21%, 21%, 17%, 26% and 2%, respectively, of the total variation. Breath samples were associated with a similar or lower variation than blood, both within and between subjects. About 1.5% of the infused ethanol was recovered in the urine.
Conclusions
The low within-subject variation of the key parameter Vss (only 2%) suggests that ethanol dilution analysed by the pharmacokinetic model applied here may be used as an index of the total body water. Breath samples yielded at least as good reproducibility in the model parameters as venous blood.
Keywords: alcohol, ethanol, nonlinear kinetics, pharmacokinetics, variance components
Introduction
The pharmacokinetics of ethanol have been studied extensively since the 1930s [1, 2]. The classical Widmark one-compartment model with zero-order elimination is simple and gives a single value for the rate of elimination [3], but Michaelis-Menten kinetics better describe both the rectilinear part of the wash-out curve and the terminal endpoints [4]. Therefore, models with one [5] or two [6] compartments and Michaelis-Menten elimination have been applied, although the approaches used rarely consider urinary losses of ethanol [7]. Further development of pharmacokinetic models for ethanol have been reported in animals but the wide range of doses used cannot ethically be applied in humans [8, 9]. Difficulties in the modelling process typically consist of the variable elimination rate and the combination of linear and nonlinear kinetics. It is currently debated whether first-pass metabolism of ethanol is gastric or hepatic [10–12] and whether it is influenced by various drugs and the rate of gastric emptying [13, 14]. After oral intake, within-subject variation of ethanol kinetics is thought to be of similar [15] or smaller magnitude [16] than the between-subject variation. The components of variation, however, have not been studied after intravenous administration of ethanol.
This study was part of a larger project aimed at estimating total body water by the ethanol dilution principle. To investigate the conditions for that method, we wanted to assess the magnitude of within- and between-subject variation of the model parameters in repeat experiments by applying a two-compartment model containing parallel Michaelis-Menten metabolic elimination with first-order renal excretion to breath or blood concentration-time data and to the cumulative amount of ethanol excreted in the urine. Because analysis of breath might be preferable in many clinical settings we compared the parameter estimates obtained from invasive (venous blood) and noninvasive (expired air) sampling. The confounding factors of oral administration, such as absorption, emptying rate of the stomach and first-pass metabolism, were eliminated by using the intravenous route for administration of ethanol.
Methods
Eight women aged 33 ± 9 years and eight men 33 ± 6 years participated in the study as paid volunteers. Their mean body weights were 71.4 ± 8.1 kg and height 172 ± 9 cm. Body mass index was 24.0 ± 2.9 kg m−2. All the subjects were healthy and accustomed to moderate drinking and half of them were smokers. Health-status was assessed by laboratory screening, patient history and physical examination. Subjects with a history of alcohol abuse or abnormal laboratory tests for liver enzymes were not recruited. The study was approved by the ethics review board at the Huddinge University Hospital and informed consent was obtained from all volunteers.
Procedure
Each subject participated in two alcohol dosing studies performed 2 days apart under identical conditions. The subjects arrived at the laboratory at about 07.00 h after an overnight fast. An intravenous cannula (Venflon, BOC Ohmeda, Helsingborg, Sweden) was inserted into a cubital vein for infusion and another in the opposite arm for blood sampling. The volunteer emptied the bladder just before starting the experiment.
Ethanol 10% (w/v) in glucose 50 mg ml−1 (Apoteksbolaget, Umeå, Sweden) was given as a 30 min constant rate intravenous infusion, the target dose was 0.4 g kg−1 body weight. The infusion was administered by an infusion pump IVAC model 560 (San Diego, CA, USA) and the precise amount given was determined by weighing the remainder and estimating the infused volume by difference. A parallel infusion of normal saline was given at the same rate and in the same vein to prevent discomfort owing to the high osmolality of the alcohol solution. This gave a total intravenous volume load of 8 ml kg−1 body weight in half an hour (560 ml in a 70 kg subject). The volunteers fasted, refrained from smoking and remained in a semirecumbent position during the study. However, they stood-up at hourly intervals, or when necessary, close to the bed in the laboratory to provide samples of urine.
Measurement of ethanol
Blood samples for analysis of venous blood alcohol concentration (VBAC) were taken just before the infusion started, every 5 min for 4 h and thereafter every 15 min up to 6 h. The blood was drawn from the opposite arm of the infusion into 3 ml tubes (Venoject, Terumo Europe, Leuwen, Belgium) containing 45 units of lithium heparin. Specimens were stored at 4 ° C until analysis within 14 days by headspace gas chromatography [17]. The coefficient of variation (CV) was 1.6% at a mean concentration of 0.4 g l−1.
The breath alcohol concentration (BrAC) was measured with a DataMaster infrared analyser (National Patent Analytical Systems Inc. Mansfield, OH, USA) at approximately the same times as the blood samples were obtained. All breath samples were duplicates with the second measurement 60 s after the first. A blood breath partition coefficient of 2,300, which is well supported from previous studies, was used [1, 18–20]. The CV of alcohol analysis in breath was 1.5% at a mean concentration of 0.4 g l−1 for the postinfusion data.
The VBAC and BrAC are reported as g ethanol l−1 of the water-fraction of the blood. The transformation from g ethanol l−1 whole blood was performed to account for the variation in the blood haemoglobin and plasma protein concentrations between the volunteers and for the variation during the experiments due to dilution. For this purpose, the water content of whole blood (w/w) was determined by desiccation of blood samples taken at 0, 30, 90, 180 and 360 min in all experiments. Desiccation was carried out by heating to 105 ° C for 24 h. The CV for this method was 0.1%. The values for water content of the whole blood determined as mass/mass were converted to volume/volume by assuming a density of 1.055 at a mean water content of 80% (w/w) [21] and making a linear correction to a density 1.0 at 100% (w/w).
The total urinary output was determined at each sampling time and the concentration of alcohol was measured by the same method as for VBAC.
Data analysis
Concentration-time data were evaluated by using the WinNonLin Standard 1.5 program (Pharsight SCI, Cary, NC, USA). A two-compartment model with parallel Michaelis-Menten and linear renal elimination kinetics and constant infusion rate (Figure 1) comprising six model parameters was fitted to the experimental concentration-time data. Vmax is the maximum metabolic rate (mg min−1) and Km the ethanol concentration in the water fraction of the blood (mg l−1) which gives 50% of that rate. CLd is the intercompartmental distribution parameter (ml min−1) and could be compared to tissue perfusion. VC is the volume (l) of the central compartment and VT the volume (l) of the tissue compartment. It was possible to add renal clearance CLR (ml min−1) to the model as an updated figure for the urinary output was usually obtained every hour. The following equations were used:
Figure 1.

Two-compartment model for ethanol disposition with parallel Michaelis-Menten and first order renal elimination. C is the concentration in the central compartment as measured in the breath or venous blood and CT is the concentration in the tissue compartment. Ae is the measured cumulative amount of unchanged ethanol excreted to the urine. Vmax is the maximum metabolic rate, Km the concentration that gives 50% of that rate, CLd the intercompartmental clearance, VC and VT the volumes of the two compartments and CLR the renal clearance.
Clearance of ethanol was modelled as a capacity limited function of the concentration
| (1) |
The turnover of ethanol in the central compartment then becomes
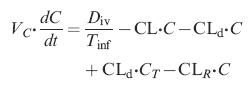 |
(2) |
where the term Div/Tinf is set to zero for t>Tinf. In the peripheral compartment it is
| (3) |
The accumulated amount of ethanol in urine is given by
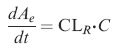 |
(4) |
where CL is the metabolic elimination of ethanol from the body (l min−1), C the ethanol concentration (g l−1) in the central compartment as measured in the breath or venous blood, and CT (g l−1) the concentration in the peripheral compartment. Tinf is the infusion time (min) and Div the given amount of ethanol (g). Ae is the cumulative amount of unchanged ethanol excreted to the urine (g). The CLd term can be converted to micro constants by means of the relationship CLd = k12 · VC = k21 · VT. In addition to the model parameters the volume of distribution at steady state Vss (l) was estimated according to Vss = VC + VT and the ratio Vmax/Km was also calculated and reported.
Elimination of ethanol by breath is less than 1% at the present BrAC levels [1]. At a ventilation of 5 l min−1, an extrapolation based on the present data indicates that about 0.3% of the alcohol load was exhaled. Therefore, this route of elimination was neglected.
Since the ethanol concentration values covered an interval from 0.01 to 1 g l−1 a weighting factor 1/ŷ (where ŷ is the predicted concentration) was applied thus making a robust weighting, less sensitive to outliers. This was confirmed by a graph of time vs the weighted residual, where weighting changed the outcome from a cone shaped pattern to a more randomly distributed form. We discarded the notion to give low values an even higher weight because the error increased when approaching the limit of method sensitivity. Baseline values, obtained before the infusion of ethanol, if other than zero (BrAC n = 5, mean 0.017 g l−1, VBAC n = 11 mean 0.011) were treated as equilibrated throughout the two compartments.
Statistical analysis
The results are presented as mean ± standard deviation (s.d.) whereas differences are given as the mean and 95% confidence interval of the mean (CI). The s.d. for the model parameters in each nonlinear regression were determined by the WinNonLin program. Further statistical analysis was performed using the computer softwares STATISTICA™ 5.1 (StatSoft, Tulsa, OK, USA) and nQuery Advisor® 3.0 (Statistical Solutions Ltd, Cork, Ireland) for power analysis [22].
The within-subject (w), between-subject (b) and between-day (d) mean squares (MS) were derived by two-way anova. The variance components (V) were calculated from the expected MS [23], where subject was treated as a random and day as a fixed effect. The within-subject variance Vw for a single measurement on a new subject from the same population was approximated with the MSw. The between-subject variance Vb = MSb/r is valid if the subject is a sample from an infinite population and r is the number of replicates (days). Vd = (MSd-MSw)/n is the variance that is attributed to the repeat experiments 2 days apart. The corresponding s.d. was calculated as the square root of V. The percent contribution to the total variance for each component was calculated by the sum of squares. Negative variances were set to 0 when the s.d. and percentage contribution to the total variation were calculated.
Differences in parameter estimates were analysed by two-way repeated measures anova with the two repeated factors being site of measurement (BrAC – VBAC) and order of experiment (day 1 – day 3). In the case of significant interaction the factors were analysed separately. Two outliers in the VBAC experiments were not included in this statistical analysis but are discussed separately. P < 0.05 was considered statistically significant.
Results
The consistency was high between observed and predicted data for the proposed model (Figure 2). The individual breath and blood concentration time profiles for both experiments in all 16 subjects showed that the rate of elimination changed to a linear phase on the semilogarithmic plot when the alcohol concentration fell to values about 0.10 g l−1 and lower (Figure 3). The variability was greatest at terminal time points, which can be illustrated by the fact that the CV for BrAC (n = 32) increased from 14% at 60 min to 49% at 240 min. For VBAC data the corresponding values were similar, 14% and 45%, respectively.
Figure 2.

Measured alcohol concentration in expired air (○), venous blood (•) and cumulative amount excreted by the urine (▪) and the predicted concentrations in the central compartment (C) and peripheral compartment (CT) and the predicted cumulative renal excretion (Ae). A two-compartment model with parallel Michaelis-Menten and first order renal elimination was fitted to data from one representative experiment.
Figure 3.

Individual concentration-time profiles of ethanol in expired breath (BrAC) and venous blood (VBAC) after a 30 min intravenous infusion of 0.4 g ethanol kg−1 body weight, n = 32.
The water concentration of the desiccated samples of whole blood was 0.859 ± 0.009 (v/v) The blood-breath partition coefficient was 2272 ± 117 in 28 experiments (1445 blood-breath pairs), during which the mean ethanol concentration was 0.4 g l−1.
Pharmacokinetic analysis
The mean values of Vmax and Km (VBAC) were 95 mg min−1 and 27 mg l−1, respectively (Table 1). The precision of the six parameter estimates for the individual fitted curve was highest for Vmax, with a mean CV of 2% (BrAC) and 4% (VBAC), and lowest for Km, the corresponding CVs being 19 and 40%, respectively. The correlation between the parameters in the regression analysis was high for Vmax and Km (0.96 ± 0.02) and between CLd and VC (−0.80 ± 0.05). All other correlations averaged less than 0.62.
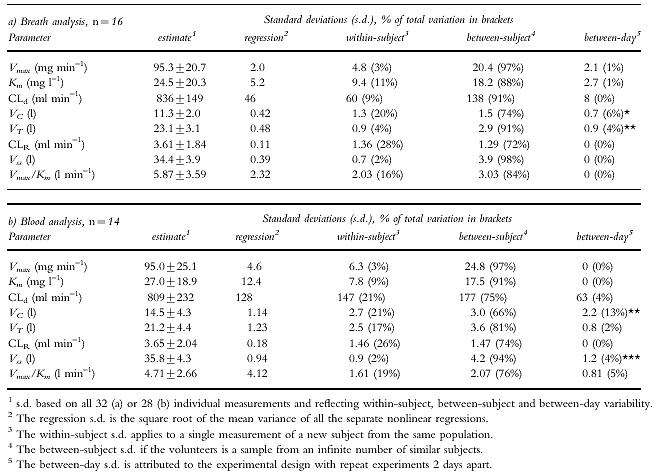
Table 1.
Values (mean± s.d.) and the components of variation derived by two-way anova with day as a fixed and subject as a random effect for the six model parameters and 2 secondary parameters in a two-compartment model with parallel Michaelis-Menten and first order renal elimination, when ethanol 0.4 g kg –1 body weight is given intravenously in repeat experiments. Significance for variance ratios in two-way anova when compared with within-subject mean square given as * P < 0.05, ** P < 0.01 and *** P < 0.001.
The partial derivative of the predicted concentration with respect to each of the model parameters were plotted vs time (Figure 4). This plot enables a graphic presentation of time regions that are ‘information-rich’ with respect to each model parameter. Km was the one parameter most dependent on the terminal measurements.
Figure 4.

Partial derivatives, indicating the relative contribution of various time segments to the parameter estimates, based on a simulation using the mean parameter estimates from BrAC data n = 32. The six model parameters are Vmax (□), Km (○), CLd (▾), VC (▪), VT (▵) and CLR (•).
Components of variation
The mean total variation of the model parameters from both breath and blood analysis was 13–30% for Vmax, CLd, VC and VT and 51–83% for Km and CLR, which can be compared to 12% for the subject’s body weights (Table 1). For all model parameters except CLR the between-subject variation dominated over the within-subject variation. The highest reproducibility was obtained for Vss as indicated by SDw which accounted for only 2% of the total variation in both BrAC- and VBAC-derived parameters. Vmax had also a high reproducibility. There was a significant between-day variability as compared with the within-subject variability for VC and VT in the BrAC derived parameters and for VC and Vss in the parameters derived from VBAC data.
Differences in parameter estimates
The differences in primary kinetic parameters between sample sites and days of measurements were calculated and compared. VC was 21% lower (CI 11–30) and VT 10% higher (5–16) in BrAC as compared with VBAC (Table 2). VC was 15% lower (6–23), VT was 7% higher (1–14) and CLd was 9% higher (3–15) on day 3 than on day 1. The interaction factor was significant P < 0.01 for Vss as there was a day-effect for VBAC but none for BrAC. With 14 subjects the study had 80% power to detect an effect size of 0.81 using a paired t-test with a 0.05 two-sided significance level [22]. That corresponds to a difference in Vmax of 3.2 and 6.0 mg min−1 and in Km 14.4 and 8.6 mg ml−1 for the sample site and order factors, respectively.
Table 2.
Difference in model parameter estimates depending on sampling site and study day analysed by two-way repeated measures anova with two repeated factors. The 95% confidence interval (CI) is given for differences. Significance is given as * P < 0.05 and ** P < 0.01.
| Model parameter | Mean n = 14 | BrAC – VBAC mean difference (CI) | Day 1 – day 3 mean difference (CI) |
|---|---|---|---|
| Vmax (mg min−1) | 95.8 | 1.7 (−1.1–4.5) | 2.3 (−2.0–6.5) |
| Km (mg l−1) | 24.8 | −4.3 (−14.5–6.0) | 4.0 (−2.1–10.1) |
| CLd (ml min−1) | 826 | 34 (−48–117) | −66 (−111– −21)** |
| VC (l) | 12.8 | −3.3 (−5.0– −1.6)** | 2.2 (0.8–3.5)** |
| VT (l) | 22.3 | 2.0 (0.9–3.2)** | −1.4 (−2.6– −0.2)* |
| CLR (ml min−1) | 3.62 | −0.1 (−0.2–0.04) | 0.2 (−1.0–1.3) |
| Vss (l) | 35.1 | −1.2 (−2.2– −0.3)* | 0.8 (0.3–1.2)** |
| Vmax/Km (l min−1) | 5.45 | 1.5 (0.1–2.9)* | −0.8 (−1.6–0.0) |
For the distribution parameters, CLd, VC and VT (Figure 5), the variances were significantly smaller for BrAC than for VBAC (P < 0.01).
Figure 5.

Within-subject variability for three of the model parameters based on analysis of BrAC (○) and VBAC (•). The x-axis is the mean value for day 1 and day 3 and the y-axis is the difference between them. The mean difference and limits of agreement (± 2.16 s.d., n = 14) are shown as solid lines, and line of identity as a broken line.
Renal excretion data
The fraction of the total elimination that could be attributed to renal excretion was 3.8 ± 2.1% at BrAC 1.0 g l−1 and 0.48 ± 0.27% at BrAC 0.1 g l−1. In these experiments 1.52 ± 0.71% of the given dose of ethanol was eliminated by urinary excretion. Nearly all the renally excreted ethanol could be recovered within 2 h of starting the infusion.
The urinary data had little effect on the other parameter estimates. Fitting a two-compartment model without renal excretion and urinary data to the BrAC data significantly increased Vmax by 1.8% (CI 1.3–2.3), VT by 0.9% (0.6–1.2) and Vss by 0.6% (0.4–0.8) and for VBAC data (n = 14) the increases were 1.5% (0.6–2.3) in Vmax, 0.8% (0.1–1.5) in VT and 0.6% (0.3–0.8) in Vss.
Outliers
Results with two female subjects deviated with respect to the VBAC-time profiles (Figure 6) showing very high CV for some of the model parameters in the regression. Poor precision was obtained both in CLd, VC and VT, the distribution parameters, as well as in Km. Fitting a one-compartment model to the VBAC data did not change this fact. Both subjects showed the poorest fit to the proposed model on day 1, but even on day 3 they were still the subjects with the lowest correlation coefficient in the regression. The parallel BrAC data were not distorted. Because comparison of components of variation and differences in parameter estimates is complicated by outliers these 2 subjects were excluded from the statistical analysis.
Figure 6.

Concentration-time profiles of ethanol for two subjects after 0.4 g ethanol kg−1 b.w. was given intravenously over 30 min. In both subjects the modelling failed when VBAC data were used (•) while the profile was normal when BrAC data were studied (○).
Discussion
The present experiments show that a distribution phase exists when ethanol is given as a rapid intravenous infusion, and this supports the use of a multicompartment model when analysing the disposition of ethanol. The dose and the infusion rate were carefully chosen to allow a distinct initial phase to appear without having the volunteers develop symptoms of intoxication such as nausea and vomiting [5, 7, 24]. The intravenous route, which creates a controlled situation with respect to gastric emptying and first pass metabolism, and a frequent sampling schedule allow a more correct analysis of the nonlinear disposition with parallel Michaelis-Menten and first-order renal elimination kinetics.
There was a high consistency between observed and model predicted data, and most parameters could be estimated with high precision in both blood and breath. This is of particular interest for Vss, which might be used as an index of the total body water. The between-subject component of variation dominated over the within-subject in all parameters except CLR, which indicates that the parameter estimates had good quality. We also tried the parallel first-order and Michaelis-Menten elimination without use of urinary data [8], but failed to improve the results further owing to a very small contribution from the first-order component.
Variations between sampling sites
Venous blood sampling reflects not only the kinetics of a compound in the whole body but also the circulation in the particular tissue drained by the sampled vein [25]. Breath data correlates strongly with the arterial blood alcohol concentration [26] and therefore more closely reflects the whole-body process. Thus, VC is overestimated and VT underestimated by data obtained from venous blood as compared with breath data. Our interpretation of Figure 5 is that, even under the controlled conditions of this trial, the local blood flow varied more between days than whole body blood flow. In contrast, we found that elimination of ethanol was unaffected by the site of measurement. This makes sense if there is no elimination in the peripheral tissue.
The females had about 16% lower volumes of distribution (VC, VT and Vss) than the males. Two experiments in the female group of nonsmokers also showed marked deviations between the actual blood data and the proposed model. This phenomenon has been reported previously in a similar subject [27] and we believe that a marked stress-induced vasoconstriction is the most likely explanation. As breath data were apparently unaffected by these problems, one could propose that it is generally superior to venous blood for disposition studies of ethanol in man. On the other hand, one possible shortcoming of that method is that one needs to assume or determine an average blood-breath partition coefficient [28]. By applying a wide range of different partition coefficients to a single breath data set, we found that Km was directly proportional to the partition coefficient, VC, VT, CLd and CLR varied inversely to it, whereas Vmax was unaffected by the chosen value. The CV of the partition coefficient was 5.1% so a similar proportion of the differences in the dependent model parameters between blood and breath can be explained by this variability, which may be due to changes in the whole body or local circulation in the tissues drained by the sampled vein, body temperature or exhalation technique. It is difficult to determine whether the breath or venous blood most accurately reflects the ethanol distribution in the body. If ethanol dilution is to be used as a measure of the total body water, however, the chosen sampling site must be associated with a reasonably small within-subject variation. The present results suggest that breath measurements can be as good as blood in this respect.
Between-day variations
In contrast to the elimination parameters, which differed very little between the study days, the distribution parameters changed appreciably. The higher CLd and lower VC on day 3 probably implies an increased circulation in the peripheral compartment due to vasodilatation. The reason for these differences might be a psychological effect, as the subjects were more familiar with the experimental procedure on day 3, or an altered distribution induced by the first ethanol dose. The two outliers showed more normal curves on day 3.
One of the most important components of the microsomal ethanol oxidizing system (MEOS) is CYP2E1, which can be quickly induced by ethanol in animal experiments [29], even after a single large dose [30]. The lack of difference in Vmax between day 1 and day 3, however, suggests that the induction of MEOS was too small to be detectable in our study.
Renal clearance, CLR
The concentration of ethanol in the urine can be expected to be the same as in the water fraction of the blood at any given time interval provided re-uptake of ethanol from urine to blood is negligible. Therefore, the renal elimination of ethanol was small owing to the low ethanol dose. The quality of the urine data was poorer than for breath and blood owing to fewer samples and a high prevalence of residual urine (n = 5). There was a 10-fold variation in the diuretic response among the subjects with a consequent variation in CLR of the same order. Others have reported a slightly higher fraction of the ethanol dose being excreted in the urine than 1.5% [7, 12], but this can be explained by the fact that they administered a higher dose of ethanol, which theoretically would increase the renal excretion. The renal clearance of 0.23 l h−1 that we report can be compared with 0.16 l h−1 [7] and 0.47 l h−1 [12] found by others. These differences are probably caused by the degree of hydration and the associated differences in urine flow rate; fasting subjects were used in one study (0.16 l h−1) and the other was done after a standard meal (0.47 l h−1).
Previous studies
There are few previous studies dealing with the kinetics of ethanol after intravenous administration. Wilkinson et al. [5] gave a 2 h constant-rate infusion of 0.58 g kg−1 to six fasting male subjects. A one-compartment model with Michaelis-Menten kinetics was all that could be fitted to the data. A two-compartment model with Michaelis-Menten kinetics was first described by Vestal et al. [7], using a model similar to ours but without obtaining useful estimate of Km. Instead, they applied a theoretical Km derived from in vitro studies of human ADH of 0.06 g l−1. They tried to elucidate whether the MEOS contributed to ethanol metabolism but found their data unsatisfactory to answer this question.
Rangno et al. [6] clarified some of the differences between the traditional zero-order model and a two-compartment model with Michaelis-Menten kinetics in eight male subjects. Different doses of ethanol were given to strengthen the model. The subjects had lunch ‘when necessary’ and after the first hour plasma ethanol samples were taken every 30 min, which makes pharmacokinetic curve fitting less precise. No urinary data were collected.
The metabolic elimination of ethanol is a capacity-limited model being characterized by the Michaelis-Menten parameters Vmax and Km. Some difficulties in obtaining accurate estimates of these parameters have been pointed out by Metzler & Tong [31], who even considered this impossible by single dose experiments and claimed that several measurements below Km are needed. In simulation studies they found a high correlation of Vmax and Km. This has been reaffirmed after oral experiments by Wagner et al. [32] who proposed, however, that single dose experiments are sufficient if carefully designed.
The Vmax of 95 mg min−1 we report is approximately 60% of the value obtained by other investigators [5, 6]. The strict fasting condition for the volunteers probably accounts for most of this difference. Eating a meal is known to increase the rate of elimination of ethanol even when the alcohol is given intravenously [33]. Thus, having a meal 1 h post infusion [5] or ‘when necessary’ [6] might distort the disposition of ethanol. On the other hand, Vestal et al. [7] reported a Vmax identical to ours in subjects fasting throughout the sampling period.
We found a Km of 27 mg l−1 whereas most others report about 80 mg l−1 [1, 5]. Some of this difference is probably model dependent – the only group that has previously assessed Km in a two-compartment model with Michaelis-Menten elimination kinetics to the post infusion blood data from 90 min and onwards, which is 50% higher than for the two-compartment model. As Km is more dependent on measurements at low alcohol concentrations than the other parameters, it would also benefit most in precision by an optimal experimental design. Even Vmax increased by 12%, on the average, by the use of a one-compartment model.
Conclusions
The within-subject variation of the parameter estimates reported here is fairly low, which suggests that ethanol dilution analysed by a two-compartment model with parallel Michaelis-Menten and first-order renal elimination may be used as a measure of the total body water. However, comparison with an established marker of the total body water is required to confirm this suggestion. Parameters dervied from the breath-ethanol data were at least as precise as those from blood-ethanol data, which makes the analysis of breath an attractive alternative owing to its noninvasive character.
Acknowledgments
The authors thank research nurse Viveka Gustavsson for helpful assistance in the experimental setting. This study was supported in part by a grant from the Forensic Science Centre, Linköping University, Linköping, Sweden.
References
- 1.Holford NHG. Clinical pharmacokinetics of ethanol. Clin Pharmacokin. 1987;13:273–292. doi: 10.2165/00003088-198713050-00001. [DOI] [PubMed] [Google Scholar]
- 2.Kalant H. Pharmacokinetics of ethanol: absorption, distribution, and elimination. In: Begleiter H, Kissin B, editors. The pharmacology of alcohol and alcohol dependence. New York – Oxford: Oxford University Press; 1996. pp. 15–58. [Google Scholar]
- 3.Widmark EMP. Berlin: Urban und Schwarzenberg; 1932. Die theoretischen Grundlagen und die praktische Verwendbarkeit der gerichtlich-medizinischen Alkoholbestimmung; pp. 1–140. [Google Scholar]
- 4.Lundquist F, Wolthers H. The kinetics of alcohol elimination in man. Acta Pharmacol Toxicol. 1958;14:265–289. doi: 10.1111/j.1600-0773.1958.tb01164.x. [DOI] [PubMed] [Google Scholar]
- 5.Wilkinson PK, Sedman AJ, Sakmar E, Earhart RH, Weidler DJ, Wagner JG. Blood ethanol concentrations during and following constant-rate intravenous infusion of alcohol. Clin Pharmacol Ther. 1976;19:213–223. doi: 10.1002/cpt1976192213. [DOI] [PubMed] [Google Scholar]
- 6.Rangno RE, Kreeft JH, Sitar DS. Ethanol ‘Dose-dependent’ elimination: Michaelis-Menten vs classical kinetic analysis. Br J Clin Pharmacol. 1981;12:667–673. doi: 10.1111/j.1365-2125.1981.tb01287.x. [DOI] [PMC free article] [PubMed] [Google Scholar]
- 7.Vestal RE, McGurie EA, Tobin JD, Andres R, Norris AH, Mezey E. Aging and ethanol metabolism. Clin Pharmacol Ther. 1977;21:343–354. doi: 10.1002/cpt1977213343. [DOI] [PubMed] [Google Scholar]
- 8.Fujimiya T, Yamaoka K, Fukui Y. Parallel first-order and Michaelis-Menten elimination kinetics of ethanol. Respective role of alcohol dehydrogenase (ADH), non-ADH and first-order pathways. J Pharmacol Exp Ther. 1989;249:311–317. [PubMed] [Google Scholar]
- 9.Fujimiya T, Uemura K, Ohbora Y, Komura S. Problems in pharmacokinetic analysis of alcohol disposition: a trial of the Bayesian least-squares method. Alcohol Clin Exp Res. 1996;20:2A–6A. doi: 10.1111/j.1530-0277.1996.tb01717.x. [DOI] [PubMed] [Google Scholar]
- 10.Levitt MD, Levitt DG. The critical role of the rate of ethanol absorption in the interpretation of studies purporting to demonstrate gastric metabolism of ethanol. J Pharmacol Exp Ther. 1994;269:297–304. [PubMed] [Google Scholar]
- 11.Lim Rt Jr, Gentry RT, Ito D, Yokoyama H, Baraona E, Lieber CS. First-pass metabolism of ethanol is predominantly gastric. Alcohol Clin Exp Res. 1993;17:1337–1344. doi: 10.1111/j.1530-0277.1993.tb05250.x. [DOI] [PubMed] [Google Scholar]
- 12.Ammon E, Schäfer C, Hofmann U, Klotz U. Disposition and first-pass metabolism of ethanol in humans: Is it gastric or hepatic and does it depend on gender ? Clin Pharmacol Ther. 1996;59:503–513. doi: 10.1016/S0009-9236(96)90178-2. [DOI] [PubMed] [Google Scholar]
- 13.Roine R, Gentry T, Hernandez-munoz R, Baraona E, Lieber CS. Aspirin increases blood alcohol concentrations in humans after ingestion of ethanol. JAMA. 1990;264:2406–2408. [PubMed] [Google Scholar]
- 14.Amir I, Anwar N, Baraona E, Lieber CS. Ranitidine increases the bioavailability of imbibed alcohol by accelerating gastric emptying. Life Sci. 1996;58:511–518. doi: 10.1016/0024-3205(95)02316-x. [DOI] [PubMed] [Google Scholar]
- 15.Wagner JG. Intrasubject variation in elimination half-lives of drugs which are appreciably metabolized. J Pharmacokinet Biopharm. 1973;1:165–173. doi: 10.1007/BF01059628. [DOI] [PubMed] [Google Scholar]
- 16.Jones AW, Jönsson KÅ. Between-subject and within-subject variations in the pharmacokinetics of ethanol. Br J Clin Pharmacol. 1994;37:427–431. doi: 10.1111/j.1365-2125.1994.tb05709.x. [DOI] [PMC free article] [PubMed] [Google Scholar]
- 17.Jones AW, Schuberth J. Computer-aided headspace gas chromatography applied to blood-alcohol analysis: importance of online process control. J Forensic Sci. 1989;34:1116–1127. [PubMed] [Google Scholar]
- 18.Dubowski KM. The blood/breath ratio of ethanol. Clin Chem. 1979;25:1144. [Google Scholar]
- 19.Emerson VJ, Holleyhead R, Isaacs MD, Fuller NA, Hunt DJ. The measurement of breath alcohol. The laboratory evaluation of substantive breath test equipment and the report of an operational police trial. J Forensic Sci Soc. 1980;20:3–70. doi: 10.1016/s0015-7368(80)71310-5. [DOI] [PubMed] [Google Scholar]
- 20.Gullberg RG. Statistical evaluation and reporting of blood alcohol/breath ratio distribution data. J Anal Toxicol. 1991;15:343–344. doi: 10.1093/jat/15.6.343. [DOI] [PubMed] [Google Scholar]
- 21.Lentner C. 8th. Basel: Ciba-Geigy; Geigy Scientific Tables, volume 1, Units of measurement, body fluids, composition of the body, nutrition. [Google Scholar]
- 22.Elashoff JD. Los Angeles, CA: nQuery Advisor®. Version 3.0 User’s Guide. [Google Scholar]
- 23.Bennett CA, Franklin NL. New York, Wiley: Statistical analysis in chemistry and the chemical industry. [Google Scholar]
- 24.Hahn RG, Norberg Å, Jones AW. Rate of distribution of ethanol into the total body water. Am J Ther. 1995;2:50–56. doi: 10.1097/00045391-199501000-00010. [DOI] [PubMed] [Google Scholar]
- 25.Chiou WL. The phenomenon and rationale of marked dependence of drug concentration on blood sampling site; Implications in pharmacokinetics, pharmacodynamics, toxicology and therapeutics. Clin Pharmacokin. 1989;17:175–199. doi: 10.2165/00003088-198917030-00004. (Part I) and Clin Pharmacokin 1989; 17: 275–290(Part II). [DOI] [PubMed] [Google Scholar]
- 26.Norberg Å, Jones AW, Hahn RG. Pharmacokinetics of ethanol in arterial and venous blood and in end-expired breath during vasoconstriction and vasodilation. Am J Ther. 1995;2:954–961. doi: 10.1097/00045391-199512000-00009. [DOI] [PubMed] [Google Scholar]
- 27.Hahn RG, Jones AW, Norberg Å. Abnormal blood-ethanol profile associated with stress. Clin Chem. 1992;38:1193–1194. [PubMed] [Google Scholar]
- 28.Jones AW. Determination of liquid/air partition coefficients for dilute solutions of ethanol in water, whole blood and plasma. J Anal Toxicol. 1983;7:193–197. doi: 10.1093/jat/7.4.193. [DOI] [PubMed] [Google Scholar]
- 29.Tsutsumi M, Lasker JM, Takahashi T, Lieber CS. In vivo induction of hepatic P4502E1 by ethanol: role of increased enzyme synthesis. Arch Biochem Biophys. 1993;304:209–218. doi: 10.1006/abbi.1993.1341. [DOI] [PubMed] [Google Scholar]
- 30.Wang P-Y, Kaneko T, Tsukada H, Sato A. Dose and route dependency of metabolism and toxicity of chloroform in ethanol-treated rats. Arch Toxicol. 1994;69:18–23. doi: 10.1007/s002040050131. [DOI] [PubMed] [Google Scholar]
- 31.Metzler CM, Tong DDM. Computational problems of compartment models with Michaelis-Menten-type elimination. J Pharm Sci. 1981;70:733–737. doi: 10.1002/jps.2600700706. [DOI] [PubMed] [Google Scholar]
- 32.Wagner JG, Wilkinson PK, Ganes DA. Parameters Vm′ and Km for elimination of alcohol in young male subjects following low doses of alcohol. Alcohol Alcohol. 1989;24:555–564. doi: 10.1093/oxfordjournals.alcalc.a044959. [DOI] [PubMed] [Google Scholar]
- 33.Hahn RG, Norberg Å, Gabrielsson J, Danielsson A, Jones AW. Eating a meal increases the clearance of ethanol given by intravenous infusion. Alcohol Alcohol. 1994;29:673–677. [PubMed] [Google Scholar]