Abstract
Aims
To determine the population pharmacokinetic (PK) parameters of doxorubicin (Dox), etoposide (Eto) and ifosfamide (Ifo) in small cell lung cancer (SCLC) patients, to assess the potential relationship between those parameters and to estimate the impact of individual morphological and biological covariates on patients' PK parameters.
Methods
Twenty-four patients with either SCLC limited to the thorax or extensive SCLC entered the study. All but one received at least two 3 day courses of the standard AVI (Dox 50 mg m−2 day 1, Eto 120 mg m−2 day 1,2,3, Ifo 2000 mg m−2 day 1,2) regimen. Individual blood samples were collected during each course and data on 47 courses were available. Data were analysed with the NONMEM program. Dox, Eto and Ifo plasma concentrations were studied with multicompartment (3, 2 and 2, respectively) models. Inter-individual and interoccasion (course-to-course) variabilities were estimated. The influence of individual covariates (age, sex, stage of the disease, weight, height, body-surface area, serum creatinine, total protein, LDH, ASAT, ALAT, alkaline phosphatase, gamma-GT, bilirubin) on PK parameters was also assessed. Correlations between individual doxorubicin PK parameters of Dox, Eto and Ifo were explored by using Pearson's correlation coefficient.
Results
Multiple data were available for each patient. Dox clearance (CL) and volume of distribution (Vd) were 32.0 l h−1 and 9.3 l (Inter-individual variability: 17.2% and 19.2%). Eto CL (l h−1) and Vd were, respectively, 3.34–0.0083* serum creatinine (µmol l−1) and 6.38 l (interindividual variability: 15.6% and 18.7%). Ifo CL and Vd at day 1 were 5.6 l h−1 and 26.0 l (interindividual variability: 10.1% and 17.2%, respectively). Estimation of course-to-course variability improved the precision of PK models in some cases. No correlation was observed between the respective PK parameters of each drug. Of individual covariates tested, only serum creatinine correlated with Eto CL (r = −0.37, P < 0.001). Self-induction of the metabolism of Ifo was apparent (mean CL increase from day 1 to day 2 : 42%) and individually correlated with the CL value at day 1 (r = −0.61, P < 0.001).
Conclusions
Assessment of potential relationships between individual systemic exposure of chemotherapy and therapeutic endpoints (tumour response, toxicity and survival) will be required to adjust drugs dosages based on individual PK parameters rather than questionable body-surface area. However, all three drugs in the AVI regimen should be monitored simultaneously.
Keywords: doxorubicin, etoposide, ifosfamide, population pharmacokinetics, small cell lung cancer
Introduction
Pharmacokinetic (PK) studies assessing interindividual variability in systemic exposure of anticancer agents have potential interest in highly chemosensitive tumour models, such as small cell lung cancer (SCLC). This tumour is usually observed in men, around 55–60 years old, and has very low long-term cure rates. The best 5 year overall survival rates are obtained in patients whose disease is limited to the thorax and rarely exceed 20–25%. Such poor therapeutic results are in contrast with chemotherapy induction response rates of more than 75%. Only patients with complete response are likely to have prolonged survival. In this tumour type, massive and rapid eradication of tumour cells seems to be necessary, to avoid onset of drug resistance. The role of induction chemotherapy is therefore paramount. Alkylating agents, anthracyclins, podophyllotoxins and platinum compounds are the most active and widely used drugs [1, 2]. However, interindividual pharmacokinetic variability of anticancer agents is well-known. Despite this, drug doses are still calculated by body-surface area, possibly contributing to the unpredictability in clinical outcome. Some studies have shown a lack of relationship between plasma concentrations of cytotoxics and body-surface area. This could result in patients being undertreated or exposed to unacceptable toxicities [3].
Dose-intensive regimens have failed to show evident superiority to standard chemotherapy regimens, although some studies have suggested a dose-effect relationship for some cytotoxic agents [2]. Such clinical variability could be readily studied by measuring drug concentrations and calculating the area under the plasma concentration-vs-time curve (AUC), which could be better correlated with cytotoxic effect than the injected dose itself. High variations in PK parameters have been described for all major anticancer drugs: three to tenfold interindividual variations in systemic exposure have been reported, even in patients without renal or liver failure or other metabolic dysfunction [3]. Pharmacokinetic studies appear to be the first step in the assessment of PK-PD relationships, necessary for therapeutic drug monitoring. In this first step, plasma concentrations are measured in a population of patients for whom the PK parameters (mainly CL, Vd and AUC) are calculated. Developments in population pharmacokinetic software using Bayesian methodology allow the investigator to estimate PK parameters for some drugs with good precision, with limited sampling strategies [4, 5]. Inter-individual and intraindividual course-to-course variability as well as the influence of clinical and biological covariates (e.g. weight, body-surface area, serum creatinine) on PK parameters can easily be assessed. Few published PK data referring to polychemotherapy are available, probably because such studies are labour intensive and require patients' and nurses' constant collaboration. Standard CMF (cyclophosphamide, methotrexate, 5-fluorouracil) and FEC (5-fluorouracil, epirubicin, cyclophosphamide) regimens have been extensively studied [6, 7]. We report herein the population PK parameters of doxorubicin, etoposide and ifosfamide (the standard AVI regimen in SCLC patients) estimated using the NONMEM program, as well as the relationships between those parameters and the available individual clinical and biological covariates.
Methods
Patients
Twenty-four patients receiving the AVI regimen entered the study. All gave written informed consent and the study was approved by the Ethics Committee at Lyon University Hospital. These patients were treated for SCLC, either limited to the thorax or metastatic. In each patient, liver and kidney function reflected by ASAT, ALAT, alkaline phosphatase, total bilirubin and serum creatinine, were studied. No severe abnormalities (i.e. clinically significant) were noted. LDH and total protein values were also collected. Values for the overall population of patients are shown in Table 1. In one patient we noted abnormal values of liver enzymes (ALAT, ASAT, alkaline phosphatases and gamma-GT: the maximal values reported in the Table 1) but without any clinical impairment of liver function. Some patients had elevated LDH values reflecting the usually observed turn-over of tumour cells. All patients received at least two courses of AVI, except one who experienced febrile neutropaenia and severe infection which led to treatment discontinuation after the first course. The treatment schedule was day 1: doxorubicin 50 mg m−2 (15 min i.v. infusion), ifosfamide 2000 mg m−2 (2 h i.v. infusion), etoposide 120 mg m−2 (30 min i.v. infusion); day 2: ifosfamide 2000 mg m−2, etoposide 120 mg m−2; day 3: etoposide 120 mg m−2. No dose reduction was performed. Drugs were delivered by electronic pump (IVAC® Corporation, San Diego, California, USA) with constant dose rate. The following antiemetic treatment was given from day 1 to day 3: ondansetron 8 mg day −1+ methylprednisolone 120 mg day−1. A total of 47 courses of chemotherapy was studied.
Table 1.
Patients' morphological and biological characteristics.
| Median | Min | Max | |
|---|---|---|---|
| Age (years) | 57 | 45 | 70 |
| Weight (kg) | 69 | 54 | 93 |
| Height (cm) | 170 | 159 | 179 |
| BSA (m2) | 1.79 | 1.54 | 2.10 |
| Serum creatinine (µmol l−1) | 82 | 44 | 144 |
| ASAT (IU l−1) | 29.5 | 9 | 152 |
| ALAT (IU l−1) | 28.5 | 3 | 222 |
| ALKP (IU l−1) | 102.5 | 28 | 869 |
| GGT (IU l−1) | 67 | 21 | 374 |
| BILI (µmol l−1) | 8.5 | 5 | 16 |
| LDH (IU l−1) | 557.5 | 277 | 2524 |
| PR (g l−1) | 70 | 56 | 79 |
ASAT: Aspartate aminotransferase. ALAT: Alanine aminotransferase. ALKP: Alkaline phosphatase. GGT: Gamma glutamyltransferase. BILI: Total bilirubin. LDH: Lactate dehydrogenase PR: Total protein. Normal values: Creat 40–100, ASAT < 40, ALAT < 45, ALKP < 110, GGT < 40, Bili < 20, LDH < 280, PR 60–75.
Plasma samples
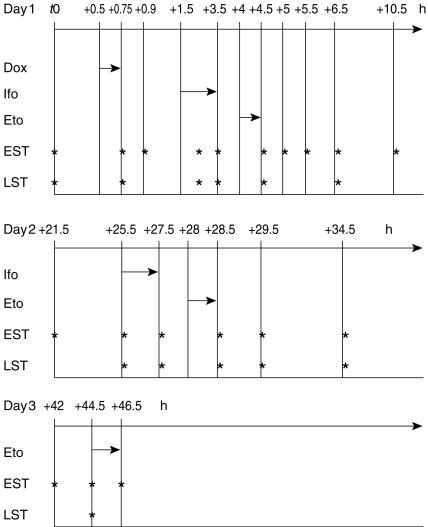
In the first seven patients, 19 plasma samples were obtained from each course. From then on, a Bayesian estimation based on the d-optimality criterion allowed the use of an optimal sampling strategy and this enabled us to further reduce the number of blood samples to 10 per course. Extensive and limited sampling times are shown in Figure 1. Doxorubicin was assayed at the end of infusion, then + 10 min, + 1 h 45, + 2 h 45, + 3 h 45, + 4 h 15, + 4 h 45, + 5 h 45, + 9 h 45, + 20 h 45, + 24h 45, + 26 h 45, + 27 h 45, + 28 h 45, + 33 h 45, + 41 h 15, + 43 h 45 and + 45 h 45 in the extensive sampling strategy. In the limited sampling strategy, it was assayed at the end of infusion, then + 1 h 45, + 2 h 45, + 3 h 45, + 5 h 45, + 24h 45, + 26 h 45, + 28 h 45 and + 43 h 45. Ifosfamide was assayed at the middle of day 1-infusion, then at the end of day 1 infusion, then + 1 h, + 1 h 30, + 2 h, + 3 h, + 7 h, + 18 h; at the beginning and at the end of day 2 infusion, then + 1 h, + 2 h, + 7 h, + 14 h 30, + 17 h, and + 19 h in the extensive sampling strategy. In the limited sampling strategy, it was assayed at the middle and at the end of day 1 infusion, then + 1 h, + 3 h; at the beginning and at the end of day 2 infusion, then + 1 h, + 2 h, + 7 h and + 17 h. Etoposide was assayed at the end of day 1-infusion, then + 30 min, + 1 h, + 2 h, + 6 h, + 17 h, + 21 h, + 23 h; at the end of day 2 infusion, then + 1 h, + 6 h, + 13 h 30; at the beginning and at the end of day 3 infusion in the extensive sampling strategy. In the limited sampling strategy, it was assayed at the end of day 1 infusion, then + 2 h, + 21 h, + 23 h; at the end of day 2 infusion, then + 1 h, + 6 h and at the beginning of day 3 infusion.
Figure 1.
Extensive and limited sampling strategies. t0 = first blood sample (before treatment). Values indicate time of sampling and length of infusions (h). Dox: Doxorubicin. Ifo: Ifosfamide. Eto: Etoposide. EST: extensive sampling strategy. LST: limited sampling strategy.
The total volume of blood per sample was 6 ml. All samples were collected in lithium heparin-coated Vacutainer® tubes (Becton-Dickinson, Plymouth, United Kingdom) and immediately centrifuged at 3 °C to obtain plasma. Plasma was frozen at −20 °C pending drugs assay (always within 1 week after sampling). Doxorubicin, etoposide and ifosfamide were assayed in each plasma sample.
Plasma drugs assays
Doxorubicin and etoposide concentrations were determined by high-performance liquid chromatography (h.p.l.c.) using isocratic conditions; the h.p.l.c. apparatus comprised a Wisp® 715 autoinjector (Waters®), a model 510 pump (Waters®), and either a u.v. 486 detector (Waters®) or a fluorescence detector (Hitachi 1050®). The detector responses were recorded and integrated on a workstation with Millennium® software (Waters®). Ifosfamide levels were determined by gas chromatography (GC) by means of a model 5890 A Series II (Hewlett-Packard®) equipped with a 7673-A injector and a nitrogen-phosphorus detector (NPD). The resulting chromatograms were recorded and integrated with a Vectra computer by means of the Chemlan® software (Hewlett-Packard®).
Doxorubicin
Doxorubicin was assayed by h.p.l.c. [8] after extraction of 500 µl plasma by 3 ml dichloromethane, using daunorubicin as internal standard (IS). The organic extract was then dried under nitrogen, and the residue was reconstituted with 200 µl of the mobile phase (acetonitrile:ammonium formate 32 : 68 plus 1% THF). The stationary phase was a Spherisorb® phenyl column, 25 cm, 4 mm i.d and the injected volume was 50 µl. A flow rate of 0.8 ml min−1 was used, and the fluorescence of the effluent was monitored with excitation and emission wavelengths set at 480 and 590 nm, respectively. The limit of quantification (LOQ) of the assay was 2.5 ng ml−1. The method was linear from 2.5 to 400 ng ml−1, the coefficients of variation (CVs) on the measurements ranging from 9 to 4%.
Etoposide
Etoposide was assayed by h.p.l.c. [9, 10] after extraction of 500 µl plasma by 3 ml dichloromethane, using teniposide as IS. Resulting organic extracts were dried under nitrogen, reconstituted with 200 µl of the mobile phase (acetonitrile:water 25 : 75) and 20 µl injected onto the chromatograph. The stationary phase used was a C18 LichroCart® cartridge, 12.5 cm, 4.6 mm i.d., 5 µm, eluted at 1 ml min−1. The u.v. detection was set at 285 nm, and the LOQ of the assay was 150 ng ml−1 with a linear range of measurement from 50 to 10000 ng ml−1. The corresponding CVs were from 10.2 to 3.5% within this range.
Ifosfamide
Ifosfamide was assayed by gas chromatography (GC) [11] after extraction of 200 µl plasma by 800 µl of a mixture of octanol:acetone:dichloromethane (2 : 1 : 1) and using trofosfamide as IS; the resulting extract was injected directly onto the GC apparatus with a split of 1 : 40. The capillary column was HP5, 30 m, 0.25 mm i.d. A temperature gradient from 200 to 255 °C was used for separation of ifosfamide and its dechloro metabolites, and the IS. The LOQ of the assay was 0.5 µg ml−1 with a CV of 10%. The linearity of the method ranged from 0.5 to 30 µg ml−1, CVs ranging from 10 to 3.1%.
Data analysis
The NONMEM program (nonlinear mixed effect model, University of California, USA) [12] version V with Fortran MS Powerstation® 4.0 was used to analyse concentration-time data with a first-order method. This program allows simultaneous estimation of fixed effects: population PK parameters (mainly clearance (CL) and volume of distribution (Vd)) and random effects: interindividual and course-to-course interoccasion variabilities as well as intraindividual residual variability due to assay errors and model misspecifications. More detailed descriptions of this widely used methodology have been reported elsewhere [12–14]. During the NONMEM estimation, parameterization involved CL, Vd and transfer rate constants. As previously described in the literature, doxorubicin and etoposide concentrations were studied using three and two compartment pharmacokinetic models, respectively. For ifosfamide concentrations, one and two compartment models were tested. The model used to estimate interpatient variability was exponential for each drug. Inter-occasion (course-to-course) variability was assessed in a proportional model. A mixed (proportional and additive) model was used to estimate the residual error for doxorubicin and ifosfamide, while a proportional model was used for etoposide. An extensive graphical analysis of predicted vs observed concentrations was performed to test the value of each model. The search was also guided by looking at the differences between the objective functions given by NONMEM. When a model can be reduced to a simpler one by fixing some parameters to a given value (e.g. 0), the difference between the two NONMEM objective functions is approximately distributed according to a χ2 with n degrees of freedom, n equal to the number of fixed parameters [12].
In a second step, the main individual covariates (age, sex, height, weight, body-surface area, stage of the disease, serum creatinine, ASAT, ALAT, alkaline phosphatase, total bilirubin, LDH, total protein) collected were tested to estimate their impact on PK parameters. A covariate entered the model when it demonstrated significant correlation with CL or Vd (P < 0.05). Pearson's correlation coefficient was used to explore potential correlations between individual covariates and the PK parameters of doxorubicin, etoposide and ifosfamide (P < 0.05). We looked for correlations between the PK parameters (CL, Vd) of the three studied drugs by the same exploratory mean. Moreover, we performed a Generalized Additive Modelling (GAM) with the S-plus® software, in order to investigate nonlinear correlations.
When a covariate demonstrated significant relationship with any PK parameter, it was introduced into the model describing the fixed effects. The covariate was kept in the model only if a significant decrease in the NONMEM objective function was obtained (P < 0.05).
Results
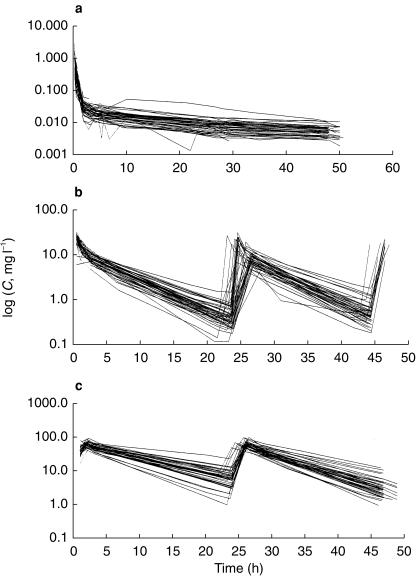
Concentration data were available for the three drugs in 47 cycles and 24 patients (Figure 2).
Figure 2.
Observed concentrations (C) of doxorubicin (a), etoposide (b) and ifosfamide (c). y axis: logarithmic scale (semilog plot).
Table 2 summarizes the results which are detailed below.
Table 2.
Parameter estimates of population pharmacokinetic models.
| Drug | CL (l h−1) | Vd (l) | ωCL | ωVd | σ |
|---|---|---|---|---|---|
| Doxorubicin | 54.0 | 9.3 | 0.0296 | 0.0369 | 0.0140 |
| s.d.: 4.96 | s.d.:0.970 | s.d.:0.0012 | s.d.:0.0020 | 0.0015 s.d.:0.0085 | |
| Etoposide | 3.34–0.0083*SCr | 6.4 | 0.0243 | 0.0350 | 0.0576 |
| s.d.:0.228 | s.d.:0.863 | s.d.:0.0107 | s.d.:0.0128 | s.d.:0.0213 | |
| Ifosfamide | Day 1 : 5.6 | 26.0 | 0.0100 | 0.0296 | 0.0042 |
| s.d.:0.330 | s.d.:0 4.49 | s.d.:0.0044 | s.d.:0.0084 | 0.2100 | |
| Day 2 : 7.95 | s.d.:0.0043 | ||||
| s.d.:0.450 |
CL: Clearance. Vd: Volume of distribution. SCr: Serum creatinine (µmol l−1).
Doxorubicin
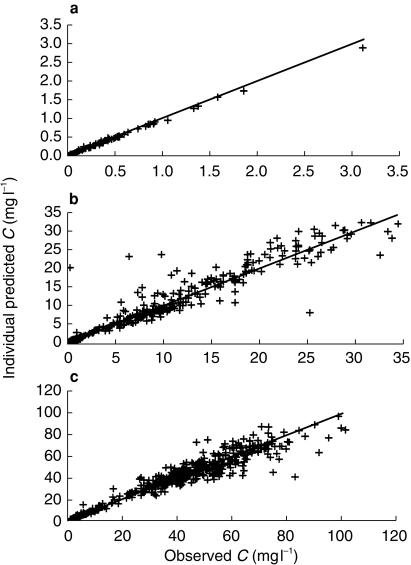
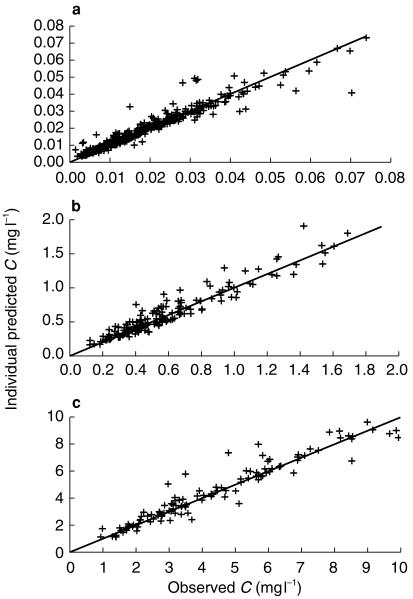
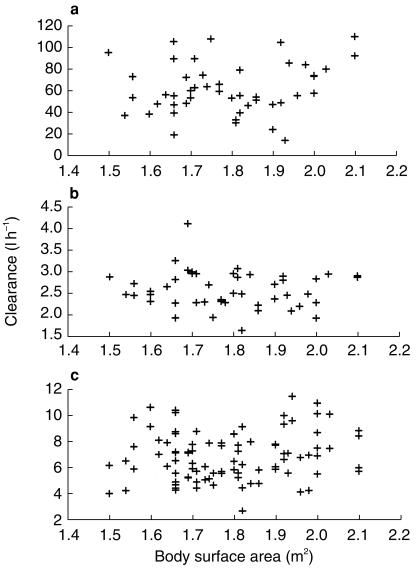
Concentration vs time curves for doxorubicin were best described by a three-compartment model with linear elimination (Figure 3a, 4a). Population estimated CL and Vd were 54.0 l h−1 and 9.3 l, respectively. Inter-individual variability was 17.2% for CL and 19.2% for Vd. Inter-occasion variability was 16% for CL and its estimation for Vd did not significantly change the goodness of fit. Among the covariates which were tested, none demonstrated significant impact on individual PK profiles of doxorubicin (CL, Vd and AUC). Figure 5a shows the lack of relationship between individual doxorubicin CL and body-surface area. No liver biological parameters (ALAT, ASAT, alkaline phosphatase, gamma-GT and total bilirubin) had any significant impact.
Figure 3.
Individual predicted vs observed plasma concentrations of doxorubicin (a), etoposide (b) and ifosfamide (c).
Figure 4.
Individual predicted vs observed plasma concentrations of doxorubicin (a), etoposide (b) and ifosfamide (c): quality of the fit for the lower concentration values.
Figure 5.
Doxorubicin (a), etoposide (b), and ifosfamide (c) clearance vs body surface area.
Etoposide
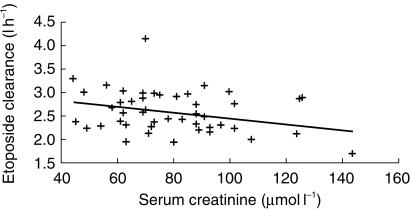
The best model describing plasma concentrations vs time was a two-compartment model with linear elimination (Figures 3b, 4b). Individual clinical covariates such as age, height, weight, body-surface area and stage of the disease had no influence on PK parameters. Figure 5b shows the lack of relationship between etoposide CL and body-surface area. Among biological covariates, CL correlated with serum creatinine (SCr, µmol l−1) (r = −0.37) (Figure 6). It was incorporated into the model in a linear fashion and we obtained a gain of 12 points in the NONMEM objective function. Population estimated CL was:
Figure 6.
Correlation between etoposide clearance and baseline serum creatinine. . Serum creatinine is given in µmol l−1.
The Vd value was 6.38 l. Inter-individual variability was 15.6% for CL and 18.7% for Vd. Inter-occasion variability was 12% for CL and its estimation for Vd did not significantly change the goodness of fit.
Ifosfamide
Concentration vs time curve was best described by a two compartment model with linear elimination (Figure 3c, 4c). However, descriptive curves clearly indicated that systemic exposure (AUC) at day 2 was lower than at day 1 in each patient. This suggested that ifosfamide CL increased from day 1 to day 2, since the injected dose was the same. We therefore tested the goodness of the data fit in various models with NONMEM, either with the same parameter for describing CL both at day 1 and day 2, or with two different parameters. The best model to predict ifosfamide concentrations was a two compartment model with linear elimination, but with the estimation of two different values of CL at day 1 and day 2.
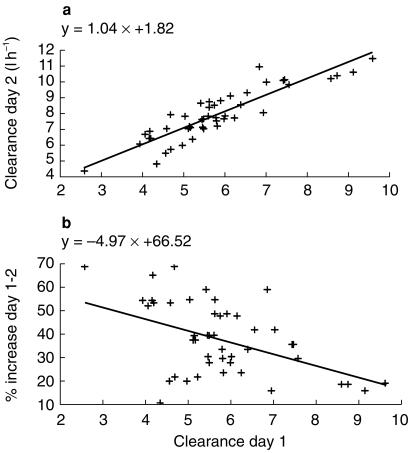
Estimated ifosfamide CL at day 1 was 5.6 l h−1 and Vd was 26 l. At day 2, the percentage increase in CL was 42% (Figure 7a). Inter-individual variability was 10.2% for CL and 17.1% for Vd. The estimation of interoccasion variability did not allow us to improve the quality of the model. A significant correlation was found between ifosfamide CL at day 1 and its increase at day 2 (metabolic induction): the lower the initial value of the clearance, the higher its percentage of increase at day 2 (r = −0.61, P < 001) (Figure 7b).
Figure 7.
Metabolic induction of ifosfamide clearance from day 1 to day 2 (a) and percentage of increase as a function of ifosfamide clearance at day 1 (b).
No correlation was found between ifosfamide CL and Vd and patients' covariates. Figure 5c shows the lack of relationship between individual CL and body-surface area.
Investigated correlations between PK parameters
No correlations were observed between the respective individual PK parameters of the three studied drugs.
Systemic exposure
Plasma systemic exposures defined by doxorubicin, etoposide and ifosfamide AUCs obtained with the posthoc option of NONMEM and their standard errors are reported for each course in Table 3.
Table 3.
Doxorubicin, etoposide and ifosfamide systemic exposure (AUC at day 1) at cycles 1 and 2 (n = 24 patients; 47 cycles).
| AUC Cycle 1, day1 (mg l−1 h) | AUC Cycle 2, day1 (mg l−1 h) | |||||||
|---|---|---|---|---|---|---|---|---|
| Mean | s.d. | Min | Max | Mean | s.d. | Min | Max | |
| Dox | 1.66 | 0.68 | 0.89 | 6.98 | 1.63 | 0.56 | 0.75 | 2.75 |
| Eto | 94.67 | 19.72 | 44.61 | 122.35 | 88.48 | 23.83 | 57.65 | 142.05 |
| Ifo | 603.63 | 145.21 | 324.41 | 808.56 | 680.85 | 257.73 | 285.97 | 1489.90 |
Dox: Doxorubicin. Eto: Etoposide. Ifo: Ifosfamide.
Discussion
During the last 10 years the concept of therapeutic drug monitoring has emerged, supported by advances in population pharmacokinetics. As a first step, descriptive PK studies allow individual PK parameters as well as their variability to be estimated. Population pharmacokinetics and Bayesian methodology enables the investigator to estimate these parameters with acceptable precision even with a limited sampling strategy, considerably reducing patient discomfort and labour intensity and therefore makes PK studies easier to perform [15].
However, many clinicians are sceptical about such methodology, which can appear cumbersome, without evidence of demonstrated benefit. Some studies have demonstrated the value of pharmacokinetically adjusted drug-regimens with the single agents carboplatin and 5-fluorouracil [16, 17]. In these studies, such chemotherapy regimens have shown advantages over standard treatments which were adapted to body-surface area. In this perspective, our study represents the first step in the above-described methodology.
Doxorubicin has a plasma clearance of 52 l h−1, demonstrating three elimination phases and a terminal half-life of approximately 30 h [8]. These results are close to those reported in our study. The main PK parameters of etoposide usually range from 10 to 50 l for volume of distribution and around 10–18 l h−1 for clearance [9, 18]. These values are somewhat higher than those obtained in our study. Concerning ifosfamide, previously reported plasma clearance was 4.3 l h−1[19]. In our study, estimated clearance was slightly higher but the volume of distribution was similar. Some of the observed differences could be at least partly due the small number of patients included both in our study and in previous work. Moreover, the doubtful validity of a comparison between descriptive PK parameters in different population PK studies should be taken into account.
Patient number 3 had very unexpected doxorubicin concentrations, in spite of repeated and verified assays. This patient had normal renal and liver function. Sampling schedule was respected and no other concomitant treatment other than antiemetics (given to all patients) had been simultaneously prescribed. Inter-individual variability in plasma systemic exposure (AUC) to doxorubicin, etoposide and ifosfamide, given by the ratio s.d./mean is 20–40%, is clinically significant and consistent with the previously reported data about PK variability with anticancer agents [15, 20]. Few data are available on such variability during polychemotherapy regimens. Moreover, since CMF and FEC regimens have previously been studied, none of the component drugs of these regimens can be directly compared with those of an AVI regimen. However in the study of the FEC regimen, interpatient variability in epirubicin clearance – a doxorubicin analogue – was 22% [7]. Variability in etoposide clearance estimated with NONMEM on pooled data from monochemotherapy and polychemotherapy regimens was 26–32% [18]. Intra-patient variability from the first to the second course was not negligible and its estimation often improved the quality of the prediction, as previously reported [14].
The lack of relationship between individual morphological covariates such as body surface area and PK parameters casts doubt on the use of body surface area as a key parameter for dose calculation [21]. Among biological parameters, ALAT, ASAT, alkaline phosphatase and bilirubin values had no significant influence on doxorubicin PK parameters. Such an observation has already been reported in a study of epirubicin, where only liver function tests were predictive of epirubicin clearance [20]. It appears that liver enzymes do not appropriately reflect liver function: cholestasis may be a predictive factor of haematological toxicity for drugs which are excreted through the biliary tract, but elevation of transaminases is not predictive of hepato-cellular insufficiency. Moreover, most of our patients were included in therapeutic trials. In these trials, patients with highly abnormal biological values (e.g. liver enzymes: ASAT, ALAT, alkaline phosphatase > 2 N and/or creatininemia > 1.5 N) were not eligible. The patient with maximal values of ASAT, ALAT, alkaline phosphatase and gamma-GT, was not included in a prospective trial. The PK parameters of this patient were close to the mean of the population.
In contrast, serum creatinine correlated well with etoposide clearance. In a population study on etoposide, serum creatinine was also a significant covariate [18].
Self-induction of ifosfamide metabolism is observed from day 1 to day 2, since clearance increases by more than 40% of its initial value. Moreover, the level of increase strongly depends on ifosfamide clearance on day 1: the lower its value, the higher was the increase on day 2. Clearance induction cannot be predicted by liver enzymes values. Ifosfamide is a pro-drug with several metabolites of which few have alkylating activity, such as isophosphoramid-mustard and 4-hydroxy-ifosfamide. The lack of data on ifosfamide metabolites in our study precludes demonstration of a relationship between ifosfamide pharmacokinetics and clinical outcome, unless limited to those of the parent compound itself. Dechloro-metabolites are usually inactive but might relate to the neurotoxicity of the drug, while acrolein is responsible for vesical toxicity. Due to this complex metabolism, the phenomenon of self-induction of total ifosfamide clearance has limited clinical impact. Nevertheless, it has been reported after continuous infusion or repeated administrations, e.g. on 3–5 consecutive days [19]. It was also described with shorter infusions, as in this study [22–24] but these studies did not include models which structurally incorporated auto-induction. Very low correlation coefficients demonstrate the lack of relationship between the main PK parameters of the three component drugs of the AVI regimen. These must be studied independently: the PK profile of a given drug cannot be predicted from that of another drug. These drugs are metabolized through different pathways: ifosfamide metabolism depends on cytochrome P 450 enzymes and hence on liver function and some metabolites undergo urinary elimination; doxorubicin produces reduced metabolites after enzymatic activation (deshydrogenases) and has biliary excretion; etoposide is eliminated through the kidney but also has a significant enterohepatic recirculation [9].
Under those circumstances, some difficulties arise when investigating optimal systemic exposure of chemotherapy in SCLC. Several PK parameters must be taken into account when studying polychemotherapy regimens. Thus, the assessment of PK-PD relationships requires more sophisticated statistical models and a greater number of patients to reach an acceptable level of significance. If there is evidence for such relationships more than one drug will have to be simultaneously monitored. Limited sampling strategy allows the investigators to reduce the number of blood samples per patient to 3 or 4 per course for a given drug. Although course-to-course variability is low, it is not totally negligible and should be taken into account since individual chemotherapy dosages should be adjusted for PK parameters. Such dose adaptation should be performed at the beginning of chemotherapy, since the importance of induction treatment in SCLC has been emphasised. Drug dosage could be ‘targeted’ at the beginning of the second course or even during the first course by using a test dose, a very low dose of cytotoxic agent with no significant therapeutic activity, injected for example, the day before the beginning of the chemotherapy course. A patient's PK parameters might therefore be determined and this would enable the investigator to perform individual dose-adjustment. Such methodology implies stationarity and linearity of PK parameters in each patient: these parameters should not change between the test dose and the therapeutic dose. Doxorubicin and etoposide have linear pharmacokinetics but the successful use of a test dose with these drugs has not been reported. In contrast, this study clearly shows that ifosfamide has nonlinear kinetics. Moreover, the test dose methodology requires the availability of immediate drug assays as well as data analysis.
If drug dosage can be successfully adapted by means of real-time pharmacokinetics, the efficacy of adapted chemotherapy regimens must be compared with that of standard regimens in randomized trials.
This study confirms the relatively high interindividual variability of PK parameters of the three cytotoxic agents studied. In polychemotherapy regimens such as AVI, used in this study for the treatment of SCLC patients, PK variability should be assessed for each component drug, since correlation between plasma concentrations of different anticancer agents were not observed. Further investigations are necessary to demonstrate the potential relationship between patient pharmacokinetic parameters and therapeutic endpoints such as tumour response and survival. Such a relationship could lead to adjustment of the initial doses of cytotoxic agents by a more precise method than the use of body surface area. Therapeutic drug monitoring could then improve the efficacy of induction chemotherapy in small cell lung cancer.
References
- 1.Johnson DH, Einhorn LH, Birch R, et al. A randomized comparison of high-dose versus standard-dose cyclophosphamide, doxorubicin and vincristin for extensive small-cell lung cancer. A phase III trial of the Southern Cancer Study Group. J Clin Oncol. 1987;11:1731–1738. doi: 10.1200/JCO.1987.5.11.1731. [DOI] [PubMed] [Google Scholar]
- 2.Trillet Lenoir V, Mornex F, Chauvin F, et al. Limited disease small cell lung cancer: alternating combination of doxorubicin, etoposide, ifosfamide and hyperfractionated radiotherapy. Final results of a multicentric pilot study for the Groupe Lyonnais d'Oncologie Thoracique (GLOT) Lung Cancer. 1993;10:35–45. doi: 10.1016/0169-5002(93)90307-j. [DOI] [PubMed] [Google Scholar]
- 3.Freyer G, Ligneau B, Tranchand B, et al. Pharmacokinetic studies in cancer chemotherapy: usefulness in clinical practice. Cancer Treat Rev. 1997;23:153–169. doi: 10.1016/s0305-7372(97)90036-0. [DOI] [PubMed] [Google Scholar]
- 4.Launay MC, Milano G, Iliadis A, Frenay M, Namer N. A limited sampling procedure for estimating adriamycin pharmacokinetics in cancer patients. Br J Cancer. 1989;60:89–92. doi: 10.1038/bjc.1989.226. [DOI] [PMC free article] [PubMed] [Google Scholar]
- 5.Ratain MJ, Robert J, Van Der Vijgh WJF. Limited sampling models for doxorubicin pharmacokinetics. J Clin Oncol. 1991;9:871–876. doi: 10.1200/JCO.1991.9.5.871. [DOI] [PubMed] [Google Scholar]
- 6.Moore MJ, Erlichman C, Thiessen JJ, et al. Variability in the pharmacokinetics of cyclophosphamide, methotrexate and 5-fluorouracil in women receiving adjuvant treatment for breast cancer. Cancer Chemother Pharmacol. 1994;33:472–476. doi: 10.1007/BF00686503. 10.1007/s002800050085. [DOI] [PubMed] [Google Scholar]
- 7.Sandström M, Freijs A, Larsson R, et al. Lack of relationship between systemic exposure for the component drugs of the fluorouracil, epirubicin, and 4-hydroxycyclophosphamide regimen in breast cancer patients. J Clin Oncol. 1996;14:1581–1588. doi: 10.1200/JCO.1996.14.5.1581. [DOI] [PubMed] [Google Scholar]
- 8.Speth PAJ, Van Hoesel QGCM, Haanen C. Clinical pharmacokinetics of doxorubicin. Clin Pharmacokinet. 1988;15:15–31. doi: 10.2165/00003088-198815010-00002. [DOI] [PubMed] [Google Scholar]
- 9.Henwood JM, Brogden RN. Etoposide. A review of its pharmacodynamic and pharmacokinetic properties and therapeutic potential in combination chemotherapy of cancer. Drugs. 1990;39:238–290. doi: 10.2165/00003495-199039030-00008. [DOI] [PubMed] [Google Scholar]
- 10.Sinkule JA, Evans WE. High performance liquid chromatographic analysis of the semi-synthetic epipodophyllotoxins teniposide and etoposide using electro-chemical detection. J Pharm Sci. 1984;73:164–168. doi: 10.1002/jps.2600730207. [DOI] [PubMed] [Google Scholar]
- 11.Tahla MRZ, Rogers HJ. Rapid gas chromatographic determination of ifosfamide in biological fluids. J Chromatogr. 1984;311:194–198. doi: 10.1016/s0378-4347(00)84709-x. [DOI] [PubMed] [Google Scholar]
- 12.Beal SL, Sheiner LB. NONMEM Users Guides. San Francisco, CA: NONMEM Project Group, University of California.; 1992. [Google Scholar]
- 13.Sheiner LB, Grasela Th., Jr An introduction to mixed effects modeling: Concepts, definitions and justification. J Pharmacokinet Biopharm. 1991;19(Suppl 3):11S–24S. [Google Scholar]
- 14.Karlsson MO, Sheiner LB. The importance of modeling inter-occasion variability in population pharmacokinetic analyses. J Pharmacokin Biopharm. 1993;21:735–750. doi: 10.1007/BF01113502. [DOI] [PubMed] [Google Scholar]
- 15.Paalzow L. Therapeutic drug monitoring of anticancer drugs. In: Domellöf L Berlin., editor. Drug Delivery in Cancer Treatment III. Germany: Springer-Verlag; 1990. pp. 85–96. [Google Scholar]
- 16.Chatelut E, Canal P, Brunner V, et al. Prediction of carboplatin clearance from standard morphological and biological patients characteristics. J Natl Cancer Inst. 1995;87:573–580. doi: 10.1093/jnci/87.8.573. [DOI] [PubMed] [Google Scholar]
- 17.Santini J, Milano G, Thyss A, et al. 5-FU therapeutic monitoring with dose adjustment leads to an improved therapeutic index in head and neck cancer. Br J Cancer. 1989;59:287–290. doi: 10.1038/bjc.1989.59. [DOI] [PMC free article] [PubMed] [Google Scholar]
- 18.Nguyen L, Chatelut E, Chevreau C, et al. Population pharmacokinetics of total and unbound Etoposide. Cancer Chemother Pharmacol. 1998;41:125–132. doi: 10.1007/s002800050718. 10.1007/s002800050718. [DOI] [PubMed] [Google Scholar]
- 19.Wagner T. Ifosfamide clinical pharmacokinetics. Clin Pharmacokinet. 1994;26:439–456. doi: 10.2165/00003088-199426060-00003. [DOI] [PubMed] [Google Scholar]
- 20.Gurney HP, Ackland S, Gebski V, Farrell G. Factors affecting epirubicin pharmacokinetics and toxicity: evidence against using body-surface area for dose calculation. J Clin Oncol. 1998;16:2299–2304. doi: 10.1200/JCO.1998.16.7.2299. [DOI] [PubMed] [Google Scholar]
- 21.Ratain MJ. Body-surface area as a basis for dosing of anticancer agents: science, myth or habit ? J Clin Oncol. 1998;16:2297–2298. doi: 10.1200/JCO.1998.16.7.2297. [DOI] [PubMed] [Google Scholar]
- 22.Kurowski V, Wagner T. Comparative pharmacokinetics of ifosfamide, 4-hydroxy-ifosfamide, chloroacétaldéhyde and 2- and 3- dechloroethylifosfamide in patients on fractionated intravenous ifosfamide therapy. Cancer Chemother Pharmacol. 1993;33:36–42. doi: 10.1007/BF00686020. [DOI] [PubMed] [Google Scholar]
- 23.Lewis LD. A study of 5 day fractionated ifosfamide pharmacokinetics in consecutive treatment cycles. Br J Clin Pharmacol. 1996;42:179–186. doi: 10.1046/j.1365-2125.1996.03956.x. [DOI] [PMC free article] [PubMed] [Google Scholar]
- 24.Lind MJ, Margison JM, Cerny T, Thatcher N, Wilkinson PM. Comparative pharmacokinetics and alkylating activity of fractionated intravenous and oral ifosfamide in patients with bronchogenic carcinoma. Cancer Res. 1989;49:753–757. [PubMed] [Google Scholar]


