

Abstract
Aims
MPTP, a neurotoxin which induces parkinsonism is partially metabolized by the enzyme CYP1A2. Smoking appears to protect against Parkinson's disease (PD) and cigarette smoke induces CYP1A2 activity. Thus, we investigated the hypothesis that idiopathic PD is associated with lower CYP1A2 activity using caffeine as a probe compound.
Methods
CYP1A2 activity was assessed using saliva paraxanthine (PX) to caffeine (CA) ratios. Caffeine half-life was also estimated from salivary concentrations of caffeine at 2 and 5 h post dose. 117 treated and 40 untreated patients with PD and 105 healthy control subjects were studied.
Results
PX/CA ratios were 0.57, 0.93 and 0.77 in treated patients, untreated patients and healthy control subjects, respectively, with no significant differences between study groups (95% CI: treated patients vs controls −0.24, 0.57; untreated patients vs controls −0.75, 0.35). However, patients with PD (treated or untreated) had caffeine half-lives shorter than that in controls (treated patients: 262 min, untreated patients: 244 min, controls: 345 min; 95% CI: controls vs treated patients 23, 143 (P = 0.003); controls vs untreated patients 19, 184 (P = 0.011)). Amongst the patients with PD, caffeine half-life was also inversely related to the age of onset of disease (P = 0.012); gender and concomitant drugs did not influence this significantly.
Conclusions
Based on PX/CA ratio, there was no evidence of decreased CYP1A2 activity in patients compared with control subjects. The observed decrease in the elimination half-life of caffeine in PD may be caused by increased CYP2E1 activity, an enzyme that also contributes to the metabolism of caffeine. The latter warrants further investigation.
Keywords: caffeine metabolism, CYP2E1, Parkinson's disease
Introduction
Susceptibility to idiopathic Parkinson's disease (PD) may be dependent upon the interaction of genetic factors, exposure to environmental neurotoxins and efficiency of neuroprotective mechanisms.
MPTP, a neurotoxin that causes parkinsonism, is metabolized by monoamine oxidase to form toxic metabolites [1]. MPTP is detoxified by the liver enzymes flavin monoxygenase (FMO) and cytochromes (CYPs) P450 2D6, 1A2 and 3A4 [2, 3]. These enzymes may therefore be neuroprotective [1, 4–7]. Smoking, which induces CYP1A2 activity [7, 8], protects against MPTP-induced depletion of striatal dopamine [9] and enhances CYP1A-catalysed detoxification of neurotoxins which cause parkinsonism [10]. Consistent with these observations, epidemiological studies have reported a negative association between smoking and PD [11–15] suggesting a protective effect. It was suggested initially that the association was an artefact of ‘diagnostic displacement’[12], ‘selective mortality’[13], or ‘PD-associated personality traits’[16, 17]. Nonetheless, further studies confirmed the negative association [11, 13, 15, 18, 19]. Putative protective mechanisms include the chemical properties of cigarette smoke [19–21], enzymatic inhibition of monoamine oxidase [22], or protection against free radical damage [20]. However, induction of CYP1A2 activity may also explain the negative association between smoking and the incidence of PD.
CYP1A2 activity can be assessed by measuring the rate of metabolism of caffeine (CA) to paraxanthine (PX). Caffeine is 1-, 3-, and 7-demethylated to form theobromine (TB), PX and theophylline (TP), respectively (Figure 1) [23]. In healthy humans, the 3-demethylation of caffeine by CYP1A2 to form PX accounts for 84 ± 5% of its metabolism, whereas 1-and 7-demethylation to TB and TP accounts for 12 ± 4% and 4 ± 1% of net metabolism, respectively [24] (Figure 1). The use of plasma PX/CA ratios at 5 h after a dose of caffeine provides a robust estimate of CYP1A2 activity in vivo[25, 26].
Figure 1.

Primary routes of metabolism of caffeine in humans. The thickness of the arrow indicates the relative contribution of each pathway to overall elimination. Major enzymes responsible for each metabolic route are also shown. CYP = cytochrome P450. □ CYP1A2; ▵ CYP2E1.
We tested the hypothesis that patients with PD have decreased activity of CYP1A2 relative to disease-free control subjects. Caffeine and paraxanthine were measured in saliva rather than blood plasma as collection is less invasive and salivary concentrations have been reported to reflect plasma concentrations accurately [26]. In order to validate our findings we also examined caffeine half-life, which has also been reported to be a valid reflection of CYP1A2 activity in normal individuals [25, 26].
Methods
Power calculation
The intra- and inter-individual variability of caffeine elimination is reported to be 21% and 79%, respectively [27]. Based on this, it was estimated that 40 subjects in each group would be required to detect a 30% difference in CYP1A2 activity with a power of 80% at a significance level of α = 0.05.
Subjects
The South Sheffield Research Ethics Committee approved the study protocol and participants gave written informed consent. One hundred and seventeen treated patients with PD, 40 untreated patients with PD and 105 healthy control subjects were recruited from the Movement Disorder Outpatient Clinic, and the Departmental volunteer database at the Royal Hallamshire Hospital, Sheffield, UK. All subjects were white Caucasians living in the South Yorkshire region and patients fulfilled the diagnostic criteria of the Parkinson's Disease Society (PDS UK): akinesia plus asymmetric rest tremor, rigidity or postural instability and the absence of any other condition that might produce signs of parkinsonism. The demographic details of the three groups are shown in Table 1. To avoid the complications of matching smoking habits between PD and controls, we recruited only subjects who were currently nonsmokers. Subjects receiving medication known to affect CYP1A2 activity were excluded (fluvoxamine, cimetidine, oral contraceptives and quinolone antibacterial agents). Control subjects mainly comprised spouses and friends of patients with PD and were free from neurological disease. It was assumed that the dietary habits of patients and controls, which may influence CYP1A2 activity, are similar in our patient and control groups.
Table 1.
Demographic details of patients and controls1.
| Treated PD2 | Untreated PD | Control subjects | |
|---|---|---|---|
| Gender | 57M/60F | 17M/23F | 30M/75F |
| Age2 (years) | |||
| [range] | 64 | 60 | 61 |
| [32-78] | [32-76] | [28-80] | |
| Disease duration | 7.0 | 2.0 | |
| (years) [range] | [0.5-25] | [0.5-7] | |
The average age of treated patients with PD was significantly higher compared with controls and untreated patients (P = 0.000 and P = 0.045, respectively); the distribution of gender among groups was also significantly different (P = 0.009); Although disease duration was shorter in untreated PD patients (P = 0.0001), there was no significant difference in age of disease onset between treated and untreated patients.
Treatments included: amantadine, apomorphine, benzhexol, benztropine, bromocriptine, lysuride, co-beneldopa (levodopa with benzerazide), ropinerole, co-careldopa (levodopa with carbidopa), selegiline, pergolide.
Sample collection
Subjects were asked to abstain from methylxanthine-containing food and drinks for 12 h prior to their participation in and during the study. On the day of the study subjects provided approximately 1.5 ml of saliva in a sterile plastic tube (predose-sample), and then drank a cup of coffee providing approximately 57 mg caffeine (5 g sachet of instant coffee, Nescafé, Nestlé UK Ltd). If the subject had problems producing saliva, a piece of paraffin film (Parafilm®) was chewed to aid salivation. Subjects provided two further saliva samples at 2 and 5 h after the caffeine dose. All samples were stored in a freezer. One ml of each sample was pipetted into Eppendoff® microcentrifuge tubes and spun at 13 000 rev min−1 (corresponding to 640 g) in a MSE Microcentaur centrifuge for 10 min. The supernatant was stored at −20 °C until assay.
Assay of caffeine and paraxanthine
The method of O'Connell & Zurzola [28] was used to determine concentrations of CA and PX. Protein was removed from saliva samples by precipitation with perchloric acid followed by centrifugation. PX and CA concentrations were measured by h.p.l.c.
The intra-assay reproducibilities for CA and PX were 3% and 7% at lowest concentration (0.05 µg ml−1) and 5% and 9% at highest concentration (1.5 µg ml−1), respectively. Inter-assay variability (over 6 weeks) was consistently less than 15% for both CA and PX.
Data analysis
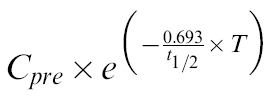
The activity of CYP1A2 was determined using the ratio of PX to CA concentration in saliva at 5 h after CA dose. In order for this ratio to be a valid reflection of CYP1A2 activity, subjects must abstain from CA-containing food and beverages for a 12–24h period [29],This precondition is unlikely to be met consistently in out-patient studies [26, 30–32]. Thus, PX/CA ratio was calculated after CA and PX concentrations were corrected for decline from predose levels by subtracting the value of the following expression:
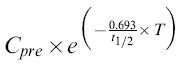 |
where Cpre is the predose saliva concentration of PX or CA and T is the time of the sample (2 or 5 h).
The elimination half lives (t½ in min) of CA and PX were calculated from:
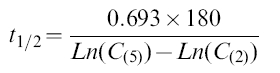 |
where C(5) and C(2) are the saliva concentrations of CA or PX at 5 and 2 h, respectively. The time elapsed between samples was 180 min.
Assuming that the absorption of CA is complete and that it is much faster than the elimination of CA [33, 34], the volume of distribution (V) of CA was estimated from:
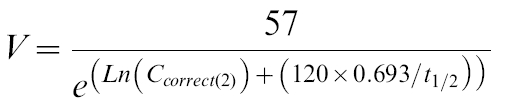 |
where Ccorrec(2) is the CA concentration at 2 h after correction for baseline, and the dose of CA is 57 mg. Hence, CA clearance (CL) was estimated from:
 |
In some patients the corrected value of PX or CA concentration was biologically implausible (i.e. negative concentration or half life, or extremely long half life). Such values may result from unusually slow absorption of the caffeine test dose, failure to abstain from methylxanthine-containing foodstuffs during the course of the experiment or failure to adhere to the timings of the experimental protocol. During calculation of CA half-life only a small proportion of subjects showed such nonbiologic values (4 of 117 values in patients with treated PD, 3 of 40 values in patients with untreated PD and 6 of 105 values in control subjects). There was no statistically significant difference in the proportion of such data between subgroups. In calculating PX/CA ratios, data from 25/117 treated patients, 12/40 treated patients and 29/105 control subjects showed nonbiological values. Again, there was no significant difference between subgroups in regard to proportion of these nonbiological values.
Three approaches were followed to overcome the problem of nonbiological values: (1) they were excluded from the analysis (2) they were replaced by the mean from the respective study population, and finally (3) they were left in the data base but nonparametric statistical methods were used to analyse the data.
During the first two statistical analyses, the differences in PX/CA ratios, caffeine half life, volume of distribution and clearance between groups were assessed using repeated measures analysis of variance (manova) followed by Tukey's post hoc analysis (SPSS for Windows v7.0). In all subsequent analyses age, gender and concomitant drugs used by PD patients were considered as covariates. Relationships between caffeine half life and covariates were investigated using backwards stepwise multiple linear regression analysis.
A cut-off age for the relationship between the age of onset of PD and caffeine half life (covaried for age) was sought using the following equations:
when age of onset ≤ cut-off age:
when age of onset > cut-off age:
where the unknown parameters Slope, Intercept and Cut-Off Age were estimated iteratively by Solver within Excel (v5.0, Microsoft Corporation).
Non-parametric comparisons were made using the Mann–Whitney U-test (SPSS for Windows v7.0).
Results
Nearly 90% of subjects were found to have baseline salivary concentrations of CA and/or PX, despite instructions to abstain from CA intake. Implications of this observation are reported elsewhere [29]. The values (and interquartile range) for CA, PX and PX/CA ratios are shown for each subgroup in Table 2. It has been reported that dietary CA can also be used as a probe for CYP1A2 activity [35]. Therefore, predose samples were analysed to calculate values of predose PX/CA ratio.
Table 2.
Summary of observed and calculated kinetic parameters values of caffeine (as medians) in control subjects and PD patients1.
| Parameters2 | Control subjects | Untreated PD | Treated PD |
|---|---|---|---|
| CA(0) | 587 [254-964] | 339 [101-756]3 | 162 [41-651]3 |
| CA(2) | 1400 [780-2048] | 1025 [671-1891] | 993 [858-1546]3 |
| CA(2)cor | 1026 [567-1388] | 740 [557-1425] | 706 [506-1116] |
| CA(5) | 849 [430-1298] | 596 [330-953] | 467 [252-869]3 |
| CA(5)cor | 593 [291-841] | 425 [284-858] | 371 [200-650]3 |
| CA t1/2 | 351 [204-446] | 197 [141-324]3 | 223 [129-341]3 |
| PX(0) | 390 [209-643] | 268 [174-442] | 242 [79-451]3 |
| PX(2) | 644 [366-879] | 427 [281-587]3 | 533 [316-743] |
| PX(2)cor | 423 [161-579] | 350 [184-517] | 322 [152-544] |
| PX(5) | 509 [364-686] | 357 [227-518] | 376 [217-579] |
| PX(5)cor | 358 [131-519] | 300 [151-475] | 255 [130-436] |
| PX t1/2 | 585 [185-621] | 479 [3-1345] | 355 [154-835] |
| PX/CA (0) | 0.43 [0.30-0.93] | 0.38 [0.12-0.64]3 | 0.37 [0.12-0.67]3 |
| PX/CA (2)cor | 0.40 [0.20-0.71] | 0.42 [0.21-0.63] | 0.44 [0.22-0.74] |
| PX/CA (5)cor | 0.62 [0.30-0.92] | 0.63 [0.32-1.00] | 0.66 [0.35-1.07] |
Numbers in bracket show the time of sampling; numbers in square bracket show the values for first and third quartiles; subscript ‘cor’ shows that the corresponding parameter value is obtained after correction for baseline (see Methods for details).
Concentrations values for CA and PX are in ng ml−1; half-life values are in min.
Significantly different from control subjects (at α≤0.02).
Non-parametric analysis, including all nonbiological values, revealed the half-life of CA to be significantly shorter in treated or untreated PD patients compared to control subjects (P = 0.001 and P = 0.008, respectively; Mann–Whitney U-test). The most common CYP 1A2 activity, PX/CA ratio at 5 h, was not significantly different between groups. Pre-dose PX/CA, however, was significantly lower in both treated and untreated PD patients compared with control subjects (P = 0.000 and P = 0.012, respectively; Mann–Whitney U-test).
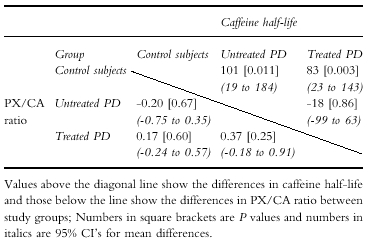
A summary of the results following parametric analysis of the data (see Methods) is shown in Table 3. Again, there was a significant difference in CA half-life between patients with PD and controls. Both patients with treated PD and those with untreated PD had significantly lower values compared with controls (the gender and age differences between these groups were accounted for using manova).
Table 3.
Summary of differences in mean PX/CA ratio and caffeine half-life between PD patients and control subjects1.
 |
Multiple regression analysis revealed that caffeine half- life was related to the age of onset of disease and current age of patients in the group with PD (P = 0.041). Nevertheless, these could explain only 5% of the overall variability. Covariates such as gender and concomitant drugs taken by PD patients did not contribute to the variance of caffeine half-life significantly. Current age was related inversely to caffeine half life in the patient group (P = 0.048,Figure 2). There is evidence for a different aetiology in early and late onset Parkinson's disease. Despite the existence of analytical tools to define aetiological subgroups (e.g. cluster analysis, modelling), the age cut-off point has often been determined arbitrarily. We sought a cut-off point for the association of age of onset and caffeine half life by means of modelling. The broken line in Figure 2 shows the best model fit when such a cut-off point is considered and determined using an iterative fitting process (P = 0.00005). The model suggested that beyond 61 years of age, there was no relationship between caffeine half-life and age of onset. This model, although consistent with previous suggestions of different aetiology of early and late parkinsonism in finding a cut-off age, produced only a marginal improvement in fit compared with simple linear regression (dotted line in Figure 2a; P = 0.10 for the improvement of fit; F-test). No correlation between age and caffeine half-life was observed in the control group or the group of untreated patients with PD when considered separately.
Figure 2.

Relationships between caffeine half-life and (a) age of onset and (b) current age of patients with PD after correcting for other covariates.
Mean values of estimated volume of distribution and clearance for caffeine (Table 4) were similar to those reported in the literature [27]. However, variability in the values was high, reflecting the indirect method of estimation and limited utility of such parameters. Body weight, a covariate for caffeine volume of distribution [33], did not differ between study groups (mean weight of control subjects ± s.e.mean = 71 ± 1.4 kg; treated PD = 69 ± 1.5 kg; untreated PD = 70 ± 2.1 kg; P = 0.53).
Table 4.
Estimated caffeine volume of distribution and clearance values in the study groups1.
| Group | Volume of distribution2 (l) | Clearance3 (l h−1) |
|---|---|---|
| Treated PD | 57 | 12 |
| (n = 117) | (35) | (12) |
| Untreated PD | ||
| (n = 40) | 50 | 10 |
| (27) | (7) | |
| Control | ||
| (n = 105) | 58 | 9 |
| (47) | (7) | |
Values are means (± s.d.) There was no significant differences between groups. Patients with treated PD had significantly higher clearances compared with controls (P = 0.019).
Discussion
Since the mean salivary PX/CA ratio 5 h postdose was not different in patients with PD and controls, the original hypothesis that induction of CYP1A2 activity protects against PD by enhancing CYP1A2-mediated detoxification of a neurotoxin was unlikely. Pre-dose PX/CA ratios showed significantly lower values in patients compared to control subjects. This may imply that CYP1A2 activity is lower in patients with PD, but the validity of this measure as a probe for CYP1A2 is doubtful if all subjects were instructed to refrain from caffeine containing food and beverages. The difference between patients and control subjects may alternatively reflect the differences in abstinence from caffeine between control and patient groups [29]. It is established that PX/CA ratio increases with time after caffeine ingestion [25, 36]. Thus, lower predose ratios may indicate that the duration of abstinence from caffeine containing beverage had been shorter in the PD group. PX/CA ratio at 5 h (corrected for baseline) is not influenced by such factors. The similarity between control and PD subjects is inconsistent with a true difference in CYP1A2 activity between the groups. Accordingly, the mechanism of the protective effect of smoking in the development of PD remains obscure. It is possible that induction of CYP1A2 in smokers accelerates the removal of a neurotoxin but, as none of our patients were current smokers, we are unable to comment further on this issue.
CYP1A2 activity, as marked by the PX/CA ratio at 5 h post dose, was similar in patients with PD yet the half-life of caffeine was shorter and its clearance faster. This suggests an alternative hypothesis for the role of xenobiotic metabolism in the aetiology of PD. Normally, CYP2E1 is responsible for only a small fraction (about 3%) [25] of the metabolism of caffeine by contributing to 1-and 7-demethylation (Figure 1). However, CYP2E1 is an inducible enzyme [37], and significant up-regulation may account for the enhanced elimination of caffeine in patients with PD. Accordingly, induction of the formation of a neurotoxin from a precursor by CYP2E1 may be a predisposing factor to PD. Thus, the balance of the activities of different CYPs may determine the rate of production of the putative neurotoxin, CYP2E1 producing the toxin and CYP1A2 and CYP2D6 inactivating it (Figure 3). This scheme is consistent with a recent report that the neuroprotective effect of smoking is reduced by heavy alcohol intake [38].
Figure 3.

Scheme for the proposed activation and detoxification of a putative neurotoxin causing PD. CYP = cytochrome P450; FMO = flavin monooxygenase.
CYP2E1 is known to be localized in rat substantia nigra dopamine cells [39]. Bandmann et al.[40] reported no significant genotypic differences in CYP2E1 between patients with PD and control subjects. However, the genotypes were defined with respect to the coding region of the CYP2E1 gene; regulatory genes may be more important to consider.
It is known that gastric emptying is slower in PD patients [41]. This could have an effect on the estimate of caffeine half-life as measured from 2 and 5 h samples. However, assuming such an effect, it should bias estimates of half-life to longer values compared to controls. This is in contrast to our observation.
Our patients with an early onset of disease exhibited faster metabolism of caffeine compared to those with late-onset disease, this suggests that the enzyme alteration associated with accelerated caffeine metabolism (other than change in CYP1A2) could be a significant risk factor for both the development and progression of PD. An inverse relationship between age and caffeine half-life was observed in the treated patients with PD but not in untreated patients or control subjects. This may reflect an effect of treatment duration or the effect of disease duration on metabolism. Differentiation between such effects would be possible only by comparing treated and untreated patients with similar disease duration, which is problematic.
In conclusion we have demonstrated that a lower PX/CA ratio 5 h after caffeine intake, as a marker of low CYP1A2 activity, is not associated with PD. Faster elimination of caffeine (i.e. shorter half-life) was found in patients with PD, and may indicate a possibility for higher activity of CYP2E1, an enzyme that contributes to caffeine metabolism. The possibility of a relationship between age of onset and short caffeine half-life warrants further studies since this relationship implies that modulation of the activity of the enzymes involved in caffeine metabolism could enhance or retard the rate of progression of PD.
Acknowledgments
We thank the Special Trustees of the Central Sheffield University Hospitals Trust for financial support for this research.
References
- 1.Chiba K, Trevor A, Castagnoli NJ. Metabolism of the neurotoxic tertiary amine, MPTP, by brain monooxidase. Biochem Biophys Res Comm. 1984;120:574–578. doi: 10.1016/0006-291x(84)91293-2. [DOI] [PubMed] [Google Scholar]
- 2.Coleman T, Ellis SW, Martin IJ, Lennard MS, Tucker GT. MPTP, (1-methyl-4-phenyl-1, 2 3 6–tetrahydropyridine) is N–demethylated by cytochromes 2D6, 1A2 and 3A4. Implications for susceptibility to Parkinson's disease. J Pharmacol exp Ther. 1996;277:685–690. [PubMed] [Google Scholar]
- 3.Suzuki T, Fujita S, Narimatsu S, et al. Cytochrome P450 isozymes catalysing 4-hydroxylation of the parkinsonism-related compound 1, 2,3, 4–tetrahydroisoquinoline in rat liver microsomes. FASEB J. 1992;6:771–775. doi: 10.1096/fasebj.6.2.1537468. [DOI] [PubMed] [Google Scholar]
- 4.Cashman JR, Zeigler DM. Contribution of N-oxygenation to the metabolism of MPTP (1-methyl,-4-phenyl-,1, 2,3, 6–tetrahydropyridine) by various liver preparations. Mol Pharmacol. 1986;29:163–167. [PubMed] [Google Scholar]
- 5.Weissman J, Trevor A, Chiba K, Peterson LA, Cakdera P, Castagnoli NJ. Metabolism of 1 methyl-4-phenyl-1, 2,3, 6–tetrahydroisopyridine by liver homogenate fractions. J Med Chem. 1985;28:997–1001. doi: 10.1021/jm00146a005. [DOI] [PubMed] [Google Scholar]
- 6.Heikkila RE, Manino L, Cabbat FS, Duvoisin RC. Effects of MPTP and several of its analogues on the dopaminergic nigrostriatal pathway in mice. Neurosci Lett. 1985;58:133–137. doi: 10.1016/0304-3940(85)90342-8. [DOI] [PubMed] [Google Scholar]
- 7.Haack DG, Baumann RJ, McKean HE, Jameson HD, Turbeck JA. Nicotine exposure and Parkinson’s disease. Am J Epidemiol. 1981;114:191–200. doi: 10.1093/oxfordjournals.aje.a113182. [DOI] [PubMed] [Google Scholar]
- 8.Grandinetti A, Morens DM, Reed D, MacEachern D. Prospective study of cigarette smoking and the risk of developing idiopathic Parkinson’s disease. Am J Epidemiol. 1994;139:1129–1138. doi: 10.1093/oxfordjournals.aje.a116960. [DOI] [PubMed] [Google Scholar]
- 9.Shahi G, Das N, Moochhala S. MPTP-induced neurotoxicity: Partial protection against striato-nigral dopamine depletion in C57BL/6J mice by cigarette smoke exposure and by β-naphthoflavone pretreatment. Neurosci Lett. 1991;127:247–250. doi: 10.1016/0304-3940(91)90804-3. [DOI] [PubMed] [Google Scholar]
- 10.Das NP, Shahi GS, Moochhala SM, Sato T, Sunamoto J. Effects of MPTP and its toxic metabolites on the physicochemical property of the liposomal membrane in relation to their cytochrome P-450 inhibition. Chem Phys Lipids. 1992;62:303–310. doi: 10.1016/0009-3084(92)90067-y. [DOI] [PubMed] [Google Scholar]
- 11.Godwin-Austen RB, Lee PN, Marmot MG, Stern GM. Smoking and Parkinson's disease. J Neurol Neurosurg Psychiatry. 1982;45:577–581. doi: 10.1136/jnnp.45.7.577. [DOI] [PMC free article] [PubMed] [Google Scholar]
- 12.Nefzger MD, Quadfasel FA, Karl VC. A retrospective study of smoking in Parkinson's disease. Am J Epidemiol. 1968;88:149–158. doi: 10.1093/oxfordjournals.aje.a120874. [DOI] [PubMed] [Google Scholar]
- 13.Rajput A, Offord K, Beard C, Kurland L. A case control study of smoking habits, dementia and other illnesses in Idiopathic Parkinson's disease. Neurology. 1987;37:226–232. doi: 10.1212/wnl.37.2.226. [DOI] [PubMed] [Google Scholar]
- 14.Dorn HF. The mortality of smokers and non-smokers. Proc Soc Stat Sec Am Stat Assoc. 1958;1:34–71. [Google Scholar]
- 15.Kahn HA. Epidemiological Approaches to the Study of Cancer and Other Chronic Diseases Monograph No 19 Washington, DC. National Cancer Institute: US Government Printing Office; 1966. The Dorn Study of smoking and mortality among US veterans. Report on eight and one half years of observations; pp. 1–125. [PubMed] [Google Scholar]
- 16.Ward CD, Duvoisin RC, Ince SE, Nutt JD, Eldridge R, Calne DB. Parkinson's disease in 65 pairs of twins and in a set of quadruplets. Neurology. 1983;33:815–824. doi: 10.1212/wnl.33.7.815. [DOI] [PubMed] [Google Scholar]
- 17.Bharucha NE, Stokes L, Schoenberg BS, et al. A case control study of twin pairs discordant for Parkinson’s Disease: a search for environmental risk factors. Neurology. 1986;36:284–288. doi: 10.1212/wnl.36.2.284. [DOI] [PubMed] [Google Scholar]
- 18.Jimenez-Jimenez FJ, Mateo D, Gimenez-Roldan S. Premorbid smoking, alcohol consumption, and coffee drinking habits in Parkinson's disease: a case control study. Movement Disord. 1992;7:339–344. doi: 10.1002/mds.870070407. [DOI] [PubMed] [Google Scholar]
- 19.Kessler II, Diamond EL. Epidemiological studies of Parkinson's disease: a survey and explanatory hypothesis. Am J Epidemiol. 1971;94:16–25. doi: 10.1093/oxfordjournals.aje.a121289. [DOI] [PubMed] [Google Scholar]
- 20.Baron JA. Cigarette smoking and Parkinson's disease. Neurology. 1986;36:1490–1496. doi: 10.1212/wnl.36.11.1490. [DOI] [PubMed] [Google Scholar]
- 21.Arqueros L, Naquira D, Zunino E. Nicotine induced release of catecholamines from rat hippocampus and striatum. Biochem Pharmacol. 1978;27:667–674. doi: 10.1016/0006-2952(78)90040-0. [DOI] [PubMed] [Google Scholar]
- 22.Janson AM, Fuxe K, Goldstein M. Differential effects of acute and chronic nicotine treatment on MPTP-induced degeneration of nigrostriatal dopamine neurons in the black mouse. Clin Invest. 1992;70:232–238. doi: 10.1007/BF00184656. [DOI] [PubMed] [Google Scholar]
- 23.Kalow W, Tang B-K. The use of caffeine for enzyme assays: a critical appraisal. Clin Pharmacol Ther. 1993;53:503–514. doi: 10.1038/clpt.1993.63. [DOI] [PubMed] [Google Scholar]
- 24.Lelo A, Miners J, Robson R, Burkett D. Quantitive assessment of caffeine partial clearances in man. Br J Clin Pharmacol. 1986;22:183–186. doi: 10.1111/j.1365-2125.1986.tb05247.x. [DOI] [PMC free article] [PubMed] [Google Scholar]
- 25.Rostami-Hodjegan A, Nurminen S, Jackson PR, Tucker GT. Caffeine urinary metabolite ratios as markers of enzyme activity: a theoretical analysis. Pharmacogenetics. 1996;6:121–149. doi: 10.1097/00008571-199604000-00001. [DOI] [PubMed] [Google Scholar]
- 26.Fuhr U, Rost KL. Simple and reliable CYP1A2 phenotyping by the paraxanthine/caffeine ratio in plasma and in saliva. Pharmacogenetics. 1994;4:109–116. doi: 10.1097/00008571-199406000-00001. [DOI] [PubMed] [Google Scholar]
- 27.Balogh A, Harder S, Vollandt R, Staib AH. Intra-individual variability of caffeine elimination in healthy subjects. Int J Clin Pharmacol Ther Toxicol. 1992;30:383–387. [PubMed] [Google Scholar]
- 28.O'Connell SE, Zurzola FJ. Rapid quantitative liquid chromatographic determination of caffeine levels in plasma after oral dosing. J Pharm Sci. 1984;73:1009–1011. doi: 10.1002/jps.2600730742. [DOI] [PubMed] [Google Scholar]
- 29.Rostami-Hodjegan A, Forsyth J, Grünewald RA, Lennard MS, Sagar HJ, Tucker GT. The paraxanthine caffeine ratio in saliva as a marker of CYP1A2 activity. Br J Clin Pharmacol. 1999;47:587P–588P. doi: 10.1046/j.1365-2125.2000.00259.x. [DOI] [PMC free article] [PubMed] [Google Scholar]
- 30.Wahlländer A, Mohr S, Paumgartner G. Assessment of hepatic function: comparison of caffeine clearance in serum and saliva during the day and night. J Hepatol. 1990;10:129–137. doi: 10.1016/0168-8278(90)90041-o. [DOI] [PubMed] [Google Scholar]
- 31.Rodopoulos N, Norman A. Assessment of dimethylxanthine formation from caffeine in healthy adults: comparison between plasma and saliva concentrations and urinary excretion of metabolites. Scand J Clin Lab Invest. 1996;56:259–268. doi: 10.3109/00365519609088615. [DOI] [PubMed] [Google Scholar]
- 32.Lewis FW, Rector Wj., Jr Caffeine clearance in cirrhosis. The value of simplified determination of liver metabolic activity. J Hepatol. 1992;14:157–162. doi: 10.1016/0168-8278(92)90152-f. [DOI] [PubMed] [Google Scholar]
- 33.Blanchard J, Sawers SJA. The absolute bioavailability of caffeine in man. Eur J Clin Pharmacol. 1983;24:93–98. doi: 10.1007/BF00613933. [DOI] [PubMed] [Google Scholar]
- 34.Bonati M, Latini R, Galletti F, Young JF, Togoni G, Garattini S. Caffeine disposition after oral doses. Clin Pharmacol Ther. 1982;32:98–106. doi: 10.1038/clpt.1982.132. [DOI] [PubMed] [Google Scholar]
- 35.Nordmark A, Lundgren S, Canttingius S, Rane A. Dietary caffeine as a probe agent for assessment of cytochrome P4501A2 activity in random urine samples. Br J Clin Pharmacol. 1999;47:397–402. doi: 10.1046/j.1365-2125.1999.00918.x. [DOI] [PMC free article] [PubMed] [Google Scholar]
- 36.Spigset O, Hagg S, Soderstorm E, Dahlqvist R. The paraxanthine: caffeine ratio in saliva as a measure of CYP1A2 activity: when should the sample be obtained? Pharmacogenetics. 1999;9:409–412. [PubMed] [Google Scholar]
- 37.Song BJ. Ethanol-inducible cytochrome P450 (CYP2E1): biochemistry, molecular biology and clinical relevance: 1996 Update. Alcohol Clin Exp Res. 1996;20:138A–146A. doi: 10.1111/j.1530-0277.1996.tb01764.x. [DOI] [PubMed] [Google Scholar]
- 38.Gorell JM, Rybicki BA, Cole Johnson C, Peterson EL. Smoking and Parkinson's disease: a dose–response relationship. Neurology. 1999;52:115–119. doi: 10.1212/wnl.52.1.115. [DOI] [PubMed] [Google Scholar]
- 39.Riedl A, Watts P, Edwards R, Boobis A, Jenner P, Marsden C. Selective localisation of P450 enzymes and NADPH-P450 oxidoreductase in rat basal ganglia using peptide antisera. Brain Res. 1996;743:324–328. doi: 10.1016/s0006-8993(96)00746-9. [DOI] [PubMed] [Google Scholar]
- 40.Bandmann O, Vaughan J, Holmans P, Marsden CD, Woods NW. Association of slow acetylator genotype for N-acetyltransferase 2 with familial Parkinson’s disease. Lancet. 1998;350:1136–1139. doi: 10.1016/s0140-6736(97)03495-8. [DOI] [PubMed] [Google Scholar]
- 41.Djaldetti R, Baron J, Ziv I, Melamed E. Gastric emptying in Parkinson's disease: Patients with and without response fluctuations. Neurology. 1996;46:1051–1054. doi: 10.1212/wnl.46.4.1051. [DOI] [PubMed] [Google Scholar]