Introduction
During the past decade interest in the potential for drugs to have proarrhythmic effects has increased substantially. The evidence which has lead to this comes from a number of sources. For example, in a study that identified over 24 000 medicolegal postmortems between 1985 and 1988 in Finland, 49 cases were detected in patients receiving psychotropic drugs, in whom the cause of death could not be determined. Analysis of drug treatment in these subjects revealed that a substantially greater proportion had been receiving the drug thioridazine than could be accounted for by consumption of this drug in the general population [1]. While this evidence does not establish causality of a proarrhythmic effect of thioridazine, it identified the need for investigation of such an effect. In a further study based on a database of over 33 000 ECGs recorded between 1975 and 1983, 183 recordings with QTc prolongation based on an arbitrary threshold of 470 ms were identified. These were compared with 187 recordings from matched subjects in which QTc values were normal. Comparison of diagnoses and drug treatment revealed hypertension to be significantly more common in those with QTc prolongation [2]. This is consistent with the QT prolongation reported in left ventricular hypertrophy [3]. In addition the drug sotalol (known to prolong action potential duration) was used more frequently in patients with QT prolongation. Mortality rates were significantly higher in patients with QT prolongation, although, this could not be explained by the increased use sotalol or other drugs. These data suggest that QT prolongation is a risk marker for increased cardiac mortality due to the prevalence of coexisting disease, although they do not define a precise risk threshold for QTc intervals. Interest in drug effects on the QT interval was further increased following reports that terfenadine, a widely used histamine 1 receptor antagonist may cause Torsade de Pointes and QT prolongation [4]. In addition interaction studies showed that the use of terfenadine with drugs known to inhibit hepatic cytochrome P 450 caused accumulation of terfenadine and greater QT prolongation [5]. The relationship between proarrhythmic effects and QT prolongation is complicated since other drugs that prolong the QT interval show no evidence of proarrhythmic activity and may in fact possess potent antiarrhythmic properties. Thus amiodarone causes significant prolongation of QT and QTc intervals and is perhaps the most effective antiarrhythmic agent available [6, 7]. There is a need for greater clarity of the electrophysiological basis for proarrhythmic drug action and more detailed studies of the cardiac effects of new therapeutic substances are required.
Significance of QT intervals
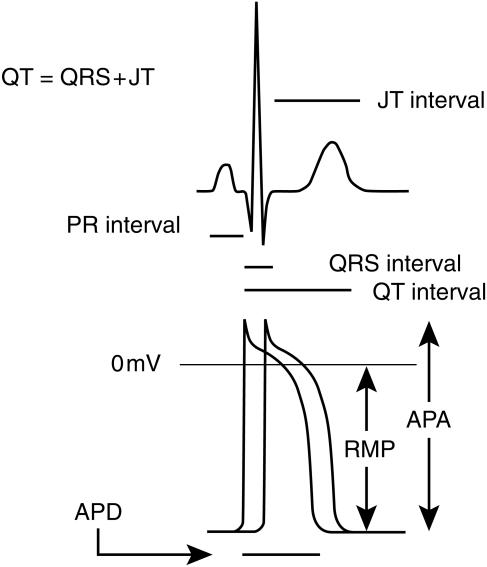
The importance of the QT interval is its relationship to the timing of ventricular activation. The QT interval is measured from the beginning of the QRS complex to the end of the T-wave. In physiological terms this represents the time required to achieve ventricular depolarization, the time to the onset of repolarization and the time required to complete repolarization (Figure 1). Thus the QT interval is affected by both ventricular conduction velocity as well as by the velocity of repolarization. It has the potential therefore to detect electrophysiological abnormalities due to impaired conduction or altered repolarization.
Figure 1.
ECG and action potential intervals. The duration of the QRS complex corresponds to the interval required for complete ventricular activation, which is illustrated by the interval between the two action potentials illustrated representing the first and last action potentials during ventricular activation. The QT interval corresponds to the time from the onset of ventricular activation to the end of repolarisation and is therefore affected by both ventricular conduction velocity and the action potential duration. The JT interval corresponds to the time from the end of the QRS complex to the end of the T wave. The PR interval is measured from the onset of the P wave to the onset of the QRS complex and is mainly due to AV node conduction. APD action potential duration; RMP resting membrane potental; APA action potential amplitude.
Cardiac muscle is unique in that it possesses a long action potential (approximately 100 times longer than that in skeletal muscle). Rapid trains of short action potentials in skeletal muscle permit sustained contraction (tetany). In contrast, the long action potential in cardiac muscle and the associated refractory period are essential for maintaining its cyclical contraction. An ordered pattern of conduction and normal repolarization are essential for the maintenance of normal sinus rhythm. The corollary is also true; altered conduction and repolarization are frequently the basis of the dysrhythmias. Thus slowing of conduction and delayed repolarization are essential requirements for re-entry dysrhythmias [8] and are recognized features of myocardial ischaemia [9].
To date most clinical and regulatory interest has focused on drug induced changes in repolarization as a potential proarrhythmic marker. As indicated above altered conduction may also be an important proarrhythmic mechanism. Indeed some drugs, known to possess proarrhythmic properties, cause QTc prolongation due to increased QRS duration [10]. Thus drug induced changes in conduction may be at least as important as alterations in repolarization. Interventricular conduction velocity is dependent on several factors; (a) the His Purkinje system is responsible for rapid spread of activation to all parts of the endocardium (b) the upstroke of the action potential effects the rate of propagation between adjacent myocytes and therefore conduction velocity. (c) gap junctions are areas of close apposition between adjacent myocytes and form low electrical resistance pathways. Alteration in gap junction structure or composition may therefore alter conduction velocity [11]. Cell stimulation at the end an action potential may result in action potentials of varying characteristics depending on the state of refractoriness. Incomplete activation may result in impaired conduction under these circumstances. Irrespective of the mechanism causing impaired conduction, this will manifest on the ECG has a widening of the QRS interval and consequently, in prolongation in the QT interval.
Measurement of QT intervals
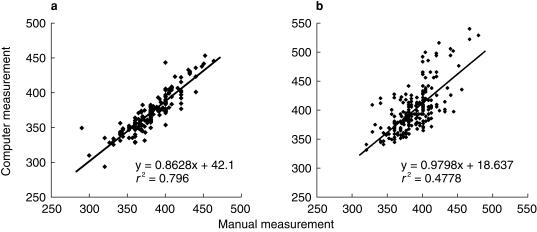
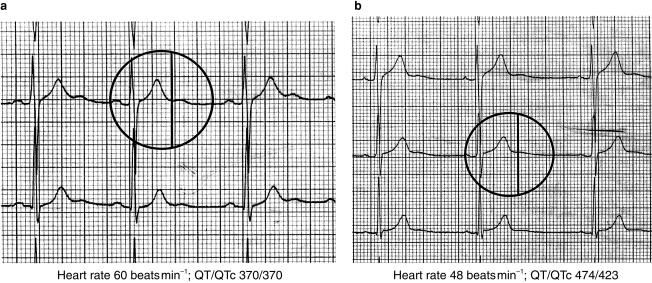
Prolongation of the QT interval is known to occur under several circumstances. Thus QT prolongation is known to occur in cardiac disease such as coronary heart disease and left ventricular hypertrophy [2, 12, 13]. Congenital long QT syndromes occur in patients with genetic abnormalities of potassium channels [14]. In addition hypokalaemia and hypomagnesaemia cause QT prolongation. The QT interval varies inversely with the heart rate and consequently QT prolongation is associated with bradycardia. Finally, certain drugs are known to cause QT prolongation and dysrhythmias. Measurement of the QT interval therefore provides an important clue to potential arrhythmogenic effects. Computer analysis provides a means for rapid diagnosis of the ECG. In most but not all cases this includes accurate measurement of the QT interval. Figure 2 shows a regression analysis of manual and computer measurements of the QT interval. In Figure 2a, the relationship appears satisfactory however, in Figure 2b there is evidence of deviation from the regression line, especially at higher QT values. The contrasting findings between Figure 2a and b relate to the appearance of U waves at lower heart rates. When U waves are clearly separate from the T-wave the computer accurately detects the end of the T wave. However when the end of the T wave and the U wave merge difficulties may arise. This is illustrated in Figure 3, which shows two ECG recordings from the same patient. Both show U-waves following the T-wave. In Figure 3a, the heart rate is 60 beats min−1 and the T and U waves are distinct. The computer correctly identifies the end of the T-wave. In Figure 3b the heart rate is 48 beats min−1 and the T-wave and U wave merge, the latter appearing as a gradual return to the isoelectric line at the end of the T-wave. In this case the computer incorrectly identifies the end of the T-wave. Thus while computer analysis may provide rapid and in most cases accurate analysis of ECG complexes, uncertainty may arise in the presence of variable T and U wave morphology, particularly at slow heart rates. Better definition of computer algorithms for T-wave analysis is required and specific algorithms meeting regulatory requirements for the assessment of potential proarrhythmic effects may be helpful. Care is therefore needed in the interpretation of computer measured QT intervals, particularly at slow heart rates when U waves become more prominent.
Figure 2.
Regression analysis for manual vs computer measured QT intervals in two study populations whose ECGs were read manually by the same reader. The correlation coefficient for (a) is greater than for (b), which clearly shows greater variation and includes subjects with longer QT intervals. It is also apparent that the computer read QT intervals tend to be greater than manual values when QT intervals are longer.
Figure 3.
Two ECGs from a patient recorded at different heart rates. With a heart rate of 60 beats min−1 (a) the QT interval is computed to be 370 ms. This position is indicated by the vertical marker and corresponds to the end of the T wave, just before the onset of a following U wave. With a heart rate of 48 beats min−1 (b) the QT interval is computed to be 474 ms and this position is again indicated by the vertical line. In this case the U wave appears as a gradual return to the iso-electric line after the T wave and the computer incorrectly identifies the end of the T wave, resulting in a longer QTc interval. Computer analysis of the QT interval may be subject to error at slow heart rates and with variable T and U wave morphologies.
Investigation of electrophysiological safety
Preclinical evaluation of new drugs requires assessment of cardiovascular safety. This should include in vivo studies of effects on heart rate, blood pressure and the ECG. The latter should be analysed for effects on the PR interval, QRS interval, QT and QTc intervals. In addition qualitative changes in T and U wave morphology should be reported. Preclinical evaluation should also consider drug interaction studies involving for example other drugs known to prolong the QT interval and drugs that may modify metabolism of the drug under investigation. Care should be taken to ensure that drugs are studied in doses that produce relevant therapeutic levels or toxic levels where appropriate and should include pharmacokinetic evaluation. In vitro electrophysiological studies should also be considered for which there are a number of useful models.
Isolated Langendorff perfused hearts may be used to study effects on QRS and QT intervals and heart rate. By immersing perfused hearts in a suitable buffer electrograms can be recorded using electrodes placed in the superfusion buffer for this purpose. In addition this preparation may be used to study electrophysiological effects of metabolites of the parent compound and interactions with altered buffer electrolyte composition such as the low potassium concentration. Drug actions during myocardial ischaemia may be studied in the presence of reduced coronary flow.
Isolated superfused myocardial preparations may be used to study effects on resting membrane potential and action potential characteristics such as amplitude, upstroke velocity and duration. Papillary muscles and Purkinje fibres permit recording of action potentials from the muscle surface using microelectrodes and are suitable for this purpose. Studies aimed at assessing effects on cardiac repolarization should avoid species that have little plateau phase to cardiac action potential, such as rat or mouse. Langendorff perfused hearts may also used to record action potentials from the epicardial surface using floating microelectrodes.
Drugs that show evidence of QT prolongation may require further investigation to evaluate the specific ion channels involved. Such studies are usually carried out using isolated cardiac myocytes obtained by enzymatic digestion of intact hearts. Thus drugs that alter ventricular conduction may effect sodium channel activity; prolongation of the PR interval may involve altered calcium channel activity, while prolongation of action potential duration may be due to altered potassium channel activity, all of which can be evaluated using these preparations by experienced laboratories. More recently oocytes transfected with DNA encoding specific ion channels and expressing these channels have been used to investigate the activity of single channels. These preparations provide an excellent model for studying mechanisms of single channels but as yet are not well standardized. For this reason they are best reserved for specialized studies.
Thus preclinical assessment requires in vivo studies of haemodynamics and ECG intervals. In vitro studies of cardiac action potentials in a well established preparation should also be undertaken and compounds demonstrating electrophysiological activity should be studied further to determine the ionic currents and channels involved,
Investigation of clinical electrocardiographic effects
Investigation of clinical safety should include measurement of pulse, blood pressure and ECG intervals in placebo-controlled, randomized trials. Where appropriate, plasma levels of metabolites as well as the parent drug should be assayed. In addition where preclinical studies suggest that metabolic interactions are likely, drug interaction studies may be necessary [5]. Acute and chronic studies should be undertaken and should include pharmacokinetic evaluation.
QT interval assessment
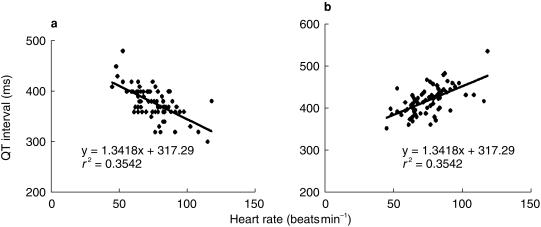
Assessment of cardiovascular safety should include studying effects on QT intervals. As mentioned previously this may be done using manual or computer methods. Whichever technique is employed, care is needed in the analysis of results. Heart rate is well known to be negatively correlated with the QT interval and for this reason QT intervals are corrected for heart rate. Many different formulae have been proposed for this. The most widely used calculates QTc as QT/√RR. It is important to bear in mind that none of these offers a perfect correction and it is more important to understand the limitations of the correction used rather than applying multiple formulae. Thus QTc as derived above involves some degree of over correction resulting in a positive correlation between the QTc interval and heart rate. Figure 4 illustrates the widely recognized negative correlation between the QT interval and heart rate (a) and the positive correlation between the QTc interval and heart rate (b). This has important implications for safety studies in which heart rate is effected either directly by the drug under investigation, by diurnal variation or as a result of behaviour such as food intake since these a result in indirect changes in the QTc interval. In cases where a drug induced increase in the QTc interval is observed, the relationship between the change observed and the baseline QTc interval should be analysed. This may be important in considering whether QT intervals should be measured prior to commencing drug treatment.
Figure 4.
Linear regression between heart rate and QT interval (a) and QTc interval (b) showing a negative correlation in the case of the former and a positive correlation in the case of the latter (n = 79, P < 0.05 in each case).
Assessment of QRS intervals
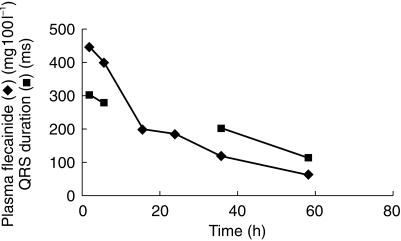
As discussed above the QRS interval provides an indirect assessment of ventricular conduction velocity. There is good reason to believe that delayed conduction is an important contributing factor to drug induced proarrhythmic effects. Figure 5 illustrates changes in flecainide plasma levels and QRS intervals in a 13 year old girl admitted following unintended intoxication [15]. The QRS duration was markedly prolonged on admission and fell progressively in the days thereafter as the plasma flecainide level declined. An earlier study showed that flecainide causes prolongation in the QTc interval almost all of which could be accounted for by prolongation in the QRS interval [10]. Clearly delayed ventricular conduction is an important electrophysiological effect of flecainide and is likely to contribute to its known proarrhythmic potential.
Figure 5.
Changes in the QRS interval and plasma flecainide concentrations following admission of a 13 year old female after unintended overdosing. The QRS interval was markedly prolonged on admission and returned to control levels as her plasma concentration declined [15].
Conclusions
Many drugs including those not intended primarily for cardiovascular use may have important proarrhythmic potential. Careful analysis of the cardiac electrophysio-logical effects of new drugs is therefore appropriate. The QT and QTc intervals provide a simple noninvasive and sensitive means to detect such effects. However these are nonspecific indicators of electrophysiological action and do not distinguish effects on conduction from those on repolarization. Prolongation of the QT interval is a recognized effect of some antiarrhythmic agents that are devoid of in the proarrhythmic activity. Detailed electrophysiological investigation is therefore needed to define the precise electrophysiological basis for QT prolongation and to distinguish drugs that are antiarrhythmic from those that are potentially proarrhythmic and to avoid inappropriately discarding potentially useful compounds. Further research is needed to determine the degree of pro-arrhythmic risk for any given change in QT/QTc interval and to investigate the relative contribution of conduction and repolarization to proarrhythmic activity.
References
- 1.Mehtonen OP, Aranko K, Malkonen L, Vapaatalo HA. Survey of sudden death associated with the use of antipsychotic or antidepressant drugs. Acta Psychiatr Scand. 1991;84:58–64. doi: 10.1111/j.1600-0447.1991.tb01421.x. 49 cases in Finland. [DOI] [PubMed] [Google Scholar]
- 2.Laakso M, Aberg A, Savola J, Pentikainen PJ, Pyorala K. Diseases and drugs causing prolongation of the QT interval. Am J Cardiol. 1987;59:862–865. doi: 10.1016/0002-9149(87)91107-6. [DOI] [PubMed] [Google Scholar]
- 3.Winterton SJ, Turner MA, O'Gorman DJ, Flores NA, Sheridan DJ. Hypertrophy causes delayed conduction in human and guinea pig myocardium: accentuation during ischaemic perfusion. Cardiovasc Res. 1994;28:47–54. doi: 10.1093/cvr/28.1.47. [DOI] [PubMed] [Google Scholar]
- 4.Pratt CM, Ruberg S, Morganroth J, et al. Dose–response relation between terfenadine (Seldane) and the QTc interval on the scalar electrocardiogram: distinguishing a drug effect from spontaneous variability. Am Heart J. 1996;131:472–480. doi: 10.1016/s0002-8703(96)90525-6. [DOI] [PubMed] [Google Scholar]
- 5.Honig PK, Woosley RL, Zamani K, Conner DP, Cantilena LR., Jr Changes in the pharmacokinetics and electrocardiographic pharmacodynamics of terfenadine with concomitant administration of erythromycin. Clin Pharmacol Ther. 1992;52:231–238. doi: 10.1038/clpt.1992.135. [DOI] [PubMed] [Google Scholar]
- 6.Meierhenrich R, Helguera ME, Kidwell GA, Tebbe U. Influence of amiodarone on QT dispersion in patients with life-threatening ventricular arrhythmias and clinical outcome. Int J Cardiol. 1997;8:289–294. doi: 10.1016/s0167-5273(97)00073-9. [DOI] [PubMed] [Google Scholar]
- 7.Singh BN, Mody FV, Lopez B, Sarma JS. Antiarrhythmic agents for atrial fibrillation: focus on prolonging atrial repolarization; Amiodarone review. Am J Cardiol. 1999;84(9A):161R–173R. doi: 10.1016/s0002-9149(99)00718-3. [DOI] [PubMed] [Google Scholar]
- 8.Dillon SM, Allessie MA, Ursell PC, Wit AL. Influence of anisotropic tissue structure on reentrant circuits in the epicardial border zone of subacute canine infarcts. Circ Res. 1988;63:182–206. doi: 10.1161/01.res.63.1.182. [DOI] [PubMed] [Google Scholar]
- 9.Penny WJ, Sheridan DJ. Arrhythmias and cellular electrophysiological changes during myocardial ‘ischaemia’ and reperfusion. Cardiovasc Res. 1983;17:363–372. doi: 10.1093/cvr/17.6.363. [DOI] [PubMed] [Google Scholar]
- 10.Platia EV, Estes NAM, Heine DL, et al. Flecainide. Electrophysiologic and antiarrhythmic properties in refractory ventricular tachycardia. Am J Cardiol. 1985;55:956–962. doi: 10.1016/0002-9149(85)90726-x. [DOI] [PubMed] [Google Scholar]
- 11.Peters NS. Geometry of ventricular myocardium: myocyte interconnections and interstitial tissues. In: Sheridan DJ, editor. Left Ventricular Hypertrophy. Churchill Communication Europe Ltd: 1998. pp. 45–60. [Google Scholar]
- 12.Cooklin M, Wallis WR, Sheridan DJ, Fry CH. Changes in cell-to-cell electrical coupling associated with left ventricular hypertrophy. Circ Res. 1997;80:765–771. doi: 10.1161/01.res.80.6.765. [DOI] [PubMed] [Google Scholar]
- 13.Yi G, Crook R, Guo XH, Staunton A, Camm AJ, Malik M. Exercise-induced changes in the QT interval duration and dispersion in patients with sudden cardiac death after myocardial infarction. Int J Cardiol. 1998;28:271–279. doi: 10.1016/s0167-5273(97)00318-5. [DOI] [PubMed] [Google Scholar]
- 14.Viskin S. Long QT syndromes and torsade de pointes. Lancet. 1999;354:1625–1633. doi: 10.1016/S0140-6736(99)02107-8. 10.1016/s0140-6736(99)02107-8. [DOI] [PubMed] [Google Scholar]
- 15.Kennedy A, Thomas P, Sheridan DJ. Generalised seizures as the presentation of flecainide toxicity. Eur Heart J. 1989;10:950–954. doi: 10.1093/oxfordjournals.eurheartj.a059408. [DOI] [PubMed] [Google Scholar]


