Abstract
Aims
The purpose of this study was to describe the population pharmacokinetics of intravenous and oral tacrolimus (FK506) in 20 Asian paediatric patients, aged 1–14 years, following liver transplantation and to identify possible relationships between clinical covariates and population parameter estimates.
Methods
Details of drug dosage histories, sampling times and concentrations were collected retrospectively from routine therapeutic drug monitoring data accumulated for at least 4 days after surgery. Before analysis, patients were randomly allocated to either the population data set (n = 16) or a validation data set (n = 4). The population data set was comprised of 771 concentration measurements of patients admitted over the last 3 years. Population modelling using the nonlinear mixed-effects model (NONMEM) program was performed on the population data set, using a one-compartment model with first-order absorption and elimination. Population average parameter estimates of clearance (CL), volume of distribution (V) and oral bioavailability (F) were sought; a number of clinical and demographic variables were tested for their influence on these parameters.
Results
The final optimal population models related clearance to age, volume of distribution to body surface area and bioavailability to body weight and total bilirubin concentration. Predictive performance of this model evaluated using the validation data set, which comprised 86 concentrations, showed insignificant bias between observed and model-predicted blood tacrolimus concentrations. A final analysis performed in all 20 patients identified the following relationships: CL (l h−1) = 1.46 *[1 + 0.339 * (AGE (years) −2.25)]; V (l) = 39.1 *[1 + 4.57 * (BSA (m2)−0.49)]; F = 0.197 *[1 + 0.0887 * (WT (kg) −11.4)] and F = 0.197 *[1 + 0.0887 * (WT (kg) −11.4)]*[1.61], if the total bilirubin ≥ 200 µmol l−1. The interpatient variabilities (CV%) in CL, V and F were 33.5%, 33.0% and 24.1%, respectively. The intrapatient variability (s.d.) among observed and model-predicted blood concentrations was 5.79 ng ml−1.
Conclusions
In this study, the estimates of the pharmacokinetic parameters of tacrolimus agreed with those obtained from conventional pharmacokinetic studies. It also identified significant relationships in Asian paediatric liver transplant patients between the pharmacokinetics of tacrolimus and developmental characteristics of the patients.
Keywords: FK506, liver transplantation, NONMEM, paediatrics, population pharmacokinetics, tacrolimus
Introduction
Tacrolimus (FK506, Prograf) is a macrolide immunosuppressant used for the prevention of organ rejection after transplantation. It is a potent immunosuppressant and its safety and efficacy as a primary immunosuppressant in paediatric liver transplantation have been demonstrated [1, 2].
The pharmacokinetics of tacrolimus have been investigated extensively in adult liver transplant patients [3–7]. However, there are limited data on the pharmacokinetics of tacrolimus in paediatric liver transplant patients [8, 9]. This hampers the development of optimal treatment protocols, individualization of doses and successful utilization of therapeutic drug monitoring. These could affect the clinical outcomes especially since tacrolimus has a narrow therapeutic index, a large variation in pharmacokinetics within and between individuals; is subject to a range of metabolic drug interactions involving cytochrome P450; and produces adverse effects such as nephrotoxicity and neurotoxicity [10]. Thus the paucity of age-specific pharmacokinetic data subjects the paediatric liver transplant patient to greatest risk from the administration of tacrolimus without adequate knowledge of its disposition characteristics.
The technique of population pharmacokinetics was developed for the interpretation of the limited data available from a wide range of patients, rather than the extensive data from few subjects generated in typical pharmacokinetic studies [11]. The nonlinear mixed-effects model (NONMEM) population pharmacokinetic program [12] was used to assess information regarding the pharmacokinetic profile of tacrolimus in this fragile population. It allows for the development of a complete population pharmacokinetic model, including average pharmacokinetic parameters, covariates and the intra- and interindividual variability. Results from a population analysis will provide specific subpopulation parameters to be used in predictions. This is in contrast to using general population parameters, which may be inappropriate to achieve the target whole blood tacrolimus concentration range of 10–20 ng ml−1, a concentration range that has been found to be therapeutic in paediatric liver transplant inpatients after living-related liver transplant [8].
The purpose of this study was to investigate the disposition of tacrolimus in a group of 16 Asian paediatric liver transplant patients using a population pharmacokinetic analysis, and to elucidate any significant clinical or demographic effects that might necessitate dosage adjustments. To verify the predictive performance of the population pharmacokinetic model, subsequent tacrolimus blood concentrations were predicted for an independent group of four patients and then compared with the measured concentrations.
Methods
Study population and data collection
Data were obtained retrospectively from medical records and routine tacrolimus monitoring of 20 paediatric patients who underwent orthotopic liver transplantation between June 1996 and August 1999 at the National University Hospital of Singapore, Singapore. Information extracted from the medical records included date, time, postoperative day, dose of tacrolimus, tacrolimus blood concentration, age, height, current body weight, gender, liver function indices, renal function indices and haematocrit. The information was checked as thoroughly as possible for accuracy.
Tacrolimus administration
In four patients, oral tacrolimus was given preoperatively at a dose of 0.3 mg kg−1 day−1 for 1 day. Postoperative immunosuppressive therapy consisted of a combination of steroids and tacrolimus. In 10 patients, tacrolimus was administered i.v. intraoperatively at a dose of 0.05 mg kg−1, which was followed postoperatively by a 24 h continuous i.v. infusion at an initial dose of 0.05 mg kg−1 day−1 for 3–7 days. In 10 patients, tacrolimus was commenced enterally via a nasogastric tube starting on the second postoperative day. When oral intake was started, it was given at a dose of 0.2 mg kg−1 day−1 in two divided doses. Dosing adjustments were made based on patient responses, adverse effects and the trough drug concentrations.
Tacrolimus assay
Whole blood concentrations of tacrolimus were measured by a competitive binding microparticle enzyme immuno assay (MEIA) with a procedure using an Abbott IMx analyser (Abbott®, Chicago, IL, U.S.A.) [13]. The lower limit of quantification of the assay was 5 ng ml−1 and it was linear between 4.5 ng ml−1 to 30.0 ng ml−1. The between-day coefficient of variation (CV) of the assay was 16.0% at a concentration of 5 ng ml−1, 9.0% at a concentration of 10 ng ml−1, and 10.0% at a concentration of 20 ng ml−1. The within-day CV of the assay was 8.7% at a concentration of 5 ng ml−1, and 5.0% at the concentrations of 10 ng ml−1 and 20 ng ml−1.
Population pharmacokinetic modelling
The pharmacokinetics of tacrolimus were determined using a population approach in which concentrations from all patients were analysed simultaneously to produce estimates of the pharmacokinetic parameters. Blood concentration-time profiles in the database were used for nonlinear mixed effect modelling by extended least squares regression using the NONMEM computer program (Version IV, level 2.0), with double precision [12], installed on a Pentium II 300 MHz personal computer equipped with 32 Mb of random access memory (Aris, Exprez-series). Fortran subroutines were compiled under Microsoft FORTRAN Powerstation (Version 4.00).
Patients were assigned randomly to either an index group (n = 16) for development of the pharmacokinetic model(s), or to the validation group (n = 4) for the purpose of assessing the predictive performance of the derived model(s) with characteristics as shown in Table 1. The first-order estimation method was used to estimate population mean parameters, intersubject variability in these parameters and residual intrasubject variability between observed and predicted tacrolimus concentrations. The concentration-time course of tacrolimus was described by using a one-compartment model with first-order absorption and elimination. The model was parameterized in terms of clearance (CL), volume of distribution (V) and bioavailability and implemented using the data preprocessor NMTRAN and PREDPP. The absorption rate constant, ka of the model was fixed at 4.5 h−1, as a result of a sensitivity analysis carried out to determine the value of ka to be used in the NONMEM analysis.
Table 1.
Characteristics of patients included in the study. Results are presented as the number, or mean (range).
| Patients | Index group | Validation group |
|---|---|---|
| Number (M/F) | 16 (8/8) | 4 (2/2) |
| Age (years) | 3.7 (1.1–13.9) | 2.0 (1.2–4.0) |
| Height (cm) | 84.3 (68–116) | 80.5 (73–98) |
| Weight (kg) | 12.0 (6.9–20.5) | 10.3 (8.0–14.6) |
| Race | ||
| Chinese | 10 | 4 |
| Malay | 4 | |
| Indian | 2 | |
| Tacrolimus | ||
| Blood concentration (ng ml−1) | 12.7 (5.0–49.8) | 12.7 (5.0–30.0) |
| Number of samples | 771 | 86 |
| Median samples per patient | 44 (19–80) | 20 (6–40) |
Pharmacostatistic modelling
A constant coefficient of variation model was used to describe the deviations of tacrolimus clearance (CLj), volume of distribution (Vj) and bioavailability (Fj) of the jth individual from the true (but unknown) population mean values.
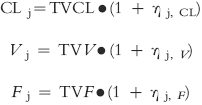 |
TVCL, TVV and TVF are the typical population mean values for CL, V and F, respectively. ηj, CL, ηj, V and ηj, F are random variables that distinguish the jth individual's parameter from the population mean as predicted by the regression model and are assumed to be independent and normally distributed with zero mean and variance ω2. The magnitude of interpatient variability in the structural parameters was expressed as a CV.
An additive model was used to describe the residual error (∈) between the observed (C) and the predicted (Cpred) concentration for the jth individual. These differences (∈ij) are attributable to intrapatient variability in pharmacokinetic parameters over time, assay error, sampling and dosing time errors, interoccasional variability, misspecification of the pharmacokinetic model and the influences of covariates which are either not included, or unknown.
Cij is the ith observed concentration for the jth individual. Cpred, ij is the blood tacrolimus concentration predicted by the pharmacokinetic model. ∈ij is a randomly distributed variable with zero mean and variance of σ2. The magnitude of residual variability was expressed as a standard deviation (s.d.).
Regression model
The initial analysis for the population pharmacokinetics of tacrolimus was conducted without including any patient covariates in the model (BASE 1). The value of the objective function (OBJF) from this model was then used as the reference in the subsequent univariate analyses whereby the influence of the patients' covariates on CL, V and F was individually assessed. The regression relationship for CL was modelled as follows for continuous covariates:
 |
and as follows for dichotomous covariates (assigned a value of 0 or 1):
with 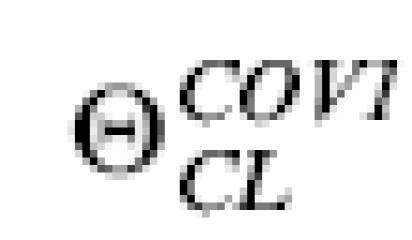 representing the regression coefficient to be estimated by the NONMEM analysis.
The following potential covariates were screened: patient age (AGE); weight (WT); height (HT); body surface area (BSA); gender (GEN); number of postoperative days (POD); alkaline phosphatase (APH); alanine amino transferase (ALT); aspartate amino transferase (AST); gamma glutamyl transferase (GGT); total bilirubin (TOTBIL); albumin (ALB); total protein (PROT); lactate dehydrogenase (LDH); serum creatinine (CREA); serum urea (UREA) and haematocrit (HCT). The models for the effect of the covariates on V and F were analogous to those for CL.
Statistical analysis
For each model, the improvement in the fit obtained on addition of a fixed effect variable into the overall model was assessed by several means. Hierarchic models were compared statistically using a likelihood ratio test. The change in the objective function value (ΔOBJF) produced by the inclusion of a covariate represents a statistic which is proportional to minus twice the log-likelihood of the data and approximates a χ2 distribution with degrees of freedom equal to the difference in the number of structural parameters (i.e. θs) between two models. For non-hierarchical models, the comparison was based on direct comparison of objective function values and on visual inspection of the residual plots. A change in OBJF of ≥ 7.88 is required to reach statistical significance (P = 0.005) for the addition of 1 fixed effect.
The goodness-of-fit of each model was also assessed by the examination of the scatterplot of weighted residuals vs predicted tacrolimus concentrations, the precision of the parameter estimate (i.e. % standard errors of the mean and 95% confidence interval) and by the magnitude of the interpatient and residual variability.
As a result of the univariate analysis, each model with significant effect (i.e. which satisfied all the above-mentioned criteria) was ranked according to its ΔOBJF compared with BASE 1. The model with the largest ΔOBJF was designated as BASE 2 and multiple regression analysis with forward selection was performed where covariates were incorporated into BASE 2 one by one, starting with the second largest ΔOBJF and continuing along the rank order established in the univariate analysis. Each covariate that caused a ΔOBJF of ≥ 7.88 was kept in the model. The model, BASE 3, containing all significant covariates was then subjected to stepwise, backwards elimination where each coefficient for a covariate was set to zero, in turn; the final model contained only those covariates whose omission caused an increase in OBJF of ≥ 7.88.
Model evaluation
To verify the predictive value of the population model, the measured tacrolimus concentrations in the validation group (n = 4) was compared with the corresponding predicted values by the population model using posthoc Bayesian forecasting. This was achieved by fixing the structural and variance model parameters to the values estimated in the final population model.
The predictive performance of the model was assessed in terms of bias (mean prediction error, ME) and precision (root mean square prediction error, RMSE) and the associated 95% confidence intervals [14]. Weighted residuals were plotted against the predicted concentrations to visually assess the deviations among pairs of model-predicted and observed blood tacrolimus concentrations in the validation group.
Results
Pharmacostatistic modelling
In the initial model, the data were better described with a one-compartment model with first-order absorption and elimination (subroutines ADVAN 2 TRANS 2) than one without considering first-order absorption (subroutines ADVAN 1 TRANS 2), as noted by a greater reduction of the objective function of 27.0 (P < 0.001) and an improvement in the precision in the estimation ω2F (coefficient of variation decreases from 422.8% to 48.3%). As most of the kinetic data were collected in the postabsorption phase, ka could not be reliably estimated; for this reason, its value was empirically estimated and then fixed throughout the analysis. A sensitivity analysis showed that the lowest estimate errors for the parameters were obtained by fixing ka to a value of 4.5 h−1 after testing in the basic model with ka values increasing in interval of 1 from 0.5 to 7.5 h−1.
For the residual variability, the OBJF with use of an additive, slope/intercept and power error models was 1016 lower than that with use of proportional and exponential error models. However, the standard errors of parameter estimates were higher for the slope/intercept and power models. Thus, an additive error model for residual variability was used in the basic pharmacokinetic model (BASE 1) to be used for further analysis.
Regression models
Results of the univariate analyses showing covariates with significant effects on CL, V and F of tacrolimus in paediatric patients are presented in Table 2. The regression relationship for total bilirubin on F was estimated initially using models for a continuous covariate, the best of which satisfied four out of the five criteria for model discrimination. Thus a categorical ‘cutoff’ model was used, which caused the model to satisfy all the criteria used in model discrimination. Hence, this relationship was used to model the effect of total bilirubin on F. The covariate model causing the largest reduction in OBJF (i.e. linear model of weight on F) was declared as BASE 2, which acted as a reference model for the subsequent analysis of building a more complex model.
Table 2.
Summary of univariate analysis showing covariate models with significant effects on CL, V or F of tacrolimus.
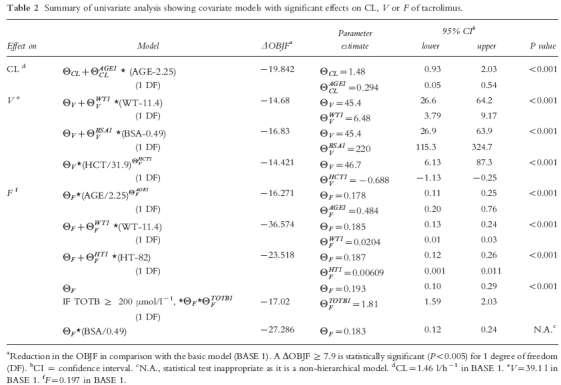
The results of multivariate analyses with forward selection, incorporating the covariates with significant effects into BASE 2 one by one in decreasing order of reduction in OBJF are presented in Table 3. In the presence of the effect of weight on F, body surface area and height no longer had a significant effect on F. However, the effects of age on CL, total bilirubin on F and body surface area on V remained significant. In the subsequent models, the effects of age on F, weight and haematocrit on V were no longer significant. Thus, a model incorporating the effects of age on CL, body surface area on V, weight and total bilirubin on F was selected as BASE 3.
Table 3.
Summary of multivariate analyses with forward selection.
| Effect | ΔOBJFa | Improvementb |
|---|---|---|
| Weight on F | – | – |
| (BASE 2) | ||
| Body surface area on F | 2.728 | No |
| Height on F | −1.283 | No |
| Age on CL | −30.037 | Yes |
| Total bilirubin on F | −8.294 | Yes |
| Body surface area on V | −19.892 | Yesc |
| Age on F | 4.109 | No |
| Weight on V | 6.787 | No |
| Haematocrit on V | −3.297 | No |
Change in OBJF in comparison to preceding model with an advantage.
Improvement on preceding model with significant effect (based on ΔOBJF and 95% confidence interval).
This model which incorporates the effects of age on CL, body surface area on V, weight and total bilirubin on F was selected as BASE 3.
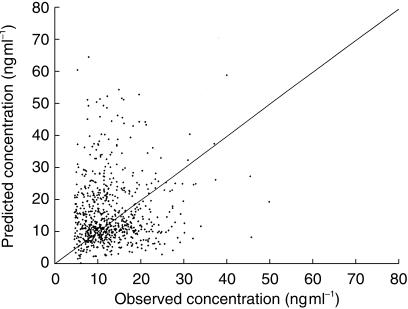
Backward elimination from BASE 3 showed that the effects of age on CL, body surface area on V, body weight and total bilirubin on F remained statistically significant; the model incorporating these factors was declared the final model for tacrolimus population pharmacokinetics. An adequate correlation between predicted and observed whole blood tacrolimus concentrations was observed in the final model as shown in Figure 1.
Figure 1.
Scatterplot of predicted vs observed tacrolimus whole blood concentration in the population (index) group (n = 16 patients) of the final model.
Model evaluation
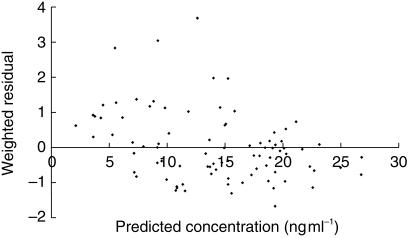
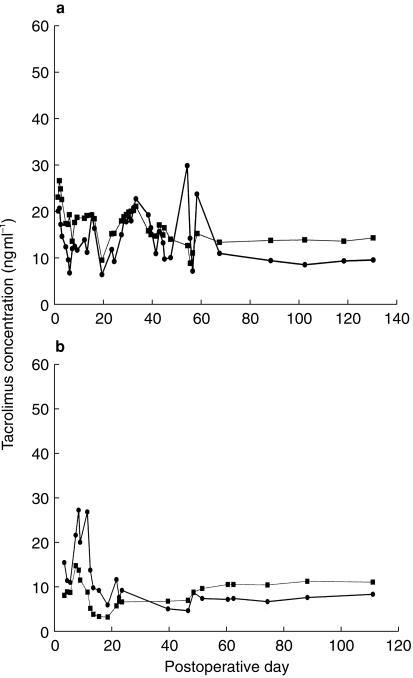
Mean prediction error (ME) between measured and predicted blood tacrolimus concentrations in the validation group (n = 4) of paediatric liver transplant patients was 1.4 ng ml−1 (95% CI: −0.025,2.81). Thus, there was a statistically insignificant bias between the measured and predicted blood tacrolimus concentrations. The root mean square error (RMSE) associated with the validation group was 6.7 ng ml−1 (95% CI: 5.58,7.68), which is similar to the intrapatient s.d. for the population group of 5.8 ng ml−1. The scatterplot of weighted residual vs predicted whole blood tacrolimus concentration (Figure 2) showed that the weighted residuals were randomly distributed and lay mostly within ± 2 units of the null ordinate of perfect agreement. Specific examples of the predictive capability of the final optimal model are shown for two representative individual patients in the validation dataset in Figure 3, which shows the time-course of measured and posthoc predicted whole blood tacrolimus concentrations.
Figure 2.
Predictive performance of the final model (n = 4 patients). Scatterplot of weighted residual vs predicted tacrolimus whole blood concentration.
Figure 3.
Longitudinal assessment of the predictive performance of the final population model in 2 representative patients from the validation dataset: (a) 1 year-old male (b) 1 year-old female. (•) observed and (▪) model-predicted whole blood tacrolimus concentration.
Final population pharmacokinetic model
The final computed population parameter estimates, the interpatient and residual variability and the precision of the estimates obtained by fitting the full dataset are presented in Table 4. For a hypothetical patient with population median values of age, body surface area and body weight (i.e. 2.25 year-old, 0.49 m2 and 11.4 kg), the model-predicted CL, V and F would be 1.46 l h−1, 39.1 l and 0.197, respectively. The F would increase by 61% to 0.317 if the total bilirubin was ≥ 200 µmol l−1. The model for CL found that CL changed by 34% for every 1 year above and below 2.25 years (the median age), resulting in an estimated range of 0.88–7.23 l h−1 across the age range of 1.07–13.9 years. The model for V indicated that V changed by 46% for every 0.1 m2 above and below 0.49 m2 (the median body surface area), which resulted in an estimated range of 15.9–96.3 l across the body surface area range of 0.36–0.81 m2. The model for F showed that it changed by 0.09% for every 1 kg above and below 11.4 kg (the median body weight) giving an estimated range of 0.118–0.356 across the body weight range of 6.9–20.5 kg.
Table 4.
Postliver transplantation population pharmacokinetics of tacrolimus after intravenous and oral administration in Asian paediatric patients.
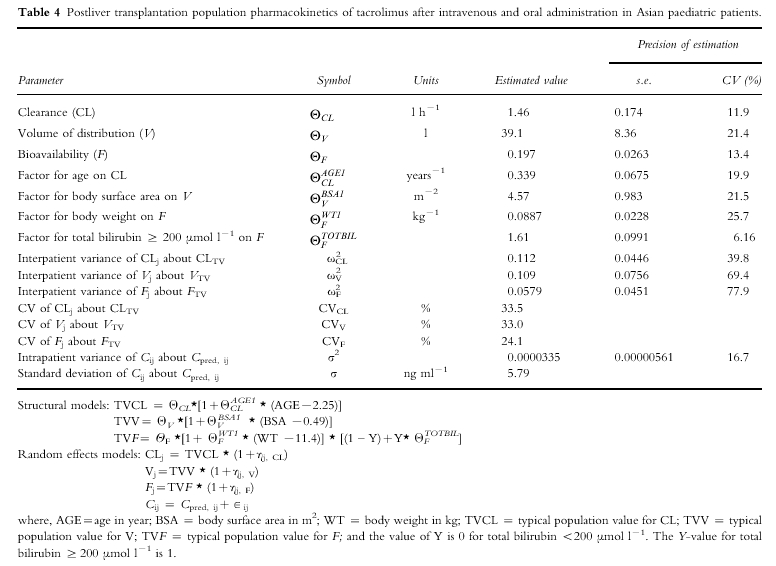
The interpatient variability (CV%) for the population pharmacokinetic parameters of CL, V and F was large and ranged from 24% to 34% (Table 4). The intrapatient s.d. was 5.79 ng ml−1, which translates to a CV% of 45.6% at the mean blood concentration of tacrolimus (12.7 ng ml−1) measured in the population dataset. The imprecision (calculated by dividing the standard error of each parameter by its value and expressed as a percentage) in estimating the random effect parameter estimates was greater than that of the fixed effect parameter estimates.
Discussion
In this study, the pharmacokinetics of tacrolimus were investigated in Asian paediatric liver transplant patients by a population modelling approach. This is particularly suitable as ethical and logistical restrictions involved in studying children prohibit excessive blood sampling, compared with traditional pharmacokinetic studies [15]. Large physiological and maturational changes occur in paediatric patients as they are in a rapid stage of development, thus producing potentially greater impact on the pharmacokinetics and therefore may be at greater risk from inappropriate dosing. However, it must be noted that while this approach allows the development of a population model and the identification of potential covariates, the results needs to be verified in prospective pharmacokinetic studies.
Tacrolimus is extensively metabolized in the liver and undergoes biliary excretion [10]. In this study, part of the interindividual variability in CL was explained by differences in the age of the patient. The interindividual variability of CL in BASE 1 was 53.9%; however, on considering the patient's age, this variability was reduced to 33.5%. From the general principles of developmental pharmacology [16, 17], it would be expected that a highly lipophilic drug, such as tacrolimus, eliminated primarily by biotransformation, will show age-related differences in its pharmacokinetics. In addition, as a result of dosage problems and rapid changes in clinical condition, growth and maturation would cause further intraindividual differences.
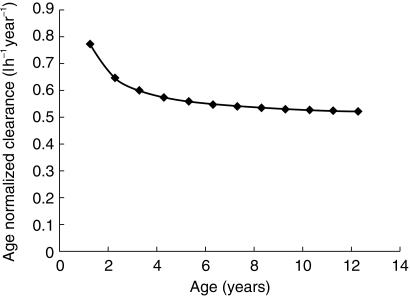
The mean population CL value of tacrolimus found in this study was 0.125 l h−1 kg−1 (obtained by normalizing the mean population CL value of 1.46 l h−1 by the population mean body weight of 11.65 kg for the 20 patients), which closely agreed with the 0.138 l h−1 kg−1 obtained by a traditional approach used by Wallemacq et al. [9] in paediatric patients. This is about twice the mean CL of 0.0541 l h−1 kg−1[6] and 0.0528 l h−1 kg−1[3] previously estimated in adult liver transplant recipients, and could account for the findings that paediatric patients require higher doses of tacrolimus on a mg kg−1 basis than adults [18, 19]. The dependence of tacrolimus CL normalized for age with age (Figure 4) indicates a decrease in age-normalized CL with increasing age. The physiological basis for age-related decrease in age-normalized CL is unknown but may be related to changes in hepatic metabolic function with age. Studies of alterations in rates of hepatic metabolism for a wide variety of pharmacologic agents as a function of increasing age have indicated that, whereas nonmicrosomal metabolism and Phase II conjugation processes are minimally affected, the activity of the microsomal mixed function oxidase (MFO) system decreases progressively with increasing age [20]. Thus the hepatic metabolism of tacrolimus decreases with increasing age as tacrolimus can undergo biotransformation both by the MFO and conjugation [10]. Many drugs that are biotransformed by oxidation are more rapidly metabolized during childhood than in adulthood, particularly if the drug clearance is normalized to bodyweight. Examples of drugs with higher rates of biotransformation during childhood include theophylline, caffeine, phenobarbital and phenytoin. The activities of many components of the mono-oxygenase system are higher in children under 12 years of age and to a lesser extent during puberty, than in adults [17].
Figure 4.
Profile of age-normalized clearance (predicted by the population model) vs age of patient.
As reported in a previous paediatrics study [8], the CL of tacrolimus correlated with the number of postoperative day (POD) and body size (expressed as body weight raised to the power of 0.29). The correlation with POD was attributed to change in hepatic function with POD, but in the present study no such correlation was found. A previous population pharmacokinetic analysis of tacrolimus in adults [7] showed that mild to moderate hepatic dysfunction did not affect the CL of tacrolimus, which was also found in our paediatric patients. However, it should be noted that only one patient in our population dataset suffered from severe hepatic dysfunction over a sustained period.
Indices of renal function (serum creatinine and serum urea), gender, body surface area, haematocrit and albumin had no significant effect on the CL of tacrolimus. The lack of effect of indices of renal function on CL is plausible since the renal clearance of tacrolimus accounts for less than 1% of total systemic clearance [21]. Tacrolimus is a low-clearance drug; the extraction ratio is equivalent to about 3% of liver blood flow [22]. For a highly bound, low-extraction ratio drug like tacrolimus, clearance would be affected by changes in haematocrit and plasma protein binding. Indeed, trough whole-blood concentration of tacrolimus after renal transplantation correlate with haematocrit and albumin during the first weeks of treatment and its relative clearance was negatively correlated with haematocrit and albumin [23]. The lack of significant effect of haematocrit and albumin on CL in the current study could be attributed to the limited range of haematocrit and albumin concentrations in our patients.
Part of the interindividual variability in the V of tacrolimus was explained by differences in the body surface area of the patient. The interindividual variability of V in BASE 1 was 61.2%; however, on considering the patient's body surface area, this variability in V was reduced to 33.0%. Therefore, body surface area is a good indicator of the volume of distribution in this group of paediatric patients. Body weight raised to a power of 0.29 is used as an indicator of body size to model the influence of body weight on V in a previous report in paediatric liver transplant patients [8]. Although both the body weight and body surface area had significant effects on V during the univariate analysis in this study, body surface area was found to be a better predictor of V than body weight. This may be because the body weight measured in these patients is not an accurate reflection of lean body mass as most of the time there is an accumulation of extracellular fluid (in the form of ascites fluid) in these patients. Thus, the body weight in this group of patients is variable and is susceptible to fluctuating values depending on the clinical condition of the patient. Thus, the incorporation of body height with body weight in the form of body surface area gives a better indicator of body size and hence predictor of V, as height is not susceptible to wide fluctuations in values.
The mean population V value of tacrolimus found in this study was 3.36 l kg−1 (obtained by normalizing the mean population V value of 39.1 l by the population mean body weight of 11.65 kg for the 20 patients). This is in reasonable agreement with the V values of 2.6 l kg−1 and 41.41 l determined in a traditional pharmacokinetic study in paediatric patients by Wallemacq et al. [9] and a population pharmacokinetic study by Yasuhara et al. [8], respectively. However, this is about three times the mean value of V of 0.906 l kg−1 reported in the adult liver transplant recipients [6]. The V decreases with increasing age, which may be due to age-related changes in binding substances such as haematocrit with age [24], which would affect the distribution of the drug within the body. This is because tacrolimus is extensively distributed into red blood cells, and the whole blood to plasma ratio ranges are greater than 30–10 over low to high plasma concentrations [25, 26]. Therefore, changes in haematocrit would alter the distribution of tacrolimus between blood and fat since it is a lipophilic compound. The highest normal haematocrit value (0.61 l l−1) is seen in newborns, followed by a gradual decrease to reach a nadir at 2 months of age. The haematocrit then increases until normal adult values (about 0.45 l l−1) are reached at 14 years of age. Thus, the increase in the haematocrit from 2 months to 14 years of age could decrease the partitioning of tacrolimus into fat, thereby decreasing its distribution. This hypothesis is supported by the finding that haematocrit was a significant covariate affecting V during the univariate analysis; an increase in haematocrit resulted in a decrease in V, via a power function. However, this model failed to be included in BASE 3 during subsequent multivariate analysis with forward addition. This does not mean that the haematocrit is not important; it simply reflects a lack of variability within the patient group that is not already accounted for by the effect of body surface area on V. If a wider range of haematocrit had been present, it is likely that haematocrit would have had a significant influence on V.
Gender of the patient has no effect on V of tacrolimus as shown in this study. Adult females have a higher proportion of body weight as fat than males, therefore gender-related difference in V might be anticipated for tacrolimus. However, all patients were prepubertal, which may explain the lack of gender-related differences in body fat content in our patients.
Part of the interindividual variability in the F of tacrolimus was explained by differences in the body weight and total bilirubin. The interindividual variability of F in BASE 1 was 35.2%; however, on including the patient's body weight and total bilirubin, this variability is reduced to 24.1% in the final population model. Thus the F of tacrolimus is affected by two factors: the development and growth of the patient, and the liver function of the patient.
Since the extent of drug absorption is proportional to the area available for absorption, bowel length is a determinant of drug absorption, such as found for cyclosporin [27]. Hence, the dependence of F on the development and growth of the paediatric patient is not surprising as the gastrointestinal tract undergoes considerable developmental changes during the first years of life [28]. It has been found that the main factor contributing to increasing bowel length up to about 4 years of age is increasing body size [29]. Predictors of body size such as body weight, height and surface area were all significant covariates affecting the F during the univariate analysis, but only body weight remained as a significant covariate during subsequent multivariate analysis. The discrepancy between the V and F models using different covariates as indicators of body size can be attributed to nondevelopmental factors affecting the bowel length such as surgical excision of part of the bowel during liver transplantation, or during Kansai portoenterostomy.
The liver function of the patient as indicated by the total bilirubin is found to affect the F of tacrolimus. Paediatric patients with a total bilirubin ≥ 200 µmol l−1 had a 61% greater F compared with those with lesser concentrations of bilirubin. This may be due to reduced first-pass effect in patients with hepatic dysfunction compared with patients with normal hepatic function resulting in higher bioavailability. This is supported by the finding in a study that a higher oral F of 36% was noted in patients with moderate to severe liver impairment after infusion of tacrolimus 0.15 mg kg−1 or an oral dose of 0.15 mg kg−1 [30]. The mean population F calculated in the present study compared favourably with the value of 0.19 obtained by Yasuhara et al. [8] using a population pharmacokinetic approach, the value of 0.25 obtained by Wallemacq et al. [9] in paediatric patients using a traditional pharmacokinetic study. Mean values of 0.25 and 0.238 were reported in adult liver transplant patients in a traditional pharmaco kinetic study [6], and in a population pharmacokinetic study [7], respectively. Thus, tacrolimus has a relatively low oral F both in paediatric and adult liver transplant patients.
The residual (unexplained) variability was quite large, reflecting perhaps large intraindividual variability in the pharmacokinetics, interoccasion variability, assay errors, sampling time errors and model misspecification. This variability may be reduced if a prospective study design is used which provides tighter control on some of the above factors.
In this study, the found effects of covariates on the pharmacokinetic parameters of tacrolimus in paediatric liver transplant patients are due to a difference of covariates between patients and the change within a patient for that covariate. This is because in many patients, the data were collected for a duration of several months, which will result in changes of covariate values within a patient. One limitation of the current study is that only a small number of patients (n = 20), though with much data was studied, and the ability to encounter and quantify many covariates is quite limited in such a small group. Hence this population model can be tested and refined using data from future prospective studies with more subjects, and this may have the potential to result in appropriate dosing recommendations.
In conclusion, this study has determined the population pharmacokinetics of tacrolimus in Asian paediatric liver transplant patients using retrospective, routine monitoring data. Sources of interindividual variability in CL, V and F of tacrolimus have been identified and quantified. The robustness of the derived pharmacokinetic parameters has been evaluated in an independent group of patient.
Acknowledgments
The authors gratefully acknowledge the assistance provided by Mr H.S. Lin during the course of this work, and to Professor L Sheiner and Dr E Gibiansky for their comments on the data analysis.
References
- 1.Tzakis AG, Reyes J, Todo S, et al. Two-year experience with FK 506 in pediatric patients. Transplant Proc. 1993;25:619–621. [PMC free article] [PubMed] [Google Scholar]
- 2.Inomata Y, Tanaka K, Egawa H, et al. The evolution of immunosuppression with FK506 in pediatric living-related liver transplantation. Transplantation. 1996;61:247–252. doi: 10.1097/00007890-199601270-00015. [DOI] [PubMed] [Google Scholar]
- 3.Lee C, Jusko W, Shaefer M, et al. Pharmacokinetics of tacrolimus FK506 in liver transplant patients. Clin Pharmacol Ther. 1993;53:181. doi: 10.1016/0009-9236(95)90153-1. [DOI] [PubMed] [Google Scholar]
- 4.Undre N, Möller A. The FK506 European Study Group: Pharmacokinetic interpretation of FK506 levels in blood and in plasma during a European randomised study in primary liver transplant patients. Transplant Int. 1994;7(Suppl 1):S15–S21. doi: 10.1111/j.1432-2277.1994.tb01303.x. [DOI] [PubMed] [Google Scholar]
- 5.Jain AB, Abu-Elmagd K, Abdallah H, et al. Pharmacokinetics of FK506 in liver transplant recipients after continuous intravenous infusion. J Clin Pharmacol. 1993;33:606–611. doi: 10.1002/j.1552-4604.1993.tb04712.x. [DOI] [PMC free article] [PubMed] [Google Scholar]
- 6.Jusko WJ, Piekoszewski W, Klintmalm GB, et al. Pharmacokinetics of tacrolimus in liver transplant patients. Clin Pharmacol Ther. 1995;57:281–290. doi: 10.1016/0009-9236(95)90153-1. [DOI] [PubMed] [Google Scholar]
- 7.Mekki QA, Lee C. Population pharmacokinetics of tacrolimus (FK506) in liver transplant patients. Clin Pharmacol Ther. 1994;55:162. doi: 10.1016/0009-9236(95)90153-1. [DOI] [PubMed] [Google Scholar]
- 8.Yasuhara M, Hashida T, Toraguchi M, et al. Pharmacokinetics and pharmacodynamics of FK506 in pediatric patients receiving living-related donor liver transplantations. Transplant Proc. 1995;27:1108–1110. [PubMed] [Google Scholar]
- 9.Wallemacq PE, Furlan V, Möller A, et al. Pharmacokinetics of tacrolimus (FK506) in paediatric liver transplant recipients. Eur J Drug Metab Pharmacokinet. 1998;3:367–370. doi: 10.1007/BF03192295. [DOI] [PubMed] [Google Scholar]
- 10.Venkataramanan R, Swaminathan A, Prasad T, et al. Clinical pharmacokinetics of tacrolimus. Clin Pharmacokinet. 1995;29:404–430. doi: 10.2165/00003088-199529060-00003. [DOI] [PubMed] [Google Scholar]
- 11.Whiting B, Kelman A, Grevel J. Population pharmacokinetics: theory and applications. Clin Pharmacokinet. 1986;11:387–401. doi: 10.2165/00003088-198611050-00004. [DOI] [PubMed] [Google Scholar]
- 12.Boeckmann AJ, Sheiner LB, Beal SL. NONMEM Users Guide. San Francisco: University of California; 1992. NONMEM Project Group. [Google Scholar]
- 13.Grenier FC, Luczkiw J, Bergmann M, et al. A whole blood FK506 assay for the IMx® analyzer. Transplant Proc. 1991;23:2748–2749. [PubMed] [Google Scholar]
- 14.Sheiner LB, Beal SL. Some suggestions for measuring predictive performance. J Pharmacokinet Biopharm. 1981;9:503–513. doi: 10.1007/BF01060893. [DOI] [PubMed] [Google Scholar]
- 15.Kauffman RE, Kearns GL. Pharmacokinetic studies in paediatric patients – clinical and ethical considerations. Clin Pharmacokinet. 1992;23:10–29. doi: 10.2165/00003088-199223010-00002. [DOI] [PubMed] [Google Scholar]
- 16.Yaffe SJ, Aranda JV, editors. Paediatric Pharmacology: Therapeutic Principles in Practice. 2. Philadelphia: W.B. Saunders; 1992. [Google Scholar]
- 17.Radde IC, MacLeod SM, editors. Paediatric Pharmacology and Therapeutics. 2. St Louis: Mosby Press; 1993. pp. 57–86. [Google Scholar]
- 18.Jain AB, Fung JJ, Tzakis AG, et al. Comparative study of cyclosporine and FK506 dosage requirements in adult and pediatric orthotopic liver transplant patients. Transplant Proc. 1991;23:2763–2766. [PMC free article] [PubMed] [Google Scholar]
- 19.McDiarmid SV, Colonna JO, Shaked A, et al. Differences in oral FK506 dose requirements between adult and pediatric liver transplant patients. Transplantation. 1993;55:1328–1332. doi: 10.1097/00007890-199306000-00022. [DOI] [PubMed] [Google Scholar]
- 20.Munson PL, Mueller RA, Breese GR, editors. Chapman & Hall: International Thomson Publishing; 1996. Principles of pharmacology –basic concepts and clinical applications. [Google Scholar]
- 21.Venkataramanan R, Jain A, Warty VS, et al. Pharmacokinetics of FK506 in transplant patients. Transplant Proc. 1991;23:2736–2740. [PMC free article] [PubMed] [Google Scholar]
- 22.Undre NA, Stevenson P, Schäfer A. Pharmacokinetics of tacrolimus: Clinically relevant aspects. Transplant Proc. 1999;31(Suppl 7A):21S–24S. doi: 10.1016/s0041-1345(99)00788-5. 10.1016/s0041-1345(99)00118-9. [DOI] [PubMed] [Google Scholar]
- 23.Undre NA, Schäfer A the European Tacrolimus Multicentre Renal Study Group. Factors affecting the pharmacokinetics of tacrolimus in the first year after renal transplantation. Transplant Proc. 1998;30:1261–1263. doi: 10.1016/s0041-1345(98)00234-6. 10.1016/s0041-1345(98)00234-6. [DOI] [PubMed] [Google Scholar]
- 24.Natha DG, Oski FA, editors. Hematology in Infancy and Childhood. Philadelphia: W.B. Saunders Co.; 1987. p. 266. [Google Scholar]
- 25.Jusko WJ, D'Ambrosio R. Monitoring tacrolimus concentrations in plasma and whole blood. Transplant Proc. 1991;23:2732–2735. [PubMed] [Google Scholar]
- 26.Bäckman L, Nicar M, Levy M, et al. FK506 trough levels in whole blood and plasma in liver transplant recipients: correlation to clinical events and side effects. Transplantation. 1994;57:519–525. [PubMed] [Google Scholar]
- 27.Whitington P, Emond J, Whitington S, et al. Small-bowel length and the dose of cyclosporine A in children after liver transplantation. N Engl J Med. 1990;322:733–738. doi: 10.1056/NEJM199003153221105. [DOI] [PubMed] [Google Scholar]
- 28.Motil KJ. Development of the gastrointestinal tract. In: Wyllie R, Hyams JS, editors. Paediatric Gastrointestinal Disease: Pathophysiology, Diagnosis, Management. Philadelphia: W.B. Saunders Co.; 1993. pp. 3–15. [Google Scholar]
- 29.Seibert JR. Small-intestinal length in infants and children. Am J Dis Child. 1980;134:593–595. doi: 10.1001/archpedi.1980.02130180051015. [DOI] [PubMed] [Google Scholar]
- 30.Jain AB, Venkataramanan R, Cadoff E, et al. Effect of hepatic dysfunction and T tube clamping on FK506 pharmacokinetics and trough concentrations. Transplant Proc. 1990;22(Suppl 1):57–59. [PMC free article] [PubMed] [Google Scholar]


