

Abstract
Aims
To develop a population model that can describe the pharmacokinetic profile of microencapsulated octreotide acetate in healthy cholecystectomized subjects. To investigate the correlation between serum IGF-1 and octreotide concentration.
Methods
A population pharmacokinetic analysis was performed on octreotide data obtained following a single dose of 30 mg microencapsulated octreotide acetate intramuscularly. The relationship between serum IGF-1 concentration and octreotide concentration was effectively described by a population pharmacokinetic/pharmaco-dynamic model.
Results
The pharmacokinetic profile of octreotide was characterized by an initial peak of octreotide followed by a sustained-release of drug. Plateau concentration were sustained up to day 70, and gradually declined to below the detection limit by day 112. A one-compartment linear model was constructed which consisted of two absorption processes, characterized by KIR and KSR, rate constants for immediate-release and sustained-release, respectively, with first-order elimination (Ke; 1.05 h−1). The surface, unencapsulated drug was immediately absorbed into the central compartment with first-order absorption (KIR 0.0312 h−1), while the microencapsulated drug was first released in a zero-order fashion into a depot before being absorbed into the central compartment with first-order absorption (KSR; 0.00469 h−1) during a period of τ (1680 h). Body weight and gender were important covariates for the apparent volume of distribution. The type of formulation was an important covariate for KIR but had no effect on KSR. An inhibitory Emax population pharmacokinetic/pharmacodynamic model could adequately describe the relationship between IGF-1 (expressed as percent baseline) and octreotide concentration. Baseline IGF-1 concentration was found to be a significant covariate for the baseline effect (E0). A relationship between GH concentration and octreotide concentration was not established.
Conclusions
The pharmacokinetic profile of microencapsulated octreotide acetate was effectively described by the derived population model. The relationship between IGF-1 and drug concentration could be used to guide optimization of therapeutic octreotide dosage regimens.
Keywords: cholecystectomized, IGF-1, microencapsulated octreotide acetate, population PK/ PD
Introduction
Octreotide acetate is a synthetic octapeptide, which suppresses secretion of peptide hormones and neurotrans-mitters in a fashion similar to the endogenous Somato-Statins. Octreotide exerts inhibitory effects on the release of pituitary and gastro-entero-pancreatic hormones (i.e. growth hormone (GH), thyroid stimulating hormone (TSH), insulin, glucagon, cholecystokinin, vasoactive intestinal peptide and gastrin), inhibits secretion of gastric acid and pancreatic enzymes, and decreases gallbladder contractility [1, 2]. Subcutaneous injection of octreotide acetate leads to symptomatic control in patients with acromegaly and some gastro-entero-pancreatic tumours [3]. To be fully effective, plasma octreotide concentrations need to be maintained above an individual GH threshold (EC50 ∼ 150–800 pg ml−1), thus necessitating three times daily dosing [4].
To improve patient convenience and compliance, octreotide acetate has been reformulated recently into microspheres of a biodegradable polymer (poly(dl-lactide-coglycolide) d-(+) glucose). Drug release occurs slowly as cleavage of the polymer ester linkage takes place primarily through tissue fluid hydrolysis. This formulation allows for a single monthly intragluteal injections with sustained release of octreotide. In preliminary efficacy studies, multiple single monthly injections have been shown to have therapeutic utility in the long term treatment of patients with acromegaly via maintained suppression of GH secretion [5, 6].
Physiologic GH concentrations have significant metabolic effects. It has been hypothesized that GH may facilitate the progression of various disease states. These pathological effects may occur by either direct GH stimulation or indirectly by the elevation of insulin-like growth factor-1 (IGF-1). For more than 30 years, the importance of GH in the development and progression of diabetic retinopathy has been recognized [7, 8]. Recently, there has been a growing interest in IGF-1 and its binding proteins (IGFBP) in proliferative diseases and the potential of altering the course of the disease by reducing IGF-1 concentrations. A model describing the relationship between the pharmacokinetic (PK) and pharmacody-namics (PD) of octreotide in nonacromegalic patients would be useful in predicting its dose—response relationship since many preventative studies do not allow for comprehensive dose-ranging evaluations.
Two studies were performed in healthy cholecystecto-mized adults using two formulations of octreotide representing minor variations in the preparative processes for microencapsulated octreotide that were bioequivalent for drug release from the microspheres. The primary objective of this work was to characterize the population pharmacokinetics of octreotide following a single intramuscular injection of microencapsulated octreotide acetate. The secondary objective of this work was to investigate the relationship between serum IGF-1 concentrations and octreotide concentrations using population pharmacokinetic/pharmacodynamic modelling. Additionally, the relationship between serum IGF-1 and IGFBP-3 was explored.
Methods
Study design and subject demographics
Two studies were conducted in which the PK, PD, and safety of octreotide were evaluated in healthy cholecys-tectomized subjects. In the first study, 30 of 59 subjects received a single 30 mg intramuscular (i.m.) dose of microencapsulated octreotide acetate formulation (A), while the other subjects (n = 29) received a second formulation (B). Owing to difficulties in preparing a homogeneous suspension, A was reformulated and designated C. The latter was then administered to the same subjects who participated in the first study. Fifty-one of the 59 original subjects participated in a second study. Those subjects who had previously received A were administered B (n = 29), while the subjects who had previously received B were given the reformulated C (n = 22).
In both studies, subjects were admitted to the study facility 14 h prior to test drug administration for baseline evaluation. After an overnight fast, all subjects received a single intragluteal i.m. injection of octreotide acetate (30 mg) in the early morning, continued to fast until 1 h after dosing, and remained domiciled for 36 h after dosing. Subjects returned on specified days during a 63 and 112 day follow-up period in studies 1 and 2, respectively.
Blood samples for the measurement of serum octreotide concentrations were obtained at baseline, 0, 1, 1.5, 2, 4, 6, 9, 12, 18, 24, 36 and 48 h after the dose. On days 7, 10, 14, 17, 21, 28, 35, 42, 45, 49, 52, 56, 60, 63, 70, 77, 84, 91, 98, 105 and 112, blood samples were taken between 06.00 h and 10.00 h in the morning. On day 28, blood samples were obtained at approximately 08.00 h with continued collection for 1, 2, 3, 4, 5, 6, 7 and 8 h thereafter. Blood samples for the measurement of serum concentrations of GH, IGF-1 and IGFBP-3 were taken at baseline, on days 7, 14, 21, 28, 35, 49, 63, 84 and 112 between 06.00 h and 10.00 h in the morning.
Healthy subjects (7 males, 52 females) with prior cholecystectomy gave written informed consent to participate in this study after being fully informed of the purpose and potential risks involved. Each study was performed at the same three separate centres: GFI Pharmaceutical Services, Evansville, IN, PPD-Pharmaco, Austin, TX and Arkansas Research Medical Testing Center, Little Rock, AR.
The subjects had a mean age of 44 years and a mean weight of 78 kg. Fifty-one were Caucasian, six were African-American, and two were Hispanic (Table 1). The use of a prescription medication within 1 month prior to dosing or use of over-the-counter medications or vitamins for 7 days prior to dosing were criteria for exclusion from the study.
Table 1.
Summary of subject demographics.
| Demographic Variable | Statistic | Subjects |
|---|---|---|
| Age (years) | Mean ± s.d. | 43.5 ± 10.2 |
| Range | 19–55 | |
| Sex | Male | 7 (11.9%) |
| Female | 52 (88.1%) | |
| Race | Caucasian | 51 (86.4%) |
| Black | 6 (10.2%) | |
| Hispanic | 2 (3.4%) | |
| Height (cm) | Mean ± s.d. | 166.5 ± 9.2 |
| Range | 149.5–188.0 | |
| Weight (kg) | Mean ± s.d. | 77.7 ± 13.9 |
| Median | 80.7 | |
| Range | 51.1–103.0 | |
| Body frame | Small | 12 (20.3%) |
| Medium | 40 (67.8%) | |
| Large | 7 (11.9%) | |
| BMI (kg m−2) | Mean ± s.d. | 28.1±4.8 |
| Range | 17.4–35.5 |
Assays ofoctreotide, GH, IGF-1, and IGFBP-3
All samples were stored at − 20 °C until analysis. Samples were analysed using a radioimmunoassay (r.i.a.) method in which the unknown octreotide concentration is determined by displacement of a 125I-d-Tyr analogue of octreotide in a rabbit antiserum-antigen complex. Radiolabeled standard and antibody were allowed to react with the serum (standard, control or unknown) in a phosphate buffered saline (PBS pH 7.2) overnight (18–24 h) at approximately 4°C. Antibody-bound drug was separated from free drug by the addition of chilled charcoal slurry. After centrifugation, the 125I-radioactivity of the supernatant was counted for 1 minute on a Packard Cobra II Gamma counter. During prestudy validation of the RIA within-assay and between-assay variability were determined, respectively, as follows: 2.5 ng ml−1 (4.7% and 11.6%), 0.25 ng ml−1 (3.4% and 4.0%) and 0.025 ng ml−1 (5.2% and 10.0%). The lower limit of quantification (LLOQ) for the determination ofoctreotide was set at 40 pg ml−1. The LLOQ was defined as the concentration of the lowest acceptable quality control sample on a given analysis day. An acceptable quality control sample was defined as having a determined concentration within 20% of the theoretical value (25% at the LLOQ). Additionally, gravimetric analysis of residual drug was performed to determine the actual dose delivered in relation to the target dose of 30 mg [9].
Total serum GH concentrations were determined by an immunochemiluminometric assay (Human GH chemi-luminescence assay kit insert, Nichols Institute, San Juan Capistrano, CA) and IGFBP-3 and IGF-1 (1 nm = 7.65 ng ml−1) concentrations were quantified by radioimmunoassays [10, 11].
Data analysis
The data were analysed by nonlinear mixed-effect modelling using the program NONMEM (version V) to evaluate not only typical parameters, but also inter-individual and residual variability [12, 13].
Pharmacodynamic modelling and simulation
Step 1: The basic population model. This was developed with NONMEM (version 5) [13]. When IGF-1 concentrations (expressed as percent baseline) were plotted against octreotide concentration in a time-ordered manner, no apparent hysteresis loop was observed in any of the subjects. This suggested an immediate equilibration of octreotide with the biophase and, thus, a direct pharmacokinetic/pharmacodynamic correlation technique was utilized. The relationship between the octreotide concentration and the pharmacodynamic effect (IGF-1) was described by means of the following Emax model:
| 1 |
in which Eij, is the jth pharmacodynamic measurement for the ith individual; E0i, Emaxi and EC50i represent baseline, percentage of maximal decrease in IGF-1 concentration, concentration of octreotide corresponding to 50% of the maximal effect, respectively, for the ith individual; εij, is the residual (intraindividual) error, a random variable assumed to be symmetrically distributed around zero with variance σ [2]. For each parameter, the expression for subject i is:
| 2 |
In which Ppop represents the typical parameter value in the population; ηi is random variable assumed to be symmetrically distributed around zero with variance ω [2].
Step 2: Covariate model selection. A stepwise generalized additive model based on the Pi estimates from the basic population model as dependent variables was used to select the most important covariates and select the functional relationship between the covariate and the parameter [14]. The covariates assessed were age, weight, sex and baseline IGF-1 concentration. To evaluate the significance of covariate effects, the difference in minimum value of the objective effects, provided by NONMEM, between a model with and without a specific covariate relationship was compared with χ2 distribution in which a difference of 4, 6 and 11 was significant at P = 0.05, P = 0.01 and P = 0.001, respectively.
Pharmacokinetic modelling
After visual inspection, concentration-time profiles of octreotide after a single intramuscular administration of microencapsulated octreotide acetate were assumed to be described by a one-compartment model which consisted of two absorption processes, characterized by KIR and KSR rate constants for immediate-release and sustained-release, respectively, with first-order elimination (Ke) (Figure 1). The surface, unencapsulated drug was immediately absorbed into the central compartment with first-order absorption (KIR), while the microencapsulated drug was first released in a zero-order fashion into a depot before absorbed into the central compartment with first-order absorption (KSK) during a period of τ. The apparent volume of distribution was expressed as V/F, where F is the absolute bioavailability. A similar model with one more peripheral compartment was also tested.
Figure 1.

Pharmacokinetic model describing serum octreotide concentration-time profiles.
To quantify interindividual variability in KIR, KSR, Ke, and V/F, and residual variability (e.g. drug-assay error, intraindividual variability, and deviations caused by the incorrect specification of the model), a nonlinear mixed-effect model was utilized. First, a basic population pharmacokinetic model was derived. For each parameter the expression for subject i is shown in Equation 2.
In the next step, a model incorporating covariates was constructed. A stepwise generalized additive model based on the estimates of Pi from the basic population model as dependent variables was used to select the most important covariates and define the functional relationship between the covariate and the parameter [14]. The covariates assessed were age, weight, sex and type of formulation. To evaluate the significance of covariate effects, the difference in minimum value of the objective effects, provided by NONMEM, between a model with and without a specific covariate relationship was compared with χ2 distribution in which a difference of 4, 6 and 11 was significant at p = 0.05, P = 0.01 and P = 0.001, respectively.
Based on the final pharmacodynamic model, 50%, 60%, 70%, 75%, 80%, 85%, 90% and 95% of Emax was calculated and represented as EC50, EC60, EC70, EC75, EC80, EC85, EC90 and EC95, respectively. Different dosing regimens (30 mg every 2, 3, 4, 6, 8, 10 or 12 weeks) were evaluated using the final typical estimates of the pharmacokinetic parameters. For each dosing regimen, 1000 simulations were undertaken and the percentage of the population whose minimum drug concentration at steady-state exceeded EC50, EC60, EC70, EC75, EC80, EC85, EC90 and EC95 was computed.
IGF-1 and IGFBP-3
The relationship between serum IGF-1 concentration and serum IGFBP-3 concentration was also evaluated using least-square linear regression.
Results
Pharmacokinetic/pharmacodynamic analysis
IGF-1 concentration tended to decrease with an increase in drug concentration and reached a minimum above an octreotide concentration of about 6000 pg ml−1. To determine if this time course was affected by latency of onset or prolonged drug effect, visual inspection of the data was performed. Hysteresis loops were not observed in most of the subjects, and therefore, we assumed that the pharmacodynamic effects of octreotide were directly related to drug concentration.
After visual inspection of individual plots of IGF-1 concentration (expressed as percentage baseline) vs corresponding drug concentration, an inhibitory Emax model with baseline (E0) was applied. An inhibitory Emax model with baseline IGF-1 estimates (E0) without covariates was first used to describe the relationship between IGF-1 and octreotide concentrations. The potential correlations between Bayesian estimated Emax, E0 or EC50 and age, gender, body weight or baseline IGF-1 concentration were evaluated using scatter plots. Only one significant relationship was detected. Baseline IGF-1 estimate (E0) vs observed baseline IGF-1 concentration had a negative correlation between E0 and baseline IGF-1 concentration as shown in left panel of Figure 2 (r2 = 0.48, P<0.001). A significant reduction in the minimum value of objective function was achieved with incorporation of baseline IGF-1 concentration into E0 (χ2 = 31; P<0.001).
Figure 2.

Correlation between baseline effect (E0) vs observed baseline IGF-1 concentration (a; 63 treatments); Bayesian estimated IGF-1 vs observed IGF-1 (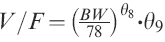 ) (b; r2 = 0.72; 469 observations/63 treatments). — line of identity.
The Bayesian predicted vs observed IGF-1 concentration is shown in the right-hand panel of Figure 2. No apparent bias was observed between predicted IGF-1 vs weighted residuals. The population predicted and individual observed IGF-1 concentrations (expressed as percent baseline) vs simultaneously measured octreotide concentrations is depicted in Figure 3.
Figure 3.

Population predicted (—) and individual  serum IGF-1 concentrations (expressed as percent baseline) vs simultaneously measured serum octreotide concentrations (469 observations/63 treatments).
Population pharmacokinetic/pharmacodynamic estimates are listed in Table 2.
Table 2.
Population pharmacokinetic/pharmacodynamic estimates using NONMEM.
| Parameters | Estimates Mean | CV% |
|---|---|---|
| Estimates of population means (fixed effects) | ||
| Emax | 40 | 8.7 |
| E0 | 110 | 2.7 |
| EC50(pg ml−1 | 746 | 28.2 |
| θ4 | 0.123 | 14.8 |
| Estimates of variability (random effects) Intersubject variability (CV%) | ||
| Emax | NE | NE |
| E0 | 11.1 | 34.6 |
| EC50 (pg ml−1) | 149 | 62.9 |
| Residual variability (CV%) | 16.5 | 9.1 |
NE: not estimated; Emax: maximum effect; E0: baseline effect; EC50: serum concentration of octreotide to reach half the maximum effect; E0 = TVE0 – (BAS2 – 61). θ4, where TVE0 is typical value of E0, BAS2 is baseline IGF-1; CV% of estimates are calculated by (Standard Error/ Mean) × 100%.
The estimate of intersubject variability for EC50 is comparatively large. To explore the potential association that might have given rise to the large interindividual variability in the sensitivity of the IGF-1 response to octreotide, the effect of age, gender, race or body weight on EC50 were evaluated. No significant correlations were observed.
Pharmacokinetic analysis
The pharmacokinetic profile of octreotide was characterized by an initial peak followed by sustained-release of drug. Plateau concentration were sustained through day 70, and gradually declined to below the detection limit on day 112. Figure 4 shows the total serum octreotide concentration-time profiles in all subjects.
Figure 4.

Individual serum octreotide concentration-time plots (a: 0–2 days; b: 2–112 days; 3927 observations/110 treatments).  (study 1);
  B (study 2);
  C (study 2);
  B (study 2).
The two-compartment model was rejected because it failed to converge. In the pharmacokinetic modelling process, based on the one-compartment basic model (Model 1), it was found the Bayesian estimated KIR values (absorption rate constant for rapid release of unencapsu-lated octreotide) from A in Study 1 were significantly smaller than other formulations in both studies (Figure 5). Although these partial release characteristics were preferable, appreciable amount of formulation A used in Study 1 remained in the mixing vial due to poor wetting and mixing characteristics. An improved model (Model 2) was obtained by incorporating formulation A in Study 1 as a covariate of KIR (χ2 = 237; P< 0.001).
Figure 5.

Bayesian absorption rate constants for unencapsulated octreotide vs actual doses administered (110 treatments).  A (study 1);
  C (study 2);
  B (studies 1 and 2).
The relationship between body weight, body mass index, body surface area and lean body mass and the pharmacokinetics of octreotide were assessed using Model 2. The apparent volume of distribution (V/F) was best correlated positively with body weight. The incorporation of body weight into the model (Model 3) significantly reduced the minimum value of objective function (MVOF) (χ2 = 82; P< 0.001).
Model 4 with incorporation of gender as a covariate for apparent volume of distribution was a substantial improvement over Model 3 (χ2 = 94; P< 0.001). Male subjects had about a 40% bigger volume of distribution than female subjects irrespective of body mass. Model 4 was further improved by using first-order estimation method with a reduction in the minimum value of objective function of 271 (Model 5). On inspection of the scatter plots, no relationship was found between age, gender, body weight and race and the Bayesian estimates of other pharmacokinetic parameters. Attempts to find a more parsimonious model by eliminating certain parameters were also unsuccessful either because they produced a worse fit (increase in the minimum value of the objective function) or because convergence could not be achieved due to numerical difficulties. Therefore, Model 5 was selected for the final estimation of typical pharmacokinetic parameters of octreotide. The five models are summarized in Table 3. Figure 6 (left panel) displays a good correlation between observed octreotide concentrations and those predicted from Model 5. Some subjects had significantly higher predicted concentrations compared with those observed. Examination of the characteristics of the subjects and samples found no explanatory pattern for this observation.
Table 3.
Summary of basic and covariate phamiacokinetic models.
| Model | Description | Mathematical expression | Change in MOF (from basic model) |
|---|---|---|---|
| Model 1 | Basic model | IF(TYP.EQ.1) THEN | |
| Model 2 | Covariate model with effect of formulation on KIR (First-order estimation method) | TVK23 = θ2 ELSE TVK23 = θ2 · θ7 | −237 |
| Model 3 | Covariate model with effect of formulation on KIR and effect of body weight on apparent volume of distribution (First-order estimation method) | TVK23 = θ2 IF(TYP.EQ.1) THEN ELSE TVK23 = θ2 · θ7 TVV = θ6 · (BW/81)θ8 | −319 |
| Model 4 | Covariate model with effect of formulation on KIR, effect of body weight on apparent volume of distribution and effect of gender on apparent volume of distribution (First-order estimation method) | IF(TYP.EQ.1) THEN TVK23 = θ2 ELSE TVK23 = θ2 · θ7 IF(SEX.EQ.1) THEN TVV = θ6 · (BW/81)θ8 ELSE TVV = θ6 · (BW/81)θ8 · θ9 | −413 |
| Model 5 | Covariate model with effect of formulation on KIR, effect of body weight on apparent volume of distribution and effect of gender on apparent volume of distribution (First-order conditional estimation method) | IF(TYP.EQ.1) THEN TVK23 = θ2 ELSE TVK23 = θ2 · θ7 IF(SEX.EQ.1) THEN TVV = θ6 · (BW/81)θ8 ELSE TVV = θ6 · (BW/81)θ8 · θ9 | −684 |
TYP: Formulation Type, TYP = 1 is for Formulation A in Study 1, otherwise other formulations; TVK23: typical KIR; TVV: typical V; BW:body weight.
Figure 6.

Bayesian estimated vs observed octreotide concentrations (a; r2 = 0.59; 3927 observations/110 treatments).  C (study 2);
  B (study 2);
  A (study 1);
  (study 1);
 line of identity; Weighted residuals vs population predicted octreotide concentrations based on population parameter estimates (Model 5) (b; 3927 observations/110 treatments).
The plots of residuals vs covariates were used to examine the predictive performance of the final population phamiacokinetic model. No apparent bias was detected. The plot of predicted octreotide concentrations vs weighted residuals (Figure 6, right panel) also revealed no bias. The population prediction octreotide concentration vs time profiles for a typical female subject with body weight of 78 kg and receiving formulation C as well all those of individual profiles are illustrated in Figure 7. Population pharmacokinetic estimates based on Model 5 are reported in Table 4.
Figure 7.

Individual serum octreotide concentration vs time profiles and population predicted profile ( ) for a typical female subject with body weight of 78 kg and receiving 30 mg C intramuscularly (a: 0—2 days; b: 2—112 days; 3927 observations).
Table 4.
Population pharmacokinetic parameter estimates obtained using the first-order conditional method of NONMEM.
| Estimates Parameters | Mean | CV% |
|---|---|---|
| Estimates of population means (fixed effects) | ||
| KSR(h−1) | 0.00469 | 7.1 |
| KIR(h−1) | 0.0312 | 17.7 |
| Ke(h−1) | 1.05 | 8.4 |
| F2(%) | 0.199 | 10.8 |
| V/F(1) | 8.23 | 9.0 |
| V/F* (1 kg−1) | 0.11 | NE |
| θ7 | 2.18 | 25.9 |
| θ8 | 0.362 | 89.5 |
| θ9 | 1.42 | 9.5 |
| τ (h) | 1680 | NE |
| Estimates of variability (random effects) | ||
| Intersubject variability (CV%) | ||
| KSR | 99 | 15.7 |
| KIR | 134 | 23.6 |
| Ke | 31 | 25.6 |
| V | 29 | 28.3 |
| Residual variability (CV%) | 57 | 15.6 |
NE: not estimated; KSR: apparent absorption rate constant of sustained-release octreotide; KIR: apparent absorption rate constant of unencap-sulated octreotide; Ke: elimination rate constant of octreotide from central compartment; F2: fraction of drug available for immediate-release (unencapsulated drug); V/F: apparent volume of distribution; θ7: multiplicity of KIR if formulation is other than A in Study 1; 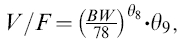 where BW is body weight, θ9 = 1 if Subject is male; CV% of estimates are calculated by (Standard Error/Mean) × 100%;
Bayesian estimated apparent volume of distribution per kg ofbody weight (range: 0.06–0.17 1kg−1).
Pharmacokinetk/pharmaco dynamic simulations of different dosing regimens
50%, 60%, 70%, 75%, 80%, 85%, 90% and 95% values of Emax are achieved at octreotide concentrations of 746 pg ml−1 (EC50), 1119 pg ml−1 (EC60), 1741 pg ml−1, (EC70), 2238 pg ml−1 (EC75), 2984 pg ml−1 (EC80), 4227 pg ml−1, (EC85), 6714 pg ml−1(EC90) and 14174 pg ml−1 (EC95), respectively. The concentration at 80% of Emax was considered satisfactory for lowering IGF-1 concentration. For each dosing regimen, 1000 simulations were undertaken and the percentage of the population whose minimum drug concentration at steady-state exceeded EC50, EC60, EC70, EC75, EC80, EC85, EC90 and EC95 was plotted against the frequency of dosing (Figure 8). Over 95%, 85% or 70% of population had octreotide concentration greater than EC80 following 30 mg i.m. every 2, 3 or 4 weeks, respectively, in comparison with only 40% following 30 mg every 6 weeks. The other dosing regimens (30 mg every 8 weeks, 10 weeks or 12 weeks) resulted in even lower concentrations of octreotide.
Figure 8.

At various estimated effective concentrations (EC) from 50% to 95%, the percentage of the population at steady state exceeding the specified EC vs frequency of dosing. Based on the population pharmacokinetic parameters for a healthy female subject with body weight of 78 kg.
Relationship between IGFBP-3 and IGF-1 concentrations
A significant but weak relationship was found between serum IGF-1 and IGFBP-3 concentrations (P<0.05) (Figure 9).
Figure 9.

Relationship between serum IGF-1 and IGFBP3 concentrations (388 observations/51 treatments).
Discussion
The pharmacokinetic nonlinear mixed-effect model developed in this study adequately fitted the octreotide concentration-time profile after intramuscular administration of sustained-release formulation of microencapsulated octreotide acetate. The Bayesian estimated elimination half-life ofoctreotide from this model was 41 min (range 28–93 min) which was shorter than that reported for intravenous administration (∼90 min) [15]. Large inter-subject and residual variability have been noted in the current model which might contribute to the discrepancy in half-life. The apparent absorption half-life for sustained-release octreotide was 148 h, which is comparable to the terminal half-life determined from noncompartmental analysis (168 h). The formulation utilized in the current analysis consists ofoctreotide acetate microencapsulated in a biodegradable polymer in which drug release occurs slowly as cleavage of the polymer ester linkage takes place. The apparent absorption half-life for the microencapsulated octreotide acetate is not a pure absorption half-life, but is more likely to be a release-limited absorption parameter. This is reflected in the complementary processes of drug release from the matrix and subsequent absorption from the interstitial space.
Both body weight and gender were found to be important covariates of apparent volume of distribution. Interestingly, it was found that male subjects had about a 40% larger volume of distribution than female subjects, but body weight did not appear to play a role in this gender difference. Further analysis failed to identify a basis for this observation; however, most of the subjects (52 of 59) were female and a larger number of male subjects would need to be studied to draw definitive conclusions about any gender effect on the volume of distribution.
The natural inhibitor of IGF-1 and GH is somatostatin. The endocrine effects of octreotide on GH release form the basis of its use for the treatment of acromegaly [16]. It was initially postulated that octreotide had a direct inhibitory effect in vivo on tumour growth by the inhibition of GH secretion and subsequent reduction of IGF-1 concentrations. However, some recent studies have shown conflicting results. It has been found that somatostatin and its analogues inhibit the effects of growth factors such as IGF-1, b-FGF and PDGF [17]. In the current pharmacokinetic/pharmacodynamic analysis, no relationship between GH concentration and octreotide concentration was established. The lack of correlation might be attributed to the low basal GH concentration in older healthy adults, the limited sampling frequency and morning sample timing, and the highly pulsatile nature of GH secretion. In contrast, we did find a significant correlation between IGF-1 concentration, an indirect measure of daily GH secretion, and drug concentration that could be adequately described by a direct inhibitory Emax model. No apparent hysteresis was observed between IGF-1 and octreotide concentrations, which implied that there was no significant time lag for the suppression of IGF-1 by octreotide. Similar findings were also observed when continuous subcutaneous octreotide infusion was administered in diabetics with retinopathy [18].
The current dosing regimens of 30 mg octreotide i.m. every 4 weeks can achieve adequate suppression of IGF-1 concentration in at least 70% of the population. Although, based on our simulation, a more frequent dosing regimen of 30 mg i.m. every 2 or 3 weeks may result in 80% suppression of IGF-1 in a higher percentage of the population, dosing every 4 weeks is sufficient for therapeutic purposes.
In summary, the population pharmacokinetic and pharmacokinetic/pharmacodynamic models developed in this study may be useful for the future development of sustained-release formulations and in the optimal selection of dosing regimens.
References
- 1.Katz D, Erstad BL. Octreotide, a new somatostatin analogue. Clin Pharm. 1989;8:255–273. [PubMed] [Google Scholar]
- 2.Chanson P, Timsit J, Harris AG. Clinical pharmacokinetics of octreotide. Therapeutic applications in patients with pituitary tumors. Clin Pharmacokin. 1993;25:375–391. doi: 10.2165/00003088-199325050-00004. [DOI] [PubMed] [Google Scholar]
- 3.Lamberts W. Somatostatin analogs: their role in the treatment of growth hormone hypersecretion and excessive body growth. Growth Regul. 1991;1:3–10. [PubMed] [Google Scholar]
- 4.Grass P, Marbach P, Bruns C, Lancranjan I. Sandostatin LAR (microencapsulated octreotide acetate) in acromegaly: pharmacokinetic and pharmacodynamic relationships. Metabolism. 1996;45:27–30. doi: 10.1016/s0026-0495(96)90075-x. [DOI] [PubMed] [Google Scholar]
- 5.Lancranjan I, Bruns P, Grass P. Sandostatin® LAR®: a promising therapeutic tool in the management of acromegalic patients. Metabolism. 1996;45(Suppl 1):67–71. doi: 10.1016/s0026-0495(96)90087-6. [DOI] [PubMed] [Google Scholar]
- 6.Flogstad AK, Lancranjan I, Halse J. Sandostatin LAR in acromegalic patients: Long term treatment. J Clin Endocrinol Metab. 1997;81:23–28. doi: 10.1210/jcem.82.1.3572. [DOI] [PubMed] [Google Scholar]
- 7.Sonksen P, Russell-Jones D, Jones R. Growth hormone and diabetes mellitus. A review of sixty-three years of medical research and a glimpse into the future. Horm Res. 1993;40:68–79. doi: 10.1159/000183770. [DOI] [PubMed] [Google Scholar]
- 8.Dills D, Moss S, Klein R, Davis M. Is insulin-like growth factor I associated with diabetic retinopathy. Diabetes. 1990;39:191–195. doi: 10.2337/diab.39.2.191. [DOI] [PubMed] [Google Scholar]
- 9.Chen T, Miller T, Prasad P, et al. Pharmacokinetics, pharmacodynamics, and safety of microencapsulated octreotide acetate in healthy subjects. J Clin Pharmacol. 2000;42:475–481. doi: 10.1177/00912700022009242. [DOI] [PubMed] [Google Scholar]
- 10.Baxter RC, Martin JL. Radioimmunoassay of growth hormone dependent insulin-like growth factor binding protein in human plasma. J Clin Invest. 1986;78:1504–1512. doi: 10.1172/JCI112742. [DOI] [PMC free article] [PubMed] [Google Scholar]
- 11.Underwood LE, Murphy MG. Radioimmunoassay of the somatomedins/insulin-like growth factors. In: Patrano C, Peskar BA, editors. Radioimmunoassay in Basic and Clinical Pharmacology. Berlin: Springer-Verlag; 1987. pp. 561–574. [Google Scholar]
- 12.Beal SL, Sheiner LB. NONMEM Users Guides. San Francisco: University of California; 1992. San Francisco: NONMEM Project Group. [Google Scholar]
- 13.Sheiner LB, Rosenberg B, Marathe VV. Estimation of population characteristics of pharmacokinetic parameters from routine clinical data. J Pharmacokin Biopharm. 1977;5:445–479. doi: 10.1007/BF01061728. [DOI] [PubMed] [Google Scholar]
- 14.Mandema JW, Verotta D, Sheiner LB. Building population pharmacokinetic-pharmacodynamic models; I. models for covariate effects. J Pharmacokinet Biopharm. 1992;20:511–528. doi: 10.1007/BF01061469. [DOI] [PubMed] [Google Scholar]
- 15.Bauer W, Bringer U, Doepfner W, et al. SMS 201–995: a very potent and selective octapeptide analogue of somatostatin with prolonged action. Life Sci. 1982;31:1133–1140. doi: 10.1016/0024-3205(82)90087-x. [DOI] [PubMed] [Google Scholar]
- 16.Lamberts W, Oosterom R, Neufeld M, del Pozo E. The somatostatin analogue SMS 201—995 induces long acting inhibition of growth hormone secretion without rebound hypersecretion in acromegalic patients. J Clin Endocrinol Metab. 1985;60:1161–1165. doi: 10.1210/jcem-60-6-1161. [DOI] [PubMed] [Google Scholar]
- 17.Viguerie N, Tahiri-Jouti N, Ayral A, et al. Direct inhibitory effects of a somatostatin analog, SMS 201–995, on AR4–2 J cell proliferation via pertussis toxin-sensitive guanosine triphosphate-binding protein-independent mechanism. Endocrinology. 1989;124:1017–1025. doi: 10.1210/endo-124-2-1017. [DOI] [PubMed] [Google Scholar]
- 18.Hyer S, Sharp P, Brooks R, Burrin J, Kohner E. Continuous subcutaneous octreotide infusion markedly suppresses IGF-1 concentrations whilst only partially suppressing GH secretion in diabetics with retinopathy. Ada Endocrinol (Copenh) 1989;120:187–194. doi: 10.1530/acta.0.1200187. [DOI] [PubMed] [Google Scholar]