

Abstract
The cerebral tricarboxylic acid (TCA) cycle rate and the rate of glutamine synthesis were measured in rats in vivo under normal physiological and hyperammonemic conditions using 13C NMR spectroscopy. In the hyperammonemic animals, blood ammonia levels were raised from control values of ≈0.05 mM to ≈0.35 mM by an intravenous ammonium acetate infusion. Once a steady-state of cerebral metabolites was established, a [1-13C]glucose infusion was initiated, and 13C NMR spectra acquired continuously on a 7- tesla spectrometer to monitor 13C labeling of cerebral metabolites. The time courses of glutamate and glutamine C-4 labeling were fitted to a mathematical model to yield TCA cycle rate (VTCA) and the flux from glutamate to glutamine through the glutamine synthetase pathway (Vgln). Under hyperammonemia the value of VTCA was 0.57 ± 0.16 μmol/min per g (mean ± SD, n = 6) and was not significantly different (unpaired t test; P > 0.10) from that measured in the control animals (0.46 ± 0.12 μmol/min per g, n = 5). Therefore, the TCA cycle rate was not significantly altered by hyperammonemia. The measured rate of glutamine synthesis under hyperammonemia was 0.43 ± 0.14 μmol/min per g (mean ± SD, n = 6), which was significantly higher (unpaired t test; P < 0.01) than that measured in the control group (0.21 ± 0.04 μmol/min per g, n = 5). We propose that the majority of the glutamine synthetase flux under normal physiological conditions results from neurotransmitter substrate cycling between neurons and glia. Under hyperammonemia the observed increase in glutamine synthesis is comparable to the expected increase in ammonia transport into the brain and reported measurements of glutamine efflux under such conditions. Thus, under conditions of elevated plasma ammonia an increase in the rate of glutamine synthesis occurs as a means of ammonia detoxification, and this is superimposed on the constant rate of neurotransmitter cycling through glutamine synthetase.
Keywords: hyperammonemia, neurotransmitter cycle, detoxification
Glutamine synthetase in the brain is predominantly an astrocytic enzyme that catalyzes the formation of glutamine from glutamate and ammonia. It has been suggested that this pathway forms part of a neurotransmitter cycle between neurons and glia (1). In this cycle, astrocytes take up neurotransmitter glutamate from the synaptic cleft, convert it to glutamine via glutamine synthetase, and release this glutamine into the extracellular space for uptake by neurons, where it is converted back to glutamate primarily by glutaminase. γ-Aminobutyric acid (GABA) released from inhibitory neurons also may be taken up by astrocytes, converted to glutamate, and recycled to neruons in the same way. The function of such a cycle would be to remove the synaptically active metabolite from the synaptic cleft and to recycle the carbon skeletons back to the neuronal pool by a synaptically inactive form.
While ammonia is a normal constituent of tissue, elevated concentrations of blood and brain ammonia have been found to interfere with cerebral energy metabolism and may reduce neurotransmitter (glutamate and aspartate) concentrations in the brain (for review see ref. 2). In addition, hyperammonemia is associated with an increase in brain glutamine levels, which has prompted studies of glutamine synthetase activity under such conditions and has fostered the concept of glutamine synthesis as a detoxification pathway for ammonia in the brain (2). This poses the fundamental question as to the role of the glutamine synthetase pathway in the brain. Is it, primarily, an integral part of the glutamate-glutamine cycle in the brain, regulating neurotransmitter activity by removing glutamate and GABA from the synaptic cleft while maintaining neuronal glutamate pools by cycling the carbon skeletons in the synaptically inactive form of glutamine? Or does it function largely as a detoxification pathway for cerebral ammonia? Or does the pathway function effectively in both respects?
The use of 13C NMR spectroscopy facilitates noninvasive measurements of metabolic rates in vivo (3, 4). A comprehensive mathematical model incorporating the available 13C NMR data has been proposed, and used to derive the cerebral tricarboxylic acid (TCA) cycle rate (VTCA) and the flux of label from glutamate to glutamine (Vgln) in normal human and rat brain (5, 6). In a recent series of papers, Kanamori et al. (7–9) have used 15N NMR techniques to determine the rate of glutamine synthesis from labeled ammonia in hyperammonemic rats. However, uncertainties in the fractional 15N enrichment of the brain ammonia pool have resulted in a range of reported flux values.
The purpose of this study was to investigate the role of the glutamine synthetase pathway in the brain by measuring its activity at normal and elevated plasma ammonia levels. Using direct 13C NMR we have determined cerebral VTCA and Vgln rates simultaneously in vivo in normal and hyperammonemic rats. The determination of these rates under hyperammonemic conditions enables us to elucidate further the underlying biochemistry of the glutamate–glutamine flux under normal conditions, and to propose an integrated model of cerebral glutamate, glutamine, and ammonia metabolism.
METHODS
Animal Preparation.
Two groups of male Sprague–Dawley rats were studied: a control group (weight 213 ± 11 g; n = 5) and a hyperammonemic group (weight 213 ± 19 g; n = 8). The animals were anesthetized with 3% halothane in 30% oxygen and 70% nitrous oxide, tracheotomized, and artificially ventilated. Both femoral veins were cannulated for infusions, and the left femoral artery was cannulated for continuous monitoring of blood pressure and periodic blood gas analysis. An intraperitoneal line was inserted for administration of α-chloralose anesthesia, under which the remainder of the experiment was performed (initial dose 80 mg/kg; supplementary doses 20 mg/kg every 40 min). The scalp was removed to minimize lipid signal contamination of the in vivo 13C data, and a layer of plastic wrap was placed over the skull to prevent desiccation. Body temperature was maintained at ≈37°C with a Tygon jacket and a temperature-regulated circulating water bath.
Control group.
A [1-13C]glucose infusion was initiated and continued for approximately 3.5 h, using a protocol described previously (10). The infusion was designed to raise the fractional enrichment of plasma glucose rapidly to a high and steady level for the duration of the experiment. 13C NMR spectra were acquired continuously throughout the [1-13C]glucose infusion.
Hyperammonemic group.
Brain pools of glutamate and glutamine are altered as a result of ammonia infusion, thus to induce a steady-state condition of hyperammonemia (plasma [ammonia] = 0.3–0.4 mM), an ammonium acetate infusion was initiated and continued for 4 h. Bench studies indicated that this period of time was required for the cerebral glutamine pool to reach its elevated steady-state. After this 4-h period a [1-13C]glucose infusion was performed as for the control group and 13C NMR spectra acquired continuously. The ammonium acetate infusion was continued throughout the rest of the experiment to maintain metabolite steady-state, resulting in a total infusion time of ≈7.5 h. Plasma samples were acquired periodically for determination of plasma ammonia concentration.
In the ammonium acetate infusion, animals received, per 200 g of body weight, a 25-μl bolus of 0.5 M ammonium acetate followed by an exponentially decreasing infusion of the same solution over the next 18 min. Subsequently, the infusion was maintained at a constant rate of 27.3 μl/min, with further decreases of 10% at 1 and 2 h and 5% every hour thereafter. This infusion protocol, adapted from that of Fitzpatrick et al. (11), was determined to produce a rapid rise in plasma ammonia concentration and to maintain this level throughout.
For all animals blood samples were taken at intervals for analysis of total and 13C-labeled glucose. At the end of the experiment, the brain was immediately frozen, in situ, in liquid nitrogen while mechanical ventilation was continued.
In Vivo 13C NMR Spectroscopy.
NMR spectra were acquired on a 7-tesla horizontal bore spectrometer (Bruker, Billerica, MA) using a dual tuned surface coil consisting of a 9-mm diameter 13C coil and a butterfly 1H coil for decoupling. The operating frequencies were 75.61 MHz for 13C and 300.675 MHz for 1H. The center of the 13C surface coil was positioned 1–2 mm posterior to Bregma, and the animals’ head held in place by clamping to a bite-bar.
Magnetic field homogeneity was optimized by nonlocalized shimming of the first-order shim gradients, and an automated localized shim routine for first- and second-order shim gradients (40–60 Hz linewidth for water). The RF pulse for 13C excitation was optimized as described previously (4). WALTZ-16 proton broadband decoupling was achieved as described by Bax (12). Additional nuclear Overhauser effect (NOE) enhancement enabled a temporal resolution of 10 min for the control animals and 5 min for the hyperammonemic animals. Pre-glucose infusion baseline scans were subtracted from postinfusion spectra to eliminate the broad lipid signal in the spectral region of interest.
Preparation of Plasma and Brain Samples.
Plasma samples (≈50 μl) were extracted in 0.3 M perchloric acid according to a procedure described previously (13), which was modified to include the addition of potassium fluoride as a glycolytic inhibitor. Methanol HCl-perchloric acid (3 M) extracts were prepared from frozen fronto-parietal cortex (≈100 mg wet weight) using a modification of previous procedures (10, 14). After lyophilization, all samples were resuspended in D2O for NMR analysis.
In Vitro NMR of Plasma and Brain Extract Analysis.
NMR spectra were acquired on an 8.4-tesla, AM-360 wide-bore spectrometer (Bruker). Direct 1H spectra were acquired at a temperature of 47°C, for analysis of the fractional enrichment of the α anomer of the C-1 proton resonance of d-glucose, as described previously (13, 15).
For analysis of cerebral glutamate and glutamine concentrations, and glutamate fractional enrichment, spectra of each brain extract were acquired using proton-observe, 13C-edited NMR (10, 16) under fully relaxed conditions. The 13C resonances of glutamate and glutamine C-4 were inverted on alternate scans, with a composite 13C pulse applied between the glutamate and glutamine C-4 resonances at 34.4 and 31.3 ppm, respectively. The fractional enrichment of glutamate C-4 with 13C was calculated from the ratio of the peak heights at 2.33 ppm in the difference (13C) and nonedited (12C + 13C) spectra. The concentrations of glutamate and glutamine were estimated by comparison of the areas of the glutamate and glutamine C-4 resonances in the nonedited 1H spectrum with that of creatine [assumed to be 10.4 μmol/g (17)] at 3.03 ppm.
Analysis of Plasma Ammonia Concentration.
Plasma ammonia concentrations were determined spectrophotometrically using a Sigma Diagnostics enzymatic assay (18–19).
Determination of Metabolic Rates.
The time courses of glutamate and glutamine C-4 labeling in the brain were fitted with a mathematical model, describing the metabolic pathways as a system of coupled differential equations, to yield VTCA and Vgln. This method of analysis has been comprehensively described elsewhere (5, 6), and in this study consisted of three fitting procedures described below. In all cases, the system is assumed to be at metabolic steady-state, such that total concentrations of all metabolites are constant, as are all rates of reactions.
Determination of Vgln.
As described in Discussion, glutamine is synthesized from two precursor sources, neuronal glutamate and astrocytic α-ketoglutarate. Because we do not know a priori the relative contributions from these sources a maximum and minimum estimate of Vgln was obtained.
To determine the maximum estimate of Vgln the large neuronal glutamate pool (20) was assumed to be the precursor pool for glutamine synthesis. The labeled glutamate C-4 time course was fitted using a polynomial to obtain a smooth curve. This fitted glutamate C-4 time course was used as the input function to fit the glutamine C-4 time course, which then was used together with the measured cerebral glutamate and glutamine concentrations to calculate Vgln.
To obtain a minimum estimate of Vgln the labeling data were fitted under the assumption that the small astrocytic glutamate pool (20) is the precursor to glutamine synthesis with a 13C enrichment similar to that of pyruvate. For this analysis the glucose transport and fractional enrichment data described below was used as the input function to fit the glutamine in vivo 13C NMR data. Because the astrocytic precursor glutamate pool labels more rapidly than the neuronal pool used for the maximum estimate of Vgln, this calculation provides a minimum estimate of the rate of glutamine synthesis.
Determination of VTCA.
A one-compartment model was subsequently fitted to the glutamate C-4 data to determine VTCA, using the following parameters: Km for glucose transport from blood to brain = 10.7 mM (13); glucose transport Vmax/CMRgl = 5.8 (13); measured time course of plasma glucose fractional enrichment with 13C (assumed to reach elevated steady-state within 0.2 min); measured cerebral glutamate and glutamine concentrations. In the control group the neuronal glutamate pool was assumed to exchange with the glutamine pool at the maximum estimated rate of Vgln calculated as described above. In the hyperammonemic group, neurotransmitter cycling was assumed to be unchanged by hyperammonemia, and the rate of glutamate-glutamine exchange was taken to be the mean maximum rate of Vgln determined in the control group. In addition, rates of glutamine efflux from the brain of 0 and 0.11 μmol/min per g (21–24) and cerebral lactate concentrations of 1.5 and 4 μmol/g (11, 25–27) were used for the control and hyperammonemic groups respectively. De novo synthesis of glutamate also was incorporated in the model to balance loss of carbon skeletons from the cerebral pools via glutamine efflux. The value of VTCA was adjusted iteratively by the computer to obtain the best fit to the glutamate C-4 data.
Statistical Analysis.
Repeated measures ANOVA tests were used to determine any effects of time or treatment on the physiological variables (28). Unpaired t tests were used to determine significant differences between the metabolic rates measured in the two experimental groups (28).
RESULTS
Effect of Infusions on Physiological Variables.
All physiological variables were kept within normal limits (PaCO2 = 35–42 mmHg, PaO2 > 100 mmHg, pH = 7.40 ± 0.05), and no significant differences either between groups or within groups over time were observed. However, in the hyperammonemic group a nonsignificant decrease in arterial PaCO2 and increase in arterial pH were observed over the last 30 min of the experiment, and these changes were associated with a tendency in some animals to hyperventilate despite being mechanically ventilated.
Mean arterial blood pressure (MABP) was maintained above 80 mmHg throughout the experiment in both groups of animals. In the hyperammonemic group all animals showed a transient decrease in MABP to ≈65 mmHg after 5 min of ammonium acetate infusion, although this was reversed within 20 min and did not occur again.
Plasma glucose levels were considerably reduced by the overnight fast in all animals (5.8 ± 1.7 mM and 5.5 ± 1.2 mM in the control and hyperammonemic groups, respectively). In the hyperammonemic animals plasma glucose levels returned to euglycemic levels during the preliminary 4-h ammonium acetate infusion, and increased only slightly further over the 3.5-h 13C-glucose infusion period. Similar increases in plasma glucose during hyperammonemia have been observed previously (2, 11) and may be due to either glycogen store mobilization induced by increased plasma ammonia levels (2) or induction of gluconeogenesis as a result of the raised acetate levels (11). However, apart from at time zero with respect to the [1-13C]glucose infusion no significant differences (P > 0.05, unpaired t tests) were observed for plasma glucose concentration between the control and hyperammonemic groups during this infusion. In both groups the fractional enrichment of plasma glucose with 13C was rapidly raised by the [1-13C]glucose infusion (to ≈0.47 in the control group and ≈0.60 in the hyperammonemic group) and remained constant at this level throughout the experiment.
In six animals from the hyperammonemic group, the ammonium acetate infusion resulted in an elevation of plasma ammonia levels from 0.05 ± 0.01 mM to 0.35 ± 0.08 mM (mean ± SD), at which level it was held constant throughout the experiment. In two animals, a much greater increase in plasma ammonia concentration (0.82 ± 0.22 and 1.64 ± 0.29 mM, respectively) was observed for unknown reasons and, consequently, these animals were excluded from the study. No animals experienced overt physical signs of seizure or died prematurely.
Effect of Infusions on Cerebral Metabolite Pools.
At the end of the experiment, cerebral glutamate concentrations were 9.7 ± 1.7 μmol/g and 9.6 ± 0.9 μmol/g in the control and hyperammonemic groups, respectively (mean ± SD, n = 5 and 6, respectively), which are not significantly different (P > 0.5, unpaired t test). In contrast, the measured cerebral glutamine concentrations were 6.4 ± 0.8 μmol/g and 17.3 ± 2.8 μmol/g in the control and hyperammonemic groups, respectively (mean ± SD), which are significantly different (P < 0.001, unpaired t test).
In Vivo Data.
Selected time points from a set of in vivo 13C spectra are shown in Fig. 1 for a control (a) and a hyperammonemic (b) animal. Clearly resolved are resonances from glutamine C-4 (31.6 ppm), and glutamate C-4 (34.3 ppm). Also discernible, but not fully resolved, are peaks from glutamate and glutamine C-3 (27.8 and 27.0 ppm, respectively) and glutamate and glutamine C-2 (55.5 and 55.0 ppm, respectively).
Figure 1.

Selected time points from sets of 1H-decoupled 13C NMR spectra of rat brain, in vivo, at 7.0 T, acquired during a [1-13C]glucose infusion (pre-infusion baseline scans subtracted). The regions of the 13C spectrum encompassing the metabolite resonances of interest are shown for a control (a) and hyperammonemic (b) rat, respectively. Labeled resonances are glutamate (Glu), and glutamine (Gln). Time interval between spectra shown is ≈20 min (first and last spectra are ≈10 min and ≈210 min into the glucose infusion, respectively).
Determination of Metabolic Rates: Vgln.
The maximum estimate of Vgln measured in the hyperammonemic group was 0.43 ± 0.14 μmol/min per g (mean ± SD, n = 6) which is significantly higher (P < 0.01; unpaired t test) than the rate of 0.21 ± 0.04 μmol/min per g (mean ± SD, n = 5) measured in the control group with this model. Representative fits to the data for glutamine C-4 are shown in Fig. 2 for a control (a) and hyperammonemic (b) animal. The closeness of the fits to the actual data indicates that the model provides an accurate representation of the rates of labeling of the metabolite pools.
Figure 2.

Fits to the in vivo 13C data for glutamate (○) and glutamine (×) C-4, for a control (a) and hyperammonemic (b) rat. Zero time represents the start of the [1-13C]glucose infusion. Peak heights were converted to fractional enrichments as part of the fitting procedure, and the lines represent the best fit to the data generated by the mathematical model (see Methods). The fit to the glutamate C-4 data gives VTCA, and the fit to the glutamine C-4 data gives the mzximum estimate of Vgln.
The minimum estimates of Vgln for the control and hyperammonemic groups were 0.13 ± 0.05 μmol/min per g (mean ± SD, n = 5) and 0.18 ± 0.04 μmol/min per g (mean ± SD, n = 6), respectively, and were not significantly different (P > 0.05, unpaired t test). However, the fits to the data for this model were less good than those generated for the maximum estimate of Vgln, thus supporting the model in which neuronal glutamate is the main precursor pool for glutamine synthesis.
Determination of Metabolic Rates: VTCA.
Representative fits to the 13C-labeled glutamate C-4 data are also shown in Fig. 2 for a control (a) and hyperammonemic (b) animal. In the hyperammonemic group of animals VTCA = 0.57 ± 0.16 μmol/min per g (mean ± SD, n = 6), which is not significantly different (P > 0.10; unpaired t test) to the rate of 0.46 ± 0.12 μmol/min per g (mean ± SD, n = 5) measured in the control group.
DISCUSSION
The primary role of the glutamine synthetase pathway in the brain remains a matter for debate. The hypothesis of a glutamate-glutamine cycle in the brain, while supported by in vitro labeling studies and immunocytochemical data (1), is still to be demonstrated in vivo as a significant fraction of glutamine synthesis. On the other hand, the concept of glutamine synthesis as a detoxification pathway for ammonia in the brain has been presented repeatedly in the literature and appears to be well supported (2). The objective of this study was to try to separate these two roles of glutamine synthesis in the brain, by determining the rate of glutamine synthesis under hyperammonemic conditions and comparing this with the rate determined under normal physiological conditions, using an otherwise identical experimental protocol.
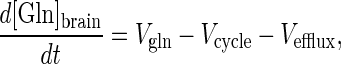
[13N]Ammonia studies have shown that ammonia enters the brain largely by diffusion, as the brain uptake index (BUI) for ammonia is independent of concentration (29). However, these single-pass extraction studies for 13NH3 have demonstrated that the BUI for ammonia is only ≈24% of that for a freely diffusible tracer, indicating that there is some diffusional limitation to ammonia. Thus, under normal physiological conditions the maximum rate of transport of ammonia into the brain can be calculated,
 |
1 |
where Vtrans is the rate of transport of ammonia into the brain, and [NH3]plasma is plasma ammonia concentration. Normal plasma ammonia concentration is ≈0.05 mM, and cerebral blood flow (CBF) in anesthetized rat brain is ≈1.3 ml/min per g (30, 31), giving a rate of ammonia transport into the brain, under normal conditions, of ≈0.02 μmol/min per g. This rate is considerably slower than the rate of cerebral glutamine synthesis measured under normal conditions in vivo (0.21 ± 0.04 μmol/min per g) and, therefore, the rate of the glutamine synthesis is far beyond that required for ammonia detoxification in the brain. Hence, the primary role of glutamine synthesis in the brain, under normal conditions, is not detoxification of blood-borne ammonia. Even if the uptake index of the brain for ammonia was 100%, the rate of transport would still be far below the rate of glutamine synthesis. Further support for this conclusion is that the rate of glutamine synthesis did not increase proportionally with plasma ammonia concentration. As shown below, the increase in Vgln during hyperammonemia is consistent with a selective increase in anaplerotic synthesis of glutamine, which adds to the basal cycling rate.
Based on previously reported data, we propose a simple mathematical model to describe the relationship between brain ammonia concentration, glutamine synthesis, and glutamine efflux. The novel aspect of this model is that it incorporates both carbon and nitrogen balance across the neuronal and astrocytic pools, which allows nitrogen and carbon labeling studies to be quantitatively compared. Using our measured values of Vgln this model enables separate determination of the two roles of glutamine synthesis.
Description of the Model.
The glutamine synthesis reaction has two substrate pools, ammonia and glutamate, both of which will be constant under steady-state conditions, but which may change when the system is perturbed. A schematic diagram of the model is shown in Fig. 3. The ammonia and glutamate substrate pools for the glutamine synthetase reaction are defined as the astrocytic pools of these metabolites. The model is based on three differential equations, which describe the rate of change of the ammonia, and glutamate substrate pools and of the product glutamine pool, respectively.
Figure 3.

Schematic representation of the proposed model. Glc, glucose; Glu, glutamate; Gln, glutamine; NH3, ammonia; Vtrans, rate of ammonia transport into the brain; Vefflux, rate of glutamine efflux from the brain; Vpc, anaplerotic flux; Vcycle, rate of neurotransmitter cycling; Vgln, rate of glutamine synthesis.
Substrate ammonia pool.
The rate of change of the ammonia pool is,
 |
2 |
where [NH3]ast is the concentration of ammonia in the astrocytes (equivalent to brain ammonia concentration), and Vgln is the rate of glutamine synthesis. Vcycle is the rate of cycling of carbon skeletons between astrocytic glutamine synthetase and neuronal glutaminase which, of course, creates and consumes NH3 at the same rate. At steady-state (d[NH3]ast/dt = 0) Eq. 2 simplifies to,
 |
3 |
Substrate glutamate pool.
Similarly, the rate of change of the substrate glutamate pool is,
 |
4 |
where [Glu]ast is the concentration of astrocytic glutamate, and Vpc is the rate of the pyruvate carboxylase reaction (i.e. anaplerotic flux) in the astrocyte from which glutamate is produced via the TCA cycle. Thus, the astrocytic glutamate pool, from which glutamine is synthesized, has contributions from both neuronal glutamate and astrocytic α-ketoglutarate. Under metabolic steady-state conditions Eq. 4 simplifies to,
 |
5 |
Product glutamine pool.
The rate of change of the cerebral glutamine pool is,
 |
6 |
where [Gln]brain is the cerebral concentration of glutamine, and Vefflux is the rate of glutamine efflux from the brain. Under metabolic steady-state conditions Eq. 6 simplifies to,
 |
7 |
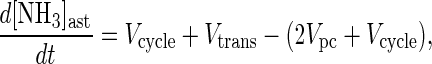
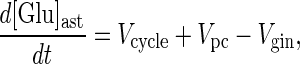
Therefore, at metabolic steady-state Eqs. 3, 5, and 7 reduce to,
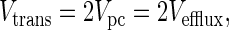 |
8 |
and, under steady-state conditions of hyperammonemia,
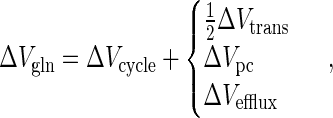 |
9 |
where ΔVgln, ΔVcycle, ΔVtrans, ΔVpc, and ΔVefflux are the increases under hyperammonemia compared with normal conditions.
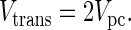
Under normal physiological conditions Vtrans is ≈0.02 μmol/min per g (29). This is similar to reported values of glutamine efflux under normal physiological conditions, which range from 0 to 0.02 μmol/min per g (21, 22, 24), and thus supports the steady-state equation.
Interpretation of the Vgln Data Using the Mathematical Model.
The present study yielded maximum rates of glutamine synthesis under normal and hyperammonemic conditions of ≈0.21 μmol/min per g and ≈0.43 μmol/min per g, respectively, giving a ΔVgln of ≈0.22 μmol/min per g. These rates were determined assuming that the precursor glutamate pool for glutamine synthesis had the same fractional enrichment as the large neuronal pool. While this may be an accurate representation of the control situation (where Vtrans ≈ 0), under hyperammonemic conditions it is known that anaplerotic flux increases (32, 33), and a more significant contribution from the rapidly labeling astrocytic glutamate pool will result. Therefore, it is likely that the hyperammonemic Vgln determined here is an overestimate of this rate, as the model does not account for multiple precursor pools in its present form. If it assumed that the rate of neurotransmitter cycling is unaltered by hyperammonemia so that the increase in Vgln is entirely due to anaplerotic synthesis, the maximum estimate of ΔVgln calculated here may be as much as twice the actual ΔVgln, giving an increase in Vgln under hyperammonemic conditions in the range 0.11–0.22 μmol/min per g.
The rates of glutamine synthesis measured in this study are similar to the highest in vivo values for glutamine synthesis recently reported during hyperammonemia using 15N NMR techniques (7–9), although our rates are considerably higher than the lower values reported in those studies. The cause of this difference in measured rates may lie in the uncertainty of the fractional enrichment of the ammonia precursor pool for glutamine synthesis in the 15N NMR studies, and accurate determination of this parameter should eliminate the apparent discrepancy.
The assumption of a constant rate of cycling is reasonable given that the TCA cycle rate determined in the hyperammonemic group was not significantly different from that measured in control animals, and the neuronal TCA cycle rate is believed to be primarily linked with the energy cost of glutamatergic and GABAergic neuronal activity. Although alterations in cerebral oxygen and glucose utilization under hyperammonemia have been reported (for review, see ref. 2), little data are available concerning the effect of increased ammonia levels on TCA cycle rate. Lai and Cooper (34) demonstrated ammonia-induced inhibition of the α-ketoglutarate dehydrogenase complex (KGDHC), which is thought to be a rate-controlling step of the TCA cycle, in vitro. However, over the range of cerebral ammonia concentration studied here, the decrease in KGDHC activity was small and within the variation of their measurements. Therefore, under our experimental conditions we would not expect to see a reduction in TCA cycle rate as a result of KGDHC inhibition.
Comparison with Previous Studies.
In this section the model is used to compare the values of ΔVgln calculated here with previous measurements of ammonia transport, anaplerotic flux, and glutamine efflux. Although the accuracy of this comparison suffers from differences in animal physiology and brain regions analyzed, the majority of studies seem to be consistent with the proposed interpretation.
The only report of glutamine efflux at similar levels of cerebral glutamine to those studied here (17 μmol/g) is 0.11 μmol/min per g (23), giving a ΔVefflux of ≈0.10 μmol/min per g under our experimental conditions. The value of ΔVefflux calculated from ΔVgln and the model (Eq. 9) with the assumption of a constant cycling rate is 0.11–0.22 μmol/min per g, which is similar to the literature value.
If the increase in Vgln is entirely due to anaplerosis (i.e. constant cycling rate) the calculated ΔVpc is also in the range 0.11–0.22 μmol/min per g. This value is consistent with the increase in anaplerotic flux of ≈0.15 μmol/min per g during hyperammonemia suggested by the data of Berl et al. (32) and Waelsch et al. (33). Such an increase in anaplerotic flux is consistent with the increase in the cerebral glutamine pool being independent of any long-term decrease in the cerebral glutamate pool. Fitzpatrick et al. (11) reported a decrease in the cerebral glutamate pool during a 1-h ammonium acetate infusion, however, at the end of our experiment there was no significant difference in the brain glutamate concentrations measured in the hyperammonemic animals and the control animals. Further replenishment of carbon skeletons in the brain may occur via uptake of branched-chain amino acids (e.g. leucine) from the blood, which is increased under hyperammonemia (35, 36), although the size of this contribution is still to be determined.
CBF has been shown to be unchanged by plasma ammonia concentrations similar to those studied here (37, 38) so that the change in ammonia transport (ΔVtrans) should be proportional to the change in plasma ammonia concentration. From Eq. 1 we calculated a control value for Vtrans of ≈0.02 μmol/min per g, with a 7-fold increase in plasma ammonia concentration this gives a ΔVtrans of ≈0.12 μmol/min per g. With the assumption of constant cycling, we calculate a value of ΔVtrans of 0.22–0.44 μmol/min per g from ΔVgln (Eq. 9). The somewhat higher flux than estimated from ammonia uptake values may reflect increased protein turnover with hyperammonemia or the uncertainties in the ammonia transport calculations.
These comparisons between the values determined for ΔVtrans, ΔVefflux, and ΔVpc from our data using the proposed model and those reported previously suggest that the lower estimate of ΔVgln may be more accurate owing to the more significant contribution from astrocyte-derived glutamate to glutamine synthesis under hyperammonemia.
Pathway of Glutamine Synthesis Under Normal Ammonemic Conditions.
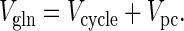
It appears, therefore, that under hyperammonemic conditions the increase in glutamine synthesis may be completely accounted for by anaplerosis and glutamine efflux from the brain, as determined from the model and values reported in the literature. From this agreement it may be inferred that the astrocytic component of glutamine synthesis may be estimated from the rate of ammonia transport into the brain. Under normal physiological conditions Vtrans is slow (≈0.02 μmol/min per g) owing to the extremely low plasma ammonia concentrations, as described above. We suggest, therefore, that the basal rate of glutamine synthesis results largely from substrate cycling between neurons and glia, with the driving force for the pathway being the rate of delivery of carbon skeletons to the astrocytes. In further support of this conclusion the minimum rate of glutamine synthesis (0.13 ± 0.05 μmol/min per g) determined for the control group is significantly higher than reported values for ammonia transport (29), glutamine efflux (21, 22, 24), and anaplerotic flux (32) under normal physiological conditions. Thus, the rate of glutamine synthesis is significantly higher than that required simply for detoxification of ammonia.
SUMMARY AND CONCLUSIONS
In summary, the NMR quantitation of glutamate and glutamine C-4 labeling with 13C, during a [1-13C]glucose infusion, enables the determination of dynamic events inaccessible to in vitro studies. During acute hyperammonemia the measured rate of glutamine synthesis (Vgln), estimated from the flux of 13C label from glutamate to glutamine, is increased 2-fold over normal levels. Modeling of cortical glutamine synthesis, which takes into account both carbon and nitrogen balance, suggests that if the basal level of glutamine synthesis is entirely for ammonia detoxification then this flux should have increased 7-fold under our hyperammonemic conditions. We conclude, therefore, that the rate of glutamine synthesis measured in normal rat brain by 13C NMR is predominantly a measure of substrate (primarly glutamate) cycling between neurons and glia and may directly reflect neuronal activity. It is possible that there is internal astrocytic cycling of carbon skeletons through glutaminase; however, studies suggest that the primary location of glutaminase is neuronal presynaptic terminals thus supporting a neuronal-glial neurotransmitter cycle.
The increase in glutamine synthesis under hyperammonemia shows that this pathway is the main route of ammonia detoxification within the brain, but it is misleading to consider this pathway as exclusively serving this role. Under normal physiological conditions, plasma ammonia concentration is closely regulated at a very low level, resulting in a slow rate of ammonia transport into the brain. Consequently, ammonia detoxification by glutamine synthetase is only ≈10% of the flux through this pathway under normal conditions. Under steady-state hyperammonemic conditions glutamine synthetase activity increases by an amount comparable to the increase in the rate of ammonia transport into the brain, with a concomitant increase in glutamine efflux from the brain. At the same time, the basal level of activity (Vcycle) is maintained to support the cycling of carbon skeletons between neurons and astrocytes. Under normal physiological conditions, Vpc, Vtrans, and Vefflux are all negligible, and consequently Vgln ≈ Vcycle. This potentially opens the way to determining neuronal activity (Vcycle) in the brain under a variety of stimulated and inhibited conditions, through the measurement of Vgln as described here. In addition, these changes in Vcycle (and by inference neuronal activity) may be correlated with corresponding changes in energy production obtained from the measurement of VTCA. We currently are investigating the relationship between Vcycle and neuronal activity.
Acknowledgments
We gratefully acknowledge the technical assistance of Terry Nixon, Pete Brown, Scott McIntyre, and Roger Boucher. We also would like to acknowledge the helpful suggestions of Drs. David Manor and Jun Shen on the stoichiometric relationship between nitrogen and carbon fluxes. This study was supported by National Institutes of Health Grants 2 RO1-DK27121, R29 NS32126–02 (D.L.R.) and 1 RO1-NS34813 (K.L.B.). G.F.M. was supported in part by National Center for Research Resources National Institutes of Health Grant RR-07723.
ABBREVIATIONS
- VTCA
tricarboxylic acid cycle flux
- Vgln
rate of glutamine synthesis
- Vtrans
rate of ammonia transport into the brain
- Vefflux
rate of glutamine efflux from the brain
- Vpc
rate of anaplerotic flux
- Vcycle
rate of substrate cycling between neurons and glia
- GABA
γ-aminobutyric acid
References
- 1.Ereciñska M, Silver I A. Prog Neurobiol. 1990;35:245–296. doi: 10.1016/0301-0082(90)90013-7. [DOI] [PubMed] [Google Scholar]
- 2.Cooper A J L, Plum F. Physiol Rev. 1987;67:440–519. doi: 10.1152/physrev.1987.67.2.440. [DOI] [PubMed] [Google Scholar]
- 3.Gruetter R, Novotny E J, Boulware S D, Rothman D L, Mason G F, Shulman G I, Shulman R G, Tamborlane W V. Proc Natl Acad Sci USA. 1992;89:1109–1112. doi: 10.1073/pnas.89.3.1109. [DOI] [PMC free article] [PubMed] [Google Scholar]
- 4.Gruetter R, Novotny E J, Boulware S D, Mason G F, Rothman D L, Shulman G I, Prichard J W, Shulman R G. J Neurochem. 1994;63:1377–1385. doi: 10.1046/j.1471-4159.1994.63041377.x. [DOI] [PubMed] [Google Scholar]
- 5.Mason G F, Rothman D L, Behar K L, Shulman R G. J Cereb Blood Flow Metab. 1992;12:434–447. doi: 10.1038/jcbfm.1992.61. [DOI] [PubMed] [Google Scholar]
- 6.Mason G F, Gruetter R, Rothman D L, Behar K L, Shulman R G, Novotny E J. J Cereb Blood Flow Metab. 1995;15:12–25. doi: 10.1038/jcbfm.1995.2. [DOI] [PubMed] [Google Scholar]
- 7.Kanamori K, Parivar F, Ross B D. NMR Biomed. 1993;6:21–26. doi: 10.1002/nbm.1940060104. [DOI] [PubMed] [Google Scholar]
- 8.Kanamori K, Ross B D. Biochem J. 1993;293:461–468. doi: 10.1042/bj2930461. [DOI] [PMC free article] [PubMed] [Google Scholar]
- 9.Kanamori K, Ross B D, Kuo E L. Biochem J. 1995;311:681–688. doi: 10.1042/bj3110681. [DOI] [PMC free article] [PubMed] [Google Scholar]
- 10.Fitzpatrick S M, Hetherington H P, Behar K L, Shulman R G. J Cereb Blood Flow Metab. 1990;10:170–179. doi: 10.1038/jcbfm.1990.32. [DOI] [PubMed] [Google Scholar]
- 11.Fitzpatrick S M, Hetherington H P, Behar K L, Shulman R G. J Neurochem. 1989;52:741–749. doi: 10.1111/j.1471-4159.1989.tb02517.x. [DOI] [PubMed] [Google Scholar]
- 12.Bax A. J Magn Reson. 1982;52:76–80. [Google Scholar]
- 13.Mason G F, Behar K L, Rothman D L, Shulman R G. J Cereb Blood Flow Metab. 1992;12:448–455. doi: 10.1038/jcbfm.1992.62. [DOI] [PubMed] [Google Scholar]
- 14.Lowry O H, Passonneau J V. A Flexible System of Enzymatic Analysis. New York: Academic; 1972. pp. 120–128. [Google Scholar]
- 15.Behar K L, Petroff O A C, Prichard J W, Alger J R, Shulman R G. Magn Reson Med. 1986;3:911–920. doi: 10.1002/mrm.1910030611. [DOI] [PubMed] [Google Scholar]
- 16.Rothman D L, Behar K L, Hetherington H P, den Hollander J A, Bendall M R, Petroff O A C, Shulman R G. Proc Natl Acad Sci USA. 1985;82:1633–1637. doi: 10.1073/pnas.82.6.1633. [DOI] [PMC free article] [PubMed] [Google Scholar]
- 17.Lewis L D, Ljunggren B, Ratcheson R A, Siesjö B K. Brain Res. 1974;77:173–186. doi: 10.1016/0006-8993(74)90782-3. [DOI] [PubMed] [Google Scholar]
- 18.Neeley W E, Phillipson J. Clin Chem. 1968;34:1868–1869. [PubMed] [Google Scholar]
- 19.van Anken H C, Schiphorst M E. Clin Chim Acta. 1974;56:151–157. doi: 10.1016/0009-8981(74)90223-x. [DOI] [PubMed] [Google Scholar]
- 20.Berl S, Takagaki G, Clarke D D, Waelsch H. J Biol Chem. 1962;237:2562–2569. [PubMed] [Google Scholar]
- 21.Hawkins R A, Miller A L, Nielsen R C, Veech R L. Biochem J. 1973;134:1001–1008. doi: 10.1042/bj1341001. [DOI] [PMC free article] [PubMed] [Google Scholar]
- 22.Gjedde A, Lockwood A H, Duffy T E, Plum F. Ann Neurol. 1978;3:325–330. doi: 10.1002/ana.410030409. [DOI] [PubMed] [Google Scholar]
- 23.Dejong C H C, Kampman M T, Deutz N E P, Soeters P B. J Neurochem. 1992;59:1071–1079. doi: 10.1111/j.1471-4159.1992.tb08349.x. [DOI] [PubMed] [Google Scholar]
- 24.Dejong C H C, Deutz N E P, Soeters P B. J Neurochem. 1993;60:1047–1057. doi: 10.1111/j.1471-4159.1993.tb03253.x. [DOI] [PubMed] [Google Scholar]
- 25.Schenker S, McCandless D W, Brophy E, Lewis M S. J Clin Invest. 1967;46:838–848. doi: 10.1172/JCI105583. [DOI] [PMC free article] [PubMed] [Google Scholar]
- 26.Hawkins R A, Mans A M. In: Handbook of Neurochemistry. Lajtha A, editor. Vol. 3. New York: Plenum; 1983. pp. 259–294. [Google Scholar]
- 27.Bates T E, Williams S R, Kauppinen R A, Gadian D G. J Neurochem. 1989;53:102–110. doi: 10.1111/j.1471-4159.1989.tb07300.x. [DOI] [PubMed] [Google Scholar]
- 28.Glantz S A. In: Primer of Biostatistics. Jeffers J D, Englis M R, editors. Singapore: McGraw-Hill; 1992. [Google Scholar]
- 29.Cooper A J L, McDonald J M, Gelbard A S, Gledhill R F, Duffy T E. J Biol Chem. 1979;254:4982–4992. [PubMed] [Google Scholar]
- 30.Bolander H G, Persson L, Hillered L, d’Argy R, Ponten U, Olsson Y. Stroke. 1989;20:930–937. doi: 10.1161/01.str.20.7.930. [DOI] [PubMed] [Google Scholar]
- 31.Mies G, Ishimaru S, Xie Y, Seo K, Hossman K-A. J Cereb Blood Flow Metab. 1991;11:753–761. doi: 10.1038/jcbfm.1991.132. [DOI] [PubMed] [Google Scholar]
- 32.Berl S, Takagaki G, Clarke D D, Waelsch H. J Biol Chem. 1962;237:2570–2573. [PubMed] [Google Scholar]
- 33.Waelsch H, Berl S, Rossi C A, Clarke D D, Purpura D P. J Neurochem. 1964;11:717–728. doi: 10.1111/j.1471-4159.1964.tb06117.x. [DOI] [PubMed] [Google Scholar]
- 34.Lai J C K, Cooper A J L. J Neurochem. 1986;47:1376–1386. doi: 10.1111/j.1471-4159.1986.tb00768.x. [DOI] [PubMed] [Google Scholar]
- 35.Jonung T, Rigotti P, James J H, Brackett K, Fischer J E. J Neurochem. 1985;45:308–318. doi: 10.1111/j.1471-4159.1985.tb05508.x. [DOI] [PubMed] [Google Scholar]
- 36.Jessy J, Mans A M, DeJoseph M R, Hawkins R A. Biochem J. 1990;272:311–317. doi: 10.1042/bj2720311. [DOI] [PMC free article] [PubMed] [Google Scholar]
- 37.Takahashi H, Koehler R C, Hirata T, Brusilow S W, Traystman R J. Circ Res. 1992;71:1220–1230. doi: 10.1161/01.res.71.5.1220. [DOI] [PubMed] [Google Scholar]
- 38.Hirata T, Koehler R C, Brusilow S W, Traystman R J. J Cereb Blood Flow Metab. 1995;15:835–844. doi: 10.1038/jcbfm.1995.104. [DOI] [PubMed] [Google Scholar]