Abstract
Using synchrotron radiation as an ultra-bright infrared source, we have been able to map the distributions of functional groups such as proteins, lipids, and nucleic acids inside a single living cell with a spatial resolution of a few microns. In particular, we have mapped the changes in the lipid and protein distributions in both the final stages of cell division and also during necrosis.
Vibrational spectroscopy is a potentially powerful analytical method for identifying the chemistry of biologically active materials in cells. It is a well established (1), nondestructive, analytical tool that is applied regularly to solving similar problems in analytical and physical chemistry, solid-state physics, materials science, and biology. Most molecules have vibrational modes with frequencies that lie in the mid-infrared spectral range between 3,300 cm−1 and 650 cm−1 (wavelengths from 3 μm to about 16 μm). Variations in the positions, widths, and strengths of these modes with composition and structure allow molecular species to be uniquely identified, including the functional groups of interest in cells. Identification of the vibrational modes of some of the major compounds (proteins, lipids, and nucleic acids) of biological materials has been performed both in normal and tumor tissues and cells (2–4) by using conventional Fourier transform infrared spectroscopy. Thus, vibrational spectroscopy should be highly useful as a contrast mechanism for imaging these groups, and the issue becomes one of achieving the appropriate microscopic spatial resolution.
The process of identifying and mapping functional groups in living cells by using vibrational modes as an intrinsic contrast mechanism (instead of the invasive stains and fixatives that are commonly employed in most cytological or microfluorimetric analyses) was demonstrated in the early 1990s with confocal Raman microspectrometry (5). However, the determination of the chemical distribution throughout an entire living cell has never been obtained by either infrared or Raman microspectrometry. For a mapping experiment, where the sample is moved through the probing light beam in a raster fashion, signal-to-noise considerations constrain both the minimum “pixel” volume and maximum scanned area that can be measured in a practical period of time. In Raman spectroscopy, the signal-to-noise ratio is determined by the power density that the sample can tolerate. Requirement for cell viability limits the laser light intensity, the laser wavelength, and the measuring time (6). Similar considerations hold for infrared spectroscopy, except that direct absorption is a linear process and far less power is required to achieve good signal-to-noise. Indeed, biological tissues can sustain much more power than is necessary for good-quality IR spectroscopy of areas a few microns in size. The limitation here has been the lack of a high-quality continuum source capable of delivering detectable power levels into very small areas. The quantity of interest in this case is the source brightness, i.e., the power produced per source area and solid angle, rather than its total power. Conventional mid-IR spectroscopy is performed with a thermal source at a temperature between 1,000 K and 1,500 K. Synchrotron radiation is 1,000 times brighter than standard thermal sources and, unlike lasers, is a white or continuum source, thus allowing all the multiplex advantages of Michelson interferometry to be used for the spectroscopy (7). It has been demonstrated that such a source, when combined with a commercial doubly confocal microscope, can indeed provide adequate signal-to-noise ratio to allow chemical distributions to be mapped with a spatial resolution approximately equal to the wavelength of a few microns (8). Note that although the source is bright, the total power delivered to a sample area 10 μm × 10 μm is on the order of 5 mW or less. Cells, situated on a suitable substrate, tolerate this incident power level as shown below.
In this study, we demonstrate that images of proteins, lipids, and nucleic acids can be obtained with a spatial resolution of a few microns inside intact, living cells, by using synchrotron infrared microspectrometry without the use of stains and fixatives. We show that functional groups can be identified and their concentration profiles mapped throughout living cells. Although the identification and mapping of such functional groups technically is very challenging, it may offer considerable new insight into the chemically based cell modifications. As examples, this study pinpoints the changes of the lipid distribution during the final step of cell division as well as the appearance of a carbonyl ester group during necrosis.
MATERIALS AND METHODS
Cells.
UN2.C3 cells were derived from the mouse UN2 hybridoma B cells (9). They were cultured at 37°C in RPMI 1640 medium supplemented with 10% heat-inactivated fetal calf serum, penicillin (100 units/ml), and streptomycin (100 μg/ml) (GIBCO/BRL) in a 5% CO2 humid atmosphere. To record IR spectra, the cells were deposited on a transparent IR window (barium fluoride, BaF2) by low-speed cytospin centrifugation. Cytospun cells, deposited on glass slides, deprived of culture medium, and examined for 2–3 h not in a humid 5% CO2 atmosphere may be affected in their ability to undergo further metabolic changes. Necrotic cells were obtained from a cell culture at the plateau, when more than 20–40% cells have died, as detected by a trypan blue exclusion assay, their lack of refringency and their morphological aspect under light.
IR Spectra.
Infrared microspectrometry is a commercially available technique, routinely used in various applied and fundamental fields. The optical system consists of an integrated Fourier transform-IR spectrometer and microscope optical module. A color charge-coupled device camera is able to capture the optical image of the inclusions under investigation. The objective and condenser of the confocal arrangement were Schwarzschild-reflecting designs. To prevent absorption from ambient (mainly water and CO2), the system can be purged by using dry nitrogen.
Briefly, after sample preparation, the cells were visualized through the microscope and an individual one was selected and positioned right on the microscope axis. The projected image of an aperture, positioned at the first focus point of the objective, determines the area that will be probed. The size of the aperture is set manually. The size of the lower aperture (confocal arrangement) is set so that it matches the projected image of the upper aperture. Then, the optical microscope is switched to its infrared configuration, allowing the infrared beam to pass through the sample area determined by the apertures. An automated X-Y mapping stage allows sample scanning, with a step accuracy of 1 μm. IR spectra were recorded by using a Spectra Tech Irμs scanning infrared microspectrometer and the National Synchroton Light Source at Brookhaven National Laboratory. Spectra were recorded in transmission with an instrumental resolution of 4 cm−1, and 128 scans were co-added before Fourier transform processing. Each spectrum is ratioed to a reference one, recorded with the same parameters and conditions, but outside the cell. After Fourier transform, the spectra were processed according to the following procedure. Linear baseline first was subtracted, to account for the continuous decay of the beam intensity inside the storage ring. Then integrated intensity of the band or massif under consideration was calculated.
RESULTS AND DISCUSSION
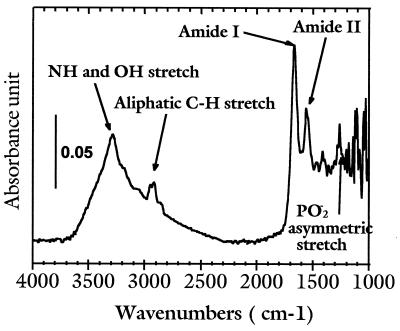
The major step that has opened up the detailed study of the spatial distribution of chemical compounds inside a cell is the ability to record an IR spectrum with a high signal-to-noise ratio for a sampling area much smaller than the typical size of a cell (10–30 μm). Such a spectrum for a hybridoma B cell is shown in Fig. 1. It was taken by using the high brightness synchrotron infrared radiation source at the National Synchrotron Light Source at Brookhaven National Laboratory, in combination with a Spectra Tech Irμs scanning infrared microspectrometer (10). In this instrument the infrared light is focused to a small spot at the sample, and the transmitted (or reflected) beam spectrum is measured. For the spectrum in Fig. 1, the beam was defined by an aperture of 3×3 μm2, so that the sampling area was about 1/100th that of the cell itself. Even through this aperture, an adequate signal-to-noise ratio could be obtained in about 1 min per sampling point as can be seen from Fig. 1. It should be noted that the signal collected is markedly reduced below approximately 1,200 cm−1, because of refraction and diffraction effects, some of which are from the BaF2 substrate used.
Figure 1.
Infrared spectrum of a mouse UN2 hybridoma B living cell, recorded with an aperture of 3×3 μm2. The instrumental resolution was set at 4 cm−1, and the spectrum displayed is the result of 128 co-added scans (the total recording time is 55 sec).
Though individual biochemical compounds have their own vibrational “fingerprints,” i.e., absorption bands with characteristic frequencies and relative intensities, the many organic molecules present in cells result in spectra with complex, overlapping absorption bands. This clearly is seen in the spectrum of Fig. 1, which appears to contain only a few bands. Accordingly, identification of individual molecular components is precluded. However, proteins, nucleic acids, and lipids can be readily identified through the observation of one or more spectral features associated with their characteristic functional groups as follows.
The band at 1,240 cm−1 originates from the asymmetric stretching mode of phosphodiester groups (PO2−) in nucleic acids (3). PO2− groups are also present in phospholipids, but their contribution to the 1,240 cm−1 band is negligible because the band corresponding to the carbonyl (CO) group of phospholipids, located at 1,740 cm−1, is not observed (3). Although this PO2− band is located in a spectral region of poorer signal-to-noise ratio, it is strong enough to be visible if present.
The bands at 1,545 cm−1 and 1,650 cm−1 correspond to amide II and amide I bands, respectively, and originate from the vibrations of the amide groups (CO-NH) of proteins (11). The H2O deformation band can also contribute to the intensity of the amide I band at 1,650 cm−1 (11). The bands that appear in the 2,850–2,960 cm−1 region are due to the symmetric and asymmetric stretching modes of methylene (CH2) and methyl (CH3) groups found in proteins and lipids (13, 14). The 3,300 cm−1 band arises from both the OH and NH stretching modes (H2O, proteins, and polysaccharides) (12, 13). Thus, it is possible to unambiguously map nucleic acids and proteins by the analyses of the phosphodiester (1,240 cm−1) and the amide II bands (1,545 cm−1), respectively.
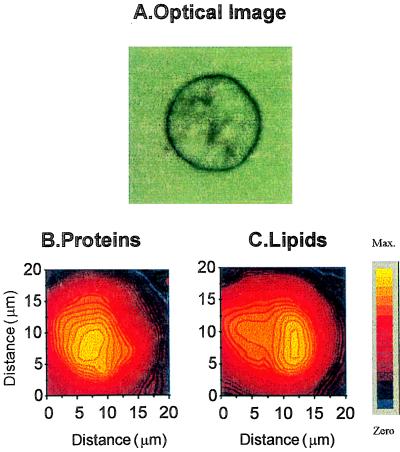
Mapping the lipids, however, is only possible if the CH2 and CH3 functional groups of proteins do not contribute significantly to the spectrum. Fig. 2 shows the intensity distribution of amide II and CH2 asymmetric stretching modes within an individual hybridoma B cell. A direct correlation between the variation of the integrated intensity of a given IR band and the local concentration change is inferred in this study. Thus, the cells that have been analyzed were selected to appear flat under light microscopic observation. Therefore, the intensity variation is mostly related to the local concentration change and not to a local thickness change. The amide II image (Fig. 2B), mapping the protein concentration, shows a quite homogeneous distribution around the center of the cell, covering almost all of it. This distribution is likely to correspond to the presence of nucleus because hybridoma B cells exhibit a large, centered nucleus whose size, as evidenced by 4′,6-diamidino-2-phenylindole staining, is similar to the size of the amide II image. However, the distribution of the asymmetric CH2 stretching mode at 2,929 cm−1 is not homogeneous (Fig. 2C) and thus departs markedly from that of the proteins. This adds credibility to the conclusion that this image represents the relative concentration of the lipids. Lipids are the major components of cell membranes (plasma and nuclear membranes, Golgi apparatus, endoplasmic reticulum, etc.) but are also found in the cytosol in the form of droplets (triglycerides). Thus, a heterogeneous distribution of the lipids would be expected in these hybridoma B cells.
Figure 2.
Chemical distribution of the protein and lipid characteristics of IR bands (amide II and CH2 asymmetric stretching bands, respectively). (A) Optical image. (B) Protein distribution. (C) Lipid distribution. The mapping has been obtained by analyzing the intensity variation of a two-dimensional set of infrared spectra (14×14 points, step equal to 3 μm). Each spectrum was recorded in transmission through a 3×3-μm2 aperture. The total recording time was 180 min. The spatial resolution is about between 2 and 3 μm.
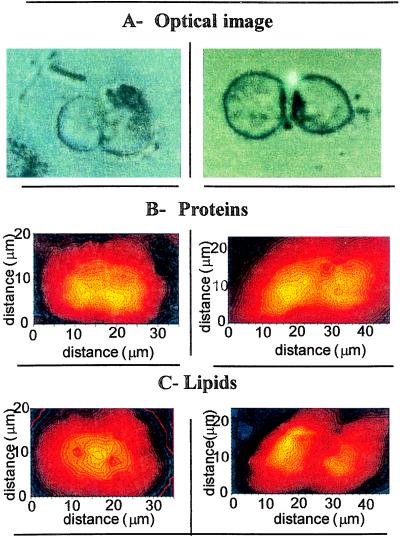
Having demonstrated that functional groups can be mapped, we then studied the concentration changes of the same chemical compounds in cells at late stages of mitosis. The optical image of a cell in the late telophase stage, with an almost completed cytokinesis, is shown at the left in Fig. 3A. Cells shown in Fig. 3A Right likely derive from a completed mitosis. For the cell in the late telophase stage, proteins are present throughout the whole cell, but their concentrations peak in two regions that may correspond to the two completed daughter nuclei with decondensing chromosomes (Fig. 3B Left). Of particular interest is the presence of a high concentration of lipids in the region where the contractile ring responsible for the cleavage furrow is located (Fig. 3C Left). This could correspond to the inward pulling of the lipids by this contractile ring occurring in that region just before cell division (14). In Fig. 3C Right, where cells are now separated, the lipids exhibit a heterogeneous distribution that now resembles the one observed in Fig. 2C. The protein distribution is also similar to the one observed in the isolated cell (Fig. 2B), although a significant protein concentration is observed at the interface between the two cells.
Figure 3.
Chemical distribution of proteins and lipids of cells undergoing mitosis. (A) Optical image. (B) Protein. (C) Lipid distributions. The images of protein and lipid distribution result from the analysis of sets of infrared spectra: 18×11 spectra every 2-μm step (aperture size 5×5 μm2, 4 cm−1 resolution, 128 scans for each spectrum) (B Left and C Left), and 13×9 spectra every 3-μm step (aperture size 3×3 μm2, 4 cm−1 resolution, 128 scans per spectrum) (B Right and C Right) were recorded.
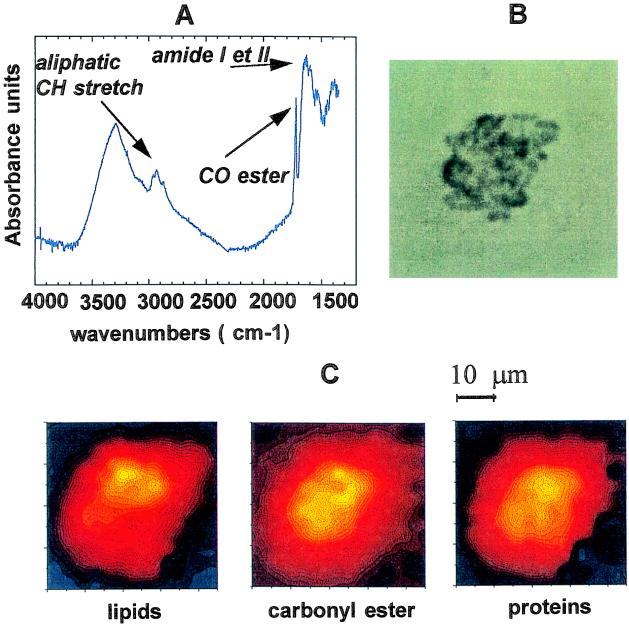
We also have made chemical images of dying cells and found major changes in the IR images in the case of a cell undergoing necrosis (Fig. 4B). Fig. 4A shows an IR spectrum of a necrotic cell. All the IR bands are much broader than those observed on viable cells (Fig. 1). This broadening indicates unfolding of the molecules containing the chemical compounds analyzed and/or an increased disorder in the molecular environment. The most striking difference is the appearance of a new, narrow band at 1,730 cm−1, which was not present on the IR spectrum of viable cells (Fig. 1). This band was assigned to carbonyl ester groups (12, 13), different from carbonyl groups of phospholipids, which appear as a shoulder at 1,740 cm−1 on the left side of the 1,730-cm−1 peak. The distribution of nucleic acids, as defined by the band at 1,240 cm−1, could not be determined, because of the very low signal-to-noise ratio. Chemical imaging of the CH2 (lipids), amides I/II (proteins), and carbonyl ester groups are shown in Fig. 4C. One can see that carbonyl ester group distribution in the necrotic cell is different from the lipid and protein distribution. Observations of these major changes provide a promising way to study the chemical changes during cell apoptosis and to help to understand these processes.
Figure 4.
Infrared spectrum and chemical distributions of functional groups of a necrotic cell. (A) Infrared spectrum recorded with an aperture of 5×5 μm2. The instrumental resolution was set at 4 cm−1, and the spectrum displayed is the result of 128 co-added scans. (B) Optical image. (C) Lipid, carbonyl ester group, and protein distributions. The chemical distributions are the result of the analysis of 15×14 spectra; each spectrum is recorded every 3-μm step by using an aperture size of 5×5 μm2 and a 4 cm−1 resolution (128 scans per spectrum).
In conclusion, we have demonstrated that IR microspectrometry using a very bright synchrotron source makes it possible to acquire unprecedented, highly resolved distributions of chemical groups within a single living cell. Thus, it could help shed light on the molecular changes that occur in cells particularly when combined with other imaging techniques that define specific molecules (fluorescence microscopy) or intracellular organites (electronic microscopy). This pioneer work demonstrates that synchrotron infrared microspectrometry of single untreated cells may help to reveal new aspects of the biology of single cells. Clearly, more statistical work now is needed to reinforce the significance of the data obtained with this new cell-imaging technique. Finally, we note that improvements in the synchrotron source brightness, currently underway, in the responsivity of the infrared detectors and in the experimental set-up for maintaining cells in culture condition, should lead to considerable gains in signal-to-noise ratio, reduction of acquisition time, and improvement in data quality.
Acknowledgments
We thank P. Freimuth and N. Ruthedek, for their invaluable help during cell handling and preparation at Brookhaven National Laboratories and L. Miller for very fruitful discussions. This work was supported in part by the Institut National de la Santé et de la Recherche Médicale and Institut Curie.
Footnotes
This paper was submitted directly (Track II) to the Proceedings Office.
References
- 1.Griffiths P R, De Haseth J A, editors. Fourier Transform Infrared Spectroscopy. New York: Wiley; 1986. [Google Scholar]
- 2.Wong P T T, Rigas B. Appl Spectrosc. 1990;44:1715–1718. [Google Scholar]
- 3.Wong P T T, Rigas B. Appl Spectrosc. 1991;45:1563–1567. [Google Scholar]
- 4.Wong P T T, Wong R K, Caputo T A, Godwin T A, Rigas B. Proc Natl Acad Sci USA. 1991;88:10988–10992. doi: 10.1073/pnas.88.24.10988. [DOI] [PMC free article] [PubMed] [Google Scholar]
- 5.Puppels G J, De Mul F F M, Otto C, Greve J, Robert-Nicoud M, Arndt-Jovin D J, Jovin T M. Nature (London) 1990;347:301–303. doi: 10.1038/347301a0. [DOI] [PubMed] [Google Scholar]
- 6.Puppers G J, Olminkhof J H F, Segers-Nolten M J, Otto C, De Mul F F M, Greve J. Exp Cell Res. 1991;195:361–367. doi: 10.1016/0014-4827(91)90385-8. [DOI] [PubMed] [Google Scholar]
- 7.Duncan W D, Williams G P. Appl Optics. 1983;22:2914–2923. doi: 10.1364/ao.22.002914. [DOI] [PubMed] [Google Scholar]
- 8.Carr G L, Reffner J A, Williams G P. Rev Sci Instrum. 1995;66:1490–1492. [Google Scholar]
- 9.Brunati S, Miossec C, Mathiot C, Moncuit J, Amigorena S, Teillaud J-L, Fridman W H. Mol Immunol. 1988;25:1133–1142. doi: 10.1016/0161-5890(88)90148-4. [DOI] [PubMed] [Google Scholar]
- 10.Carr G L, Hanfland M, Williams G P. Rev Sci Instrum. 1995;66:1643–1645. [Google Scholar]
- 11.Susi H, Byler D M. Methods Enzymol. 1986;130:290–311. doi: 10.1016/0076-6879(86)30015-6. [DOI] [PubMed] [Google Scholar]
- 12.Siebert F. Methods Enzymol. 1995;246:501–526. doi: 10.1016/0076-6879(95)46022-5. [DOI] [PubMed] [Google Scholar]
- 13.Peticolas W L. Methods Enzymol. 1995;246:389–416. doi: 10.1016/0076-6879(95)46019-5. [DOI] [PubMed] [Google Scholar]
- 14.Conrad G W, Schantz A R, Patron R R. Ann NY Acad Sci. 1990;582:273–277. doi: 10.1111/j.1749-6632.1990.tb21686.x. [DOI] [PubMed] [Google Scholar]


