

Abstract
Expression of GLUT4 is decreased in adipocytes in obesity and type 2 diabetes, contributing to the insulin resistance of these states. Recent investigations suggest a role for activation of the ER stress response in the pathophysiology of type 2 diabetes. We investigated activation of the ER stress response in 3T3-L1 adipocytes. We show that activation of the ER stress response decreased GLUT4 expression at the level of gene transcription. Activation of the ER stress response also increased the expression of CHOP10, an inhibitor of the activity and expression of C/EBPα. As expected, activation of the ER stress response decreased expression of C/EBPα, an activator of GLUT4 expression, providing a mechanism to account for the repression of GLUT4 by ER stress activation. Our studies identify repression of GLUT4 expression as another potential mechanism for obesity-induced activation of the ER stress response to contribute to the insulin resistance of obesity.
Keywords: insulin resistance, diabetes, CHOP10, C/EBP, ER stress, unfolded protein response, UPR, gadd153
GLUT4 is the major insulin-responsive glucose transporter, and is primarily expressed in adipose tissue, skeletal muscle and cardiac muscle [1,2]. Insulin binding to its receptor initiates a cascade of events resulting in translocation of GLUT4 from an intracellular compartment and insertion into the plasma membrane. The insulin resistance of type 2 diabetes mellitus includes a blunting of the insulin-stimulated increase in glucose uptake into fat and muscle. In muscle, this is due to a defective stimulation of GLUT4 translocation [2,3]. In adipocytes, the decreased insulin sensitivity is due to both this defect in insulin-stimulated translocation, as well as to decreased expression of GLUT4 [2–4].
GLUT4 protein and mRNA levels are decreased in adipocytes in human obesity and type 2 diabetes, as well as in numerous rodent models of insulin resistance [3]. Although adipose tissue accounts for only a small fraction of glucose disposal after a meal, decreased GLUT4 expression in adipocytes can affect glucose homeostasis [4]. Mice lacking GLUT4 in adipocytes display insulin resistance in muscle and liver, resulting in abnormal glucose control and overall impaired insulin sensitivity [5]. In addition, when GLUT4 expression is selectively increased in adipose tissue of mice, the animals show increased insulin sensitivity and enhanced glucose tolerance [6].
A number of transcription factors that regulate GLUT4 expression have been identified, each of which could play a role in the repression of GLUT4 expression in adipocytes in insulin resistant states [1,7–10]. MEF2, C/EBP, KLF15, LXR, and GEF have all been characterized as activators of GLUT4 expression. O/E and NF1 proteins have not been directly demonstrated to either activate or repress GLUT4 expression, but we have demonstrated that they participate in the down-regulation of GLUT4 expression in 3T3-L1 adipocytes when these cells are treated with insulin or cyclic-AMP analogs.
In our prior investigations, we found that proteasome inhibition represses GLUT4 expression in 3T3-L1 adipocytes [11]. The ability of proteasome inhibition to repress GLUT4 expression at the level of transcription suggested that such treatments alter the expression of transcription factors that regulate GLUT4 expression. Therefore, we examined changes in expression of these transcription factors. Through these investigations, we have found that activation of the endoplasmic reticulum (ER) stress response decreases GLUT4 expression in 3T3-L1 adipocytes, and that this repression is likely mediated through the well-described increase in expression of CHOP10 that occurs with activation of the ER stress response.
Materials and Methods
Cell culture
3T3-L1 cells were maintained in culture as previously described [11]. 3T3-L1 adipocytes were treated with proteasome inhibitors or vehicle beginning 8–10 days after differentiation was induced. Actinomycin D, cycloheximide, lactacystin, thapsigargin, tunicamycin and MG132 (carbobenzoxy-l-leucyl-l-leucyl-l-leucinal) were obtained from Sigma (St. Louis, MO). They were dissolved in dimethylsulfoxide (DMSO, Sigma) with the final concentration of DMSO that cells were exposed to being no greater than 0.2%.
Western immunoblot analysis
Nuclei from three identically-treated 10-cm dishes were harvested together as previously described [12], with nuclear proteins extracted in NUN buffer (0.3M NaCl, 1 M urea, 1% Igepal CA-630, 25 mM Hepes (pH 7.9), and 1mM dithiothreitol) and stored at −80°C in NUN buffer with 10% glycerol. Protein was quantitated by the Bradford assay (Biorad, Hercules, CA). Western immunoblot was performed as previously described [13]. Antibodies to the NF1 isoforms were prepared by inoculating rabbits with KLH-conjugated isoform-specific polypeptides (A: ADIKDQPENGHLC; B: RTWHERDQDM; C: GSDQEDSKPITLC, and X: CNQQGDADIKPLP; Covance, Denver, PA and Sigma Genosys, The Woodlands, TX). PPARγ antibody was provided by Dr. Mitchell Lazar (University of Pennsylvania) and C/EBPα antibody was provided by Dr. M. Daniel Lane (Johns Hopkins University.) The remaining antibodies were obtained from commercial sources: GLUT4: Chemicon Int., Temecula, CA; MeF2A, LXR, and CHOP10: Santa Cruz Biotechnology, Inc., Santa Cruz, CA; MeF2D: BD Bioscience, San Jose, CA. The Western immunoblots were developed with peroxidase-conjugated antibody (Sigma) and an enhanced chemiluminescent reagent (Amersham, Piscataway, NJ).
Nuclear run-on assay
Nuclear run-on assays were performed using the quantitative RT-PCR-based assay described by Patrone et al. [14]. Three 100 mm dishes of control or treated 3T3-L1 adipocytes were pooled and nuclei were isolated by lysis with Igepal CA-630 [15]. The DNA content of the nuclei was quantitated by lysing an aliquot in 1% SDS, 40 mM Tris, pH 8.0 and measuring the UV absorbance at 260 nm. Nascent RNA transcripts from aliquots of nuclei with equivalent DNA content were extended in the presence of biotin-16-UTP. RNA was purified using Trizol (Invitrogen, Carlsbad, CA), and the extended RNA was isolated using streptavidin-coupled Dynabeads M-280 and a magnetic particle concentrator (Invitrogen, Calsbad, CA.). RNA levels were quantitated by real-time RT-PCR from equal aliquots of purified RNA. Run-on expression levels were calculated after normalization with run-on 18S expression.
Quantitative RT-PCR
Total RNA was isolated from cells using the Nucleospin II Kit (Clonetech, Mountain View, CA.). cDNA was synthesized and then amplified using the Brilliant SYBR Green QRT-PCR Master Mix Kit, 1-Step (Stratagene, La Jolla, CA) and template-specific primers. 40 ng of total RNA per reaction was used to quantitate all templates except 18S RNA, where 160 pg per reaction was used. Primer concentration was 200 nM for GLUT4, 100 nM for all other reactions. The RT reaction was at 50°C for 30 min., inactivation at 95°C for 15 min; the PCR protocol was denaturation at 94°C for 15 sec., annealing at the appropriate temperature (Supplemental Table 1) for 30 sec., extension at 72°C for 30 sec. During assay development, RT-PCR reaction products were separated on an agarose gel to verify product size. All reactions included a dissociation curve analysis at the end of the amplification to confirm a single product at the expected melting temperature. Quantitative real-time PCR reactions were run on the Stratagene MX4000 quantitative PCR system. Relative quantitation of gene expression was performed using the threshold cycle (Ct) and a standard curve for each reaction, as described by the manufacturer. Changes in mRNA expression level were calculated after normalization with 18S expression. Primers used for the QRT-PCR reactions are given in Supplemental Table 1.
Results and discussion
Proteasome inhibition increases CHOP10 protein levels
We had previously demonstrated that proteasome inhibition in 3T3-L1 adipocytes decreased expression of GLUT4 at the level of transcription. To explore the mechanism of this regulation, we used Western immunoblot analysis to investigate the effect of proteasome inhibition on the level of known regulators of GLUT4 expression. There was no significant change in the protein level of LXR, PPARγ, MEF2D or the A, B, and X isoforms of NF1 in 3T3-L1 adipocytes treated with the proteasome inhibitor MG132 for 24 hours (Supplementary Fig. 1). Immunoblots for PGC-1, GEF, O/E-1 (EBF-1), and KLF-15 did not give strong predominating signals at the expected size for the protein, suggesting low level of expression of these proteins in 3T3-L1 adipocytes; however, there was no apparent change in the level of expression of these proteins with proteasome inhibition. NF1-C protein expression was decreased by approximately 50% after 24 hours of proteasome inhibition (P < 0.05, Supplementary Fig. 1.) Western immunoblot using MEF2A antibody detected multiple proteins in 3T3-L1 adipocytes migrating between 56 and 65 kDa. Treatment with MG132 for 6 or 24 hours resulted in a change in the pattern of proteins detected: there was a predominance of a faster migrating isoform in control cells, while there was a predominance of a slower migrating isoform after proteasome inhibition (Supplementary Fig. 2). These data suggest that a change in MEF2 isoform expression or in the protein level of NF1-C may play a role in regulating GLUT4 expression in response to proteasome inhibition. These possibilities were not further investigated in these studies, but warrant future investigation.
C/EBP proteins regulate numerous adipocyte genes, including GLUT4; C/EBPα is the predominant family member in mature adipocytes. Expression of C/EBPα protein is markedly decreased by proteasome inhibition by either MG132 or lactacystin in 3T3-L1 adipocytes (Fig.1). As C/EBP proteins are known to activate expression of GLUT4, this marked repression of C/EBPα could be a significant contributor to the decreased expression of GLUT4 that occurs with proteasome inhibition. However, in our prior studies, and confirmed here (Fig. 2), GLUT4 mRNA level was decreased after 6 hours of proteasome inhibition, and GLUT4 transcription was decreased after 3 h hours of proteasome inhibition, while C/EBPα protein levels showed no decrease at 8 hours (Fig. 1). Thus, another mechanism must account for the early decrease in GLUT4 expression.
Figure 1.

Proteasome inhibition represses C/EBPα expression and increases CHOP10 expression in 3T3-L1 adipocytes. Nuclear proteins were extracted from 3T3-L1 adipocytes treated with 10 µM MG132 or 10 µM lactacystin (lac), for the indicated times. Western immunoblot was performed using antibodies to C/EBPα and CHOP10. Three independent experiments were performed; a representative result is shown.
Figure 2.
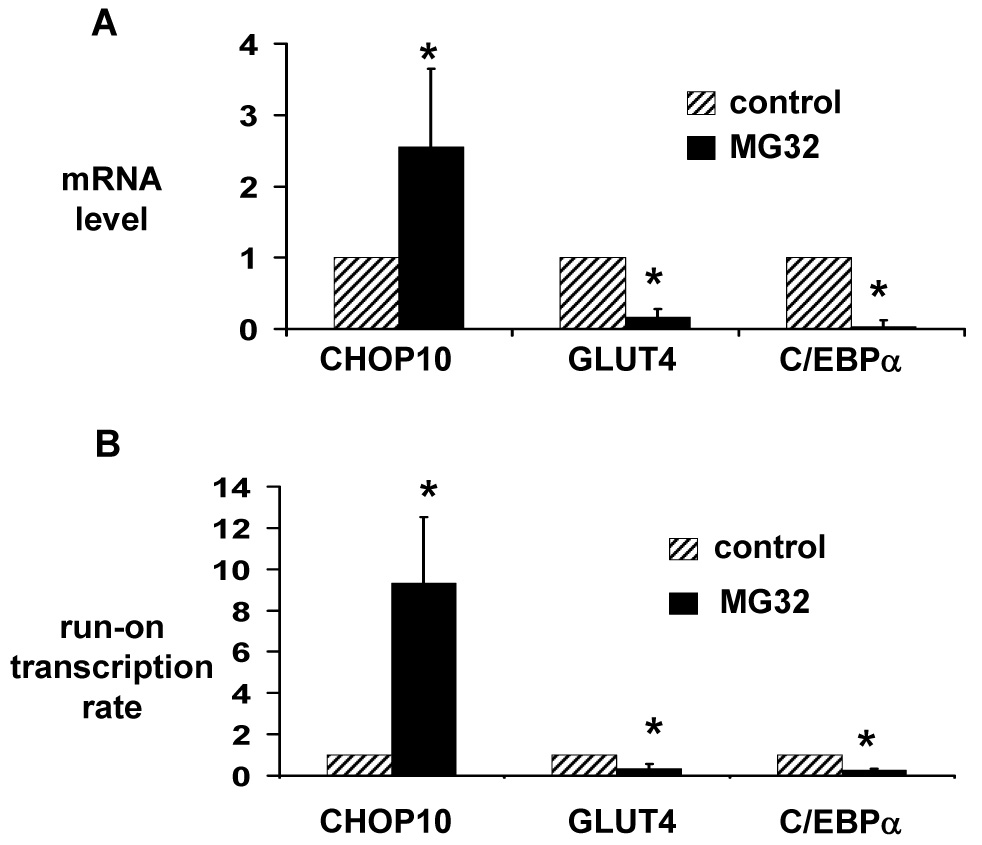
Proteasome inhibition induces expression of the CHOP10 gene, and represses expression of the GLUT4 and C/EBPα genes in 3T3-L1 adipocytes. (A) Total RNA was isolated from 3T3-L1 adipocytes treated with 10 µM MG132 or vehicle (control) for 6 hours. Quantitative real-time RT-PCR was used to quantitate CHOP10, GLUT4, and C/EBPα mRNA levels. mRNA levels are expressed relative to levels in vehicle-treated cells, after controlling for 18S RNA expression level. (B) Nuclei were isolated from 3T3-L1 adipocytes treated with 10 µM MG132 or vehicle (control) for 3 hours. Run-on transcription was performed in the presence of biotin-16-UTP, and newly formed transcripts were purified using streptavidin-coupled Dynabeads M-280. Quantitative real-time RT-PCR was used to quantitate CHOP10, GLUT4, and C/EBPα transcript levels, which are expressed relative to levels in vehicle-treated cells, after controlling for 18S RNA expression level. Results represent the mean of 5 (A) or 3 (B) independent experiments; error bars indicate one standard deviation. * P < 0.05 vs. control.
CHOP10, (C/EBP-homologous protein 10; also called gadd153 – growth arrest and DNA damage inducible 153) is another member of the C/EBP family, having a high degree of sequence similarity to C/EBP proteins in the basic leucine zipper region, allowing it to heterodimerize with other C/EBP members. However, CHOP10 lacks an amino-terminal transactivation domain, and contains 2 prolines in the place of basic residues in the DNA binding domain – because of this, heterodimers of CHOP10 with C/EBP proteins are unable to bind to DNA, so that CHOP10 acts as an endogenous inhibitor of C/EBP gene activation [16]. Therefore, we considered whether the repression of GLUT4 expression occurring with proteasome inhibition might be due to an increase in CHOP10 expression. As seen in figure 1, by 4 hours (the earliest time point examined) there is a dramatic increase in CHOP10 protein level in 3T3-L1 adipocytes treated with proteasome inhibitor. Because C/EBPα activates its own expression, the increased expression of CHOP10 can decrease GLUT4 expression by two mechanisms: initially CHOP10 can decrease GLUT4 expression by forming heterodimers with C/EBPα, blocking activation of the GLUT4 gene by C/EBPα; subsequently, the effect of CHOP10 to decrease C/EBPα expression by inhibiting C/EBPα activation of its own gene results in decreased quantities of C/EBPα protein available to activate the GLUT4 gene.
Proteasome inhibition increases CHOP10 gene transcription
The increase in CHOP10 protein level could be a direct effect of proteasome inhibition decreasing the rate of its degradation. However, there was no increase in CHOP10 protein expression with proteasome inhibition if new protein synthesis was simultaneously inhibited with cycloheximide (Fig. 3). In addition, proteasome inhibition increased CHOP10 mRNA level 2.5-fold at 6 hours and increased CHOP10 transcription 9.3-fold at 3 hours (Fig. 2). When 3T3-L1 adipocytes were treated with the RNA synthesis inhibitor actinomycin D to block the increase in CHOP10 mRNA, there was a marked attenuation in the increase in CHOP10 protein level with proteasome inhibition (Fig. 3). Thus, proteasome inhibition increases CHOP10 protein levels through an increased expression of the CHOP10 gene, rather than simply through decreasing its rate of degradation.
Figure 3.
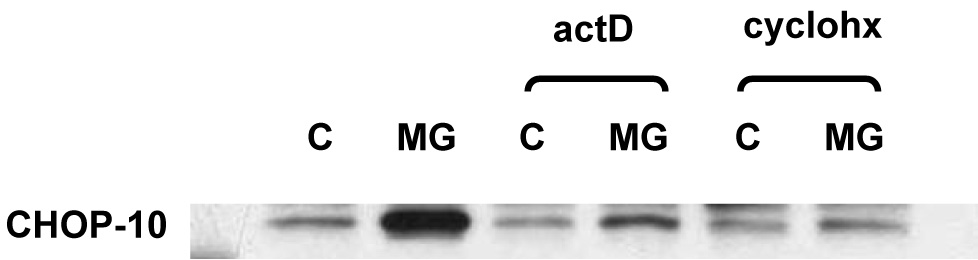
Induction of CHOP10 in 3T3-L1 adipocytes by proteasome inhibition is attenuated by inhibition of either new RNA or new protein synthesis. Nuclear proteins were extracted from 3T3-L1 adipocytes 3T3-L1 treated for 24 hours with 10 µM MG132 (MG) or vehicle (control, C) in the presence or absence of 5 µg/ml actinomycin D (actD) or 10 µg/ml cycloheximide (cyclohx). Western immunoblot was performed using CHOP10 antibody. Three independent experiments were performed; a representative result is shown.
Activation of the endoplasmic reticulum stress response represses GLUT4 expression
After finding evidence that proteasome inhibition represses GLUT4 expression in 3T3-L1 adipocytes through activation of CHOP10 expression, we wished to investigate possible mechanisms for this regulation to act in vivo. The endoplasmic reticulum (ER) stress response, also called the unfolded protein response (UPR), is a coordinated response to an accumulation of misfolded proteins in the endoplasmic reticulum [17,18]. This process helps to diminish the accumulation of misfolded proteins by: 1) decreasing the overall rate of protein translation leading to a decrease in the amount of protein delivered to the ER; 2) increasing the capacity for correct folding of proteins in the ER by increasing the protein levels of chaperone proteins and other proteins involved in the folding process (through an increase in protein translation of specific proteins as well as increased gene expression of specific targets); and 3) increasing the elimination of misfolded proteins by increasing their degradation in the proteasome. Proteasome inhibition, by decreasing the degradation of misfolded proteins, activates the ER stress response [18]. In addition, CHOP10 is one of the genes whose expression is increased by the ER stress response [19,20]. Thus, we were interested in determining whether activation of the ER stress response might be responsible for the repression of GLUT4 that we observed in 3T3-L1 adipocytes treated with proteasome inhibitors.
We first investigated whether treatment with MG132 activated the ER stress response in 3T3-L1 adipocytes. BiP is the major chaperone protein of the ER lumen. Its expression is increased with activation of the ER stress response [21,22]. BiP mRNA expression, determined by quantitative real-time RT-PCR, was increased 20.9-fold in 3T3-L1 adipocytes treated with 10µM MG132. Thus, treatment of 3T3-L1 adipocytes with MG132 at a concentration that represses GLUT4 expression activates the ER stress response.
We next investigated whether activation of the ER stress response itself would repress GLUT4 expression. To do this, we treated cells with compounds that activate the ER stress response through mechanisms other than proteasome inhibition. 3T3-L1 cells were treated with the glycosylation inhibitor tunicamycin, or with thapsigargin, which induces ER calcium release; both are potent inducers of the ER stress response [21]. BiP mRNA was increased 17.9-fold when 3T3-L1 adipocytes were treated for 6 hours with 2.5 µg/ml tunicamycin and was increased 21.6-fold when the cells were treated for 6 hours with 2.5 µM thapsigargin, confirming activation of the ER stress response by these compounds in 3T3-L1 adipocytes. Similar to the response with the proteasome inhibitor MG132, activation of the ER stress response with either tunicamycin or thapsigargin decreased GLUT4 expression (p < 0.05; Fig. 4.) And just as was seen with proteasome inhibition, these activators of ER stress also increased CHOP10 expression, and decreased C/EBPα expression (p < 0.05 for both; Fig. 4.)
Figure 4.
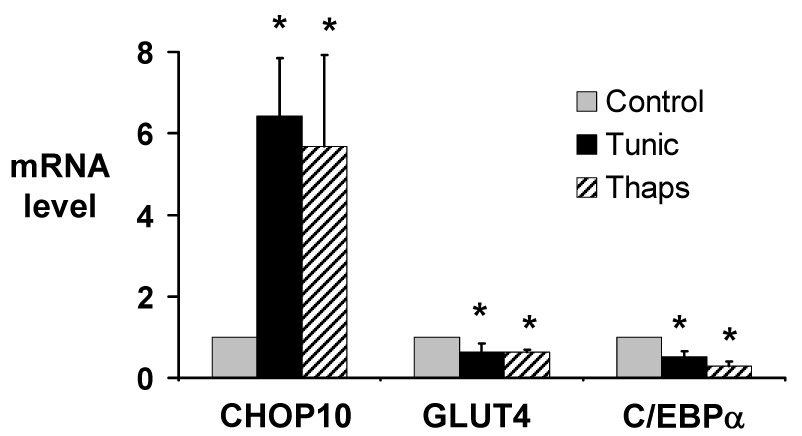
Activation of the ER stress response in 3T3-L1 adipocytes increases expression of CHOP10, and represses expression of GLUT4 and C/EBPα. Total RNA was purified from 3T3-L1 adipocytes treated with 2.5 µg/ml tunicamycin (Tunic), 2.5 µM thapsigargin (Thaps), or vehicle (Control) for 6 hours. Quantitative real-time RT-PCR was used to quantitate CHOP10, GLUT4, and C/EBPα mRNA levels. mRNA levels are expressed relative to levels in vehicle-treated cells, after controlling for 18S RNA expression level. Results represent the mean of 4 independent experiments; error bars indicate one standard deviation. * P < 0.05 vs. control.
Recent investigations have demonstrated a potential role of the ER stress response in type 2 diabetes. These studies have identified mechanisms through which the ER stress response could contribute to β-cell dysfunction [23,24], as well as demonstrating involvement of the ER stress response in insulin resistance [25]. Most significant to the studies reported here, Özcan et al. demonstrated that the ER stress response is activated in liver and adipose tissue of obese, insulin resistant mice [25]. They found that that the ER stress response activates JNK1 – which participates in insulin resistance by phosphorylating IRS-1 on serine residues, leading to impaired insulin signaling [25]. They also found that an intact ER stress response was necessary to limit obesity-induced insulin resistance, as mice with a depletion of the ER stress response signaling protein XBP-1 had an increased susceptibility to insulin resistance induced by a high-fat diet. More support for the role of the ER stress response in insulin resistance comes from studies of ORP 150, a molecular chaperone that protects cells from ER stress. Nakatani et al. found that over-expression of ORP150 in mouse liver improves insulin sensitivity, while depletion of ORP150 worsens insulin resistance [26]. Finally, Özcan et al. demonstrated that insulin resistance and hyperglycemia can be alleviated in mice treated with agents that decrease ER stress [27].
While the ER stress response helps to eliminate the accumulation of misfolded proteins, prolonged or excessive ER stress is linked to the development of programmed cell death. This is a potential mechanism connecting ER stress with β-cell dysfunction in type 2 diabetes, as there is evidence that ER stress contributes to the free fatty acid-induced apoptosis of β-cells [23]. Although the mechanisms linking ER stress and apoptosis are incompletely understood, the induction of CHOP10 plays an important role, including ER stress-induced apoptosis of β-cells [28]. However, since diet-induced obesity activates the ER stress response in adipocytes [25] without increasing adipocyte apoptosis, activation of the ER stress response in this case does not appear to activate the apoptosis pathway.
We have found that activation of the ER stress response represses GLUT4 expression in 3T3-L1 adipocytes. Combined with the evidence that the ER stress response is activated in adipocytes in diet-induced obesity [25], these findings indicate that the activation of the ER stress response may be a significant contributor to the repression of GLUT4 expression in adipocytes in insulin resistant states. In addition these studies suggest that repression of GLUT4 expression in adipocytes is an additional mechanism through which activation of the ER stress response induces insulin resistance in obesity.
Supplementary Material
Regulation of transcription factor protein levels by proteasome inhibition in 3T3-L1 adipocytes. Nuclear proteins were extracted from 3T3-L1 adipocytes treated with 10 µM MG132 (MG) or vehicle (control, C) for 24 hours. Western immunoblot was performed using antibodies to MEF2D, LXR, PPARAγ, NF1-A, NF1-B, NF1-C, and NF1-X. Three or more independent experiments were performed; a representative result is shown.
Proteasome inhibition alters the expression of MEF2A isoforms in 3T3-L1 adipocytes. Nuclear proteins were extracted from 3T3-L1 adipocytes treated with 10 µM MG132 (MG) or vehicle (control, C) for 6 or 24 hours. Western immunoblot was performed using antibody to MEF2A. Size markers (kDa) are indicated. Three independent experiments were performed; a representative result is shown.
Acknowledgments
This work was supported by grants from the National Institutes of Health: DK55831 (DWC) and DK007751 (RSM) and the Ilyssa Center for Molecular and Cellular Endocrinology.
Footnotes
Publisher's Disclaimer: This is a PDF file of an unedited manuscript that has been accepted for publication. As a service to our customers we are providing this early version of the manuscript. The manuscript will undergo copyediting, typesetting, and review of the resulting proof before it is published in its final citable form. Please note that during the production process errors may be discovered which could affect the content, and all legal disclaimers that apply to the journal pertain.
References
- 1.Huang S, Czech MP. The GLUT4 glucose transporter. Cell Metab. 2007:237–252. doi: 10.1016/j.cmet.2007.03.006. [DOI] [PubMed] [Google Scholar]
- 2.Watson RT, Kanzaki M, Pessin JE. Regulated membrane trafficking of the insulin-responsive glucose transporter 4 in adipocytes. Endocr.Rev. 2004:177–204. doi: 10.1210/er.2003-0011. [DOI] [PubMed] [Google Scholar]
- 3.Shepherd PR, Kahn BB. Glucose Transporters and Insulin Action: Implications for Insulin Resistance and Diabetes Mellitus. New England Journal of Medicine. 1999:248–257. doi: 10.1056/NEJM199907223410406. [DOI] [PubMed] [Google Scholar]
- 4.Minokoshi Y, Kahn CR, Kahn BB. Tissue-specific ablation of the GLUT4 glucose transporter or the insulin receptor challenges assumptions about insulin action and glucose homeostasis. J.Biol.Chem. 2003:33609–33612. doi: 10.1074/jbc.R300019200. [DOI] [PubMed] [Google Scholar]
- 5.Abel ED, Peroni O, Kim JK, Kim YB, Boss O, Hadro E, Minnemann T, Shulman GI, Kahn BB. Adipose-selective targeting of the GLUT4 gene impairs insulin action in muscle and liver. Nature. 2001:729–733. doi: 10.1038/35055575. [DOI] [PubMed] [Google Scholar]
- 6.Shepherd PR, Gnudi L, Tozzo E, Yang H, Leach F, Kahn BB. Adipose cell hyperplasia and enhanced glucose disposal in transgenic mice overexpressing GLUT4 selectively in adipose tissue. Journal of Biological Chemistry. 1993:22243–22246. [PubMed] [Google Scholar]
- 7.Zorzano A, Palacin M, Guma A. Mechanisms regulating GLUT4 glucose transporter expression and glucose transport in skeletal muscle. Acta Physiol Scand. 2005:43–58. doi: 10.1111/j.1365-201X.2004.01380.x. [DOI] [PubMed] [Google Scholar]
- 8.Olson AL, Knight JB. Regulation of GLUT4 expression in vivo and in vitro. Front Biosci. 2003:s401–s409. doi: 10.2741/1072. [DOI] [PubMed] [Google Scholar]
- 9.Kaestner KH, Christy RJ, Lane MD. Mouse insulin-responsive glucose transporter gene: characterization of the gene and trans-activation by the CCAAT/enhancer binding protein. Proceedings of the National Academy of Sciences, U.S.A. 1990:251–255. doi: 10.1073/pnas.87.1.251. [DOI] [PMC free article] [PubMed] [Google Scholar]
- 10.Dalen KT, Ulven SM, Bamberg K, Gustafsson JA, Nebb HI. Expression of the insulin-responsive glucose transporter GLUT4 in adipocytes is dependent on liver X receptor alpha. J.Biol.Chem. 2003:48283–48291. doi: 10.1074/jbc.M302287200. [DOI] [PubMed] [Google Scholar]
- 11.Cooke DW, Patel YM. GLUT4 expression in 3T3-L1 adipocytes is repressed by proteasome inhibition, but not by inhibition of calpains. Mol.Cell Endocrinol. 2005:37–45. doi: 10.1016/j.mce.2004.12.008. [DOI] [PubMed] [Google Scholar]
- 12.Cooke DW, Lane MD. A sequence element in the GLUT4 gene that mediates repression by insulin. Journal of Biological Chemistry. 1998:6210–6217. doi: 10.1074/jbc.273.11.6210. [DOI] [PubMed] [Google Scholar]
- 13.Cooke DW, Lane MD. Transcription factor NF1 mediates repression of the GLUT4 promoter by insulin. Journal of Biological Chemistry. 1999:12917–12927. doi: 10.1074/jbc.274.18.12917. [DOI] [PubMed] [Google Scholar]
- 14.Patrone G, Puppo F, Cusano R, Scaranari M, Ceccherini I, Puliti A, Ravazzolo R. Nuclear run-on assay using biotin labeling, magnetic bead capture and analysis by fluorescence-based RT-PCR. Biotechniques. 2000:1012–1017. doi: 10.2144/00295st02. [DOI] [PubMed] [Google Scholar]
- 15.Greenberg ME, Ziff EB. Stimulation of 3T3 cells induces transcription of the c-fos proto-oncogene. Nature. 1984:433–438. doi: 10.1038/311433a0. [DOI] [PubMed] [Google Scholar]
- 16.Ron D, Habener JF. CHOP, a novel developmentally regulated nuclear protein that dimerizes with transcription factors C/EBP and LAP and functions as a dominant-negative inhibitor of gene transcription. Genes Dev. 1992:439–453. doi: 10.1101/gad.6.3.439. [DOI] [PubMed] [Google Scholar]
- 17.Marciniak SJ, Ron D. Endoplasmic reticulum stress signaling in disease. Physiol Rev. 2006:1133–1149. doi: 10.1152/physrev.00015.2006. [DOI] [PubMed] [Google Scholar]
- 18.Ron D, Walter P. Signal integration in the endoplasmic reticulum unfolded protein response. Nat.Rev.Mol.Cell Biol. 2007:519–529. doi: 10.1038/nrm2199. [DOI] [PubMed] [Google Scholar]
- 19.Harding HP, Novoa I, Zhang Y, Zeng H, Wek R, Schapira M, Ron D. Regulated translation initiation controls stress-induced gene expression in mammalian cells. Mol.Cell. 2000:1099–1108. doi: 10.1016/s1097-2765(00)00108-8. [DOI] [PubMed] [Google Scholar]
- 20.Wang XZ, Lawson B, Brewer JW, Zinszner H, Sanjay A, Mi LJ, Boorstein R, Kreibich G, Hendershot LM, Ron D. Signals from the stressed endoplasmic reticulum induce C/EBP-homologous protein (CHOP/GADD153) Mol.Cell Biol. 1996:4273–4280. doi: 10.1128/mcb.16.8.4273. [DOI] [PMC free article] [PubMed] [Google Scholar]
- 21.Wang XZ, Harding HP, Zhang Y, Jolicoeur EM, Kuroda M, Ron D. Cloning of mammalian Ire1 reveals diversity in the ER stress responses. EMBO J. 1998:5708–5717. doi: 10.1093/emboj/17.19.5708. [DOI] [PMC free article] [PubMed] [Google Scholar]
- 22.Harding HP, Calfon M, Urano F, Novoa I, Ron D. Transcriptional and translational control in the Mammalian unfolded protein response. Annu.Rev.Cell Dev.Biol. 2002:575–599. doi: 10.1146/annurev.cellbio.18.011402.160624. [DOI] [PubMed] [Google Scholar]
- 23.Kharroubi I, Ladriere L, Cardozo AK, Dogusan Z, Cnop M, Eizirik DL. Free fatty acids and cytokines induce pancreatic beta-cell apoptosis by different mechanisms: role of nuclear factor-kappaB and endoplasmic reticulum stress. Endocrinology. 2004:5087–5096. doi: 10.1210/en.2004-0478. [DOI] [PubMed] [Google Scholar]
- 24.Oyadomari S, Takeda K, Takiguchi M, Gotoh T, Matsumoto M, Wada I, Akira S, Araki E, Mori M. Nitric oxide-induced apoptosis in pancreatic beta cells is mediated by the endoplasmic reticulum stress pathway. Proc.Natl.Acad.Sci.U.S.A. 2001:10845–10850. doi: 10.1073/pnas.191207498. [DOI] [PMC free article] [PubMed] [Google Scholar]
- 25.Ozcan U, Cao Q, Yilmaz E, Lee AH, Iwakoshi NN, Ozdelen E, Tuncman G, Gorgun C, Glimcher LH, Hotamisligil GS. Endoplasmic reticulum stress links obesity, insulin action, and type 2 diabetes. Science. 2004:457–461. doi: 10.1126/science.1103160. [DOI] [PubMed] [Google Scholar]
- 26.Nakatani Y, Kaneto H, Kawamori D, Yoshiuchi K, Hatazaki M, Matsuoka TA, Ozawa K, Ogawa S, Hori M, Yamasaki Y, Matsuhisa M. Involvement of endoplasmic reticulum stress in insulin resistance and diabetes. J.Biol.Chem. 2005:847–851. doi: 10.1074/jbc.M411860200. [DOI] [PubMed] [Google Scholar]
- 27.Ozcan U, Yilmaz E, Ozcan L, Furuhashi M, Vaillancourt E, Smith RO, Gorgun CZ, Hotamisligil GS. Chemical chaperones reduce ER stress and restore glucose homeostasis in a mouse model of type 2 diabetes. Science. 2006:1137–1140. doi: 10.1126/science.1128294. [DOI] [PMC free article] [PubMed] [Google Scholar]
- 28.Yang G, Yang W, Wu L, Wang R. H2S, endoplasmic reticulum stress, and apoptosis of insulin-secreting beta cells. J.Biol.Chem. 2007:16567–16576. doi: 10.1074/jbc.M700605200. [DOI] [PubMed] [Google Scholar]
Associated Data
This section collects any data citations, data availability statements, or supplementary materials included in this article.
Supplementary Materials
Regulation of transcription factor protein levels by proteasome inhibition in 3T3-L1 adipocytes. Nuclear proteins were extracted from 3T3-L1 adipocytes treated with 10 µM MG132 (MG) or vehicle (control, C) for 24 hours. Western immunoblot was performed using antibodies to MEF2D, LXR, PPARAγ, NF1-A, NF1-B, NF1-C, and NF1-X. Three or more independent experiments were performed; a representative result is shown.
Proteasome inhibition alters the expression of MEF2A isoforms in 3T3-L1 adipocytes. Nuclear proteins were extracted from 3T3-L1 adipocytes treated with 10 µM MG132 (MG) or vehicle (control, C) for 6 or 24 hours. Western immunoblot was performed using antibody to MEF2A. Size markers (kDa) are indicated. Three independent experiments were performed; a representative result is shown.