

Abstract
We report a frequency domain optical tomography system utilizing three RF modulation frequencies, which are optimized for probing breast lesions of different size located at different depths. A real-time co-registered ultrasound scanner is used to provide on-site estimation of lesion size and location. Based on the lesion information, an optimal light modulation frequency can be selected, which may yield more accurate estimates of lesion angiogenesis and hypoxia. Phantom experiments have demonstrated that a high modulation frequency, such as 350Mhz, is preferable for probing small lesions closer to the surface while a low modulation frequency, such as 50Mhz, is desirable for imaging deeper and larger lesions. A clinical example of a large invasive carcinoma is presented to demonstrate the application of this novel technique.
Introduction
Many research groups have developed multi-wavelength near infrared (NIR) systems using continuous wave (CW), modulated diffusive wave, and short light pulses for breast imaging (1–13). A real-time CW system using a spectrometer and a CCD camera has been developed recently, which represents a significant advance in the development of NIR systems (14). However, the CCD camera requires CW input and, therefore, provides only intensity (amplitude) information for imaging reconstruction. Time domain systems employing short light pulses of several hundred picoseconds are rather expensive. Frequency domain systems with sources modulated at high RF frequencies offer more information content than CW systems because both amplitude and phase measurements are readily available for tomography imaging. In general, a single modulation frequency is implemented in the frequency domain due to the complexity of the instrumentation and the limitation of the data acquisition time. Tromberg has developed frequency domain spectroscopic systems using multiple modulation frequencies for breast lesion characterization (2). The modulation frequencies were swept from 300kHz to 1 GHz to acquire data from one source and multiple detectors. For tomographic imaging where multiple sources and detectors are needed, this approach is limited by the total data acquisition time for its clinical implementation. Recently, Gulsen et al. has developed a frequency domain tomographic imager by incorporating four wavelengths and six modulation frequencies ranging from 110Mhz to 280Mhz (15). The authors reported a significant improvement in image quality when data of six modulation frequencies were used to reconstruct phantom targets. However, the system data acquisition time requires 2.5 minutes for a single modulation frequency at a single wavelength and a total of one hour is needed to acquire one complete data set.
In the past, we have constructed frequency domain NIR systems for breast lesion diagnosis. The systems were used with conventional real-time ultrasound to simultaneously acquire co-registered ultrasound images and NIR measurements in reflection geometry using a hybrid hand-held probe. Because ultrasound images are acquired in real-time, it is absolutely necessary to obtained co-registered NIR measurements in a short time frame to avoid patient motion and co-registration errors. Our first system consisted of 12 dual-wavelength light sources (780 nm and 830 nm) and eight parallel photo-multiplier tube (PMT) detectors (16), and the second system incorporated nine tri-wavelength light sources (660 nm, 780 nm, and 830 nm) and ten parallel avalanche photodiode detectors (APD) (17). The light modulation frequency of both systems was 140 MHz and sources were switched on one at a time. The data acquisition of 12 × 9 or 9 × 10 source-detector positions for both dual-wavelength and tri-wavelength systems required less than 10 seconds, fast enough to acquire patient data. With this data acquisition speed, 10 to 20 data sets at a lesion site, a symmetric normal region of the affected breast, and a normal region of contralateral breast in the same quadrant were acquired in about 5 to 8 minutes depending on the number of lesions. The normal sites are used to estimate background optical properties needed for imaging reconstruction. Initial clinical results with a group of 100 biopsied patients have shown that early stage invasive cancers present an average of two-fold greater total hemoglobin concentration than fibroadenomas and other benign lesions (18–19). Initial results of advanced cancers have shown that the angiogenesis distribution is highly distorted and heterogeneous (20).
By adopting the reflection geometry for NIR measurements in conjunction with conventional pulse-echo ultrasound, we have the advantage of probing reduced breast tissue thickness because patients are scanned in the supine position. Lesions closer to the chest wall can therefore be imaged. However, the detected light from lesions located at different depths and varied sizes spans a wide dynamic range. It has been demonstrated in Ref. (21) that the measured phase differences obtained at a subsurface malignant cancer site and a normal tissue site were much larger at higher modulation frequencies. However, low modulation frequencies are desirable for probing large tumors or deep lesions. Note that the modulation frequency must be greater than 50 MHz to obtain valid phase information (2). Ideally, all modulation frequencies should be used to probe lesions for improved reconstruction accuracy. For reference, the temporal point spread function for a time-domain system is equivalent to the measured information content with the full spectrum of frequencies from DC to 1 GHz. The data acquisition time for obtaining measurements from multiple sources and detectors needed for tomographic imaging with this approach would be too long however and patient motion could be a major problem.
In this paper, we report our new prototype NIR frequency domain system, which incorporates three modulation frequencies of 350Mhz, 140Mhz, and 50Mhz for optimally probing lesions of different sizes located at depths from less than 1 cm to 4 cm. Phantom experiments have demonstrated the useful range of probing depth for each modulation frequency for a given target size. In clinical studies, one or two modulation frequencies can be selected on-site based on the lesion location and size provided by real-time ultrasound. Total data acquisition time is therefore significantly reduced. As for the wavelength selection, more wavelengths are desirable for measuring wavelength-dependent tumor absorption changes. The use of additional wavelengths comes at the expense of increased data acquisition times. In this prototype system, we use three typical wavelengths (690nm, 780 nm, and 830nm) to obtain total hemoglobin concentration and blood oxygenation saturation. A clinical example is given to demonstrate the utility of this ultrasound-guided approach. A significant modulation-frequency-dependent and wavelength-dependent tissue penetration of diffusive waves has been observed.
Methods
NIR System of Three RF Modulation Frequencies
Figure 1 presents pictures and block diagrams of the handheld hybrid probe and NIR system. The probe consists of a commercial ultrasound transducer located in the middle, and near-infrared source fibers and detector light guides distributed at the periphery. The NIR imager consists of source and detection subsystems shown in Figures 1(b) and (c), respectively. The source subsystem has three pigtailed laser diodes of wavelength 690 nm, 780 nm, and 830 nm (OZ Optics Inc) and three RF oscillators of 350MHz, 140MHz, and 50MHz. For each modulation frequency, the outputs of the laser diodes were sequentially delivered to nine locations on the probe through 3 × 1 and 1 × 9 optical switches (PiezoJena Inc). The detection subsystem consists of 10 parallel channels. The light guides couple the diffusively detected light from tissue to photo-multiplier tubes (PMTs). The outputs of the PMTs were amplified by low-noise preamplifiers and mixed with the corresponding oscillator offset 20 kHz higher to produce both sum and difference signals. The 20 kHz difference signals were further amplified by 50 dB and band-pass filtered before sampled by A/D converters. Two National Instrument (NI) data acquisition cards (eight channels on each card) were synchronized to acquire data from ten parallel detection channels. The 20kHz reference signal was produced by directly mixing the outputs of the corresponding transmit and receive corresponding oscillators at each modulation frequency. The sampled reference signal was used to retrieve phase information. To speed up data acquisition, one or two modulation frequencies can be selected on site for each breast lesion based on the depth and target size measured by real-time ultrasound. The entire data acquisition of 9 × 10 source-detector positions for three wavelengths was less than 10 seconds, which was fast enough to acquire data from patients and avoid potential motion artifacts.
Figure 1.

(a) A hand-held probe and the reported NIR system. (b) A block diagram of the NIR source system. Note, one extra position of the first 4 × 1 optical switch was not used in the current system and is reserved for future expansion of one more wavelength. (c) A block diagram of the NIR detection system.
Computational Procedures
The details of our dual-mesh optical imaging reconstruction algorithm are described in Ref. (18). Briefly, the entire tissue volume is segmented based on co-registered ultrasound measurements into a lesion region, L (region of interest, ROI), and a background region, B. A modified Born approximation is used to relate the scattered field Usd(rsi,rdi,ω) measured at the source (s) and detector (d) pair i to absorption variations Δμa(r′) in each volume element of two regions within the sample. The matrix form of image reconstruction is given by
| [1] |
where WL and WB are weight matrices for lesion and background regions, respectively.
are the total absorption distributions of lesion and background regions, respectively. The weight matrices are calculated based on the background absorption coefficient and reduced scattering coefficient measurements obtained from the normal contralateral breast. No regularization parameters were used in the dual-mesh image reconstruction. For a large target that occupies more than two layers in depth, the performance of the dual-mesh based inversion is degraded because of the increased number of fine-mesh grids. We have improved the reconstruction of large lesions by implementing the dual-mesh one layer at a time, combining the target layers, and averaging the background layers to obtain the final image. In all experiments, a finer grid of 0.5 × 0.5 × 0.5 (cm3) was chosen for the lesion region and a coarse grid of 1.5 × 1.5 × 1.5 (cm3) was used for the background tissue. The total imaging volume was chosen to be 9 × 9 × 4 cm3.
By assuming that the major chromophores are deoxygenated (deoxyHb) and oxygenated (oxyHb) hemoglobin in the wavelength range studied, we can directly estimate the total hemoglobin concentration totalHb(r′) = deoxyHb(r′) + oxyHb(r′) and oxygenation saturation as:
| [3] |
and,
| [4] |
where μλ1a(r′) and μλ2a(r′) are optical absorption at volume element r′ and Δ = ελ1Hbελ2HbO2 − ελ1HbO2ελ2Hb.
In principle, any two wavelengths in the NIR window can be used to compute the total hemoglobin concentration from Equation [3]. However, positive weights of μλ1a(r′) and μλ2a(r′) in Equation [3] are critical to guarantee that the estimated total hemoglobin concentration at each voxel is positive. This is particularly important in the background region where the absorption coefficients are small and consequently the relative estimation errors of absorption coefficients are larger than those in the lesion region. We have found that the readily available wavelength pair of 780 nm and 830 nm [weight(λ1) = 0.20 and weight(λ2) = 0.27)] is robust for estimation of total hemoglobin concentration.
Similarly, any two wavelengths in the NIR window can be used to compute the oxygenation saturation from Equation [4]. However, the sensitivity of Y% to ratio is significantly different for different wavelength pairs. Figure 2 plots the Y% vs. the ratio for four wavelength pairs (660/830 nm, 690/830 nm, 730/830 nm, 780/830nm). For the wavelength pair 660/830 nm, the Y% lies in the physiological range for 0.3< <4.4. However, for the wavelength pair of (780 nm, 830 nm), the Y% is greater than 100% for <0.7 and reduces quickly to zero for ratio > 1.4. Any estimation error on μλ1a(r′) and μλ2a(r′) can cause the estimated Y% to fall outside the expected physiological range, particularly when the μλ1a(r′) and μλ2a(r′) are small in the background tissue regions. For example, the estimated absorption coefficients from normal breasts are within 0.01 to 0.06 cm−1 at 780 nm and 0.02 to 0.07 cm−1 at 830 nm. The computed blood oxygen saturation values using these background absorption coefficients may exceed 100%. Considering both factors, robust estimation of total hemoglobin concentration favors the wavelength pair of 780 nm and 830 nm whereas blood oxygenation saturation estimation is best for the wavelength pair of (660 nm, 830 nm).
Figure 2.

Plots of blood oxygen saturation Y% vs. ratio of μλ1a(r′)/μλ2a(r′) at four different wavelength pairs (660/830 nm, 690/830 nm, 730/830 nm, 780/830 nm).
However, data from many clinical cases have shown that NIR measurements at 660 nm are subject to higher background light scattering because the reduced scattering coefficient μ′s= aλ−b increases with the decreased wavelength. In this prototype system, we have chosen the wavelength pair of (690 nm, 830 nm) for blood oxygen estimation. 690 nm is the longest wavelength in the visible range and laser diodes at this wavelength are available. As a result, three typical wavelengths of 690 nm, 780 nm, and 830 nm are implemented in our system for estimation of total hemoglobin concentration and blood oxygen saturation.
Phantom Experiments
Absorbers (see Fig. 3) of 1 cm and 3 cm diameter of low contrast (calibrated value at 780 nm μa = 0.07 cm−1, μ′s = 5.50 cm−1) and high contrast (calibrated value at 780 nm μa = 0.23 cm−1, μ′s = 5.45 cm−1) were imbedded in Intralipid™ solution of 0.07% concentration. The fitted background and were in the range of 0.02 to 0.031 cm−1 and 4.9 to 6.1 cm−1 in different sets of experiments. In each set of 1 cm absorber experiments, the absorber was centered at depths of 0.5, 1.0, 1.5, 2.0, 2.5, 3, and 3.5 cm. In each set of 3 cm absorber experiments, the absorber was centered at depths of 2, 2.5, 3, and 3.5 cm. For each target location, three sets of measurements obtained from three modulation frequencies were used to reconstruct target absorption maps. The average μa value measured within full width and half maximum (FWHM) of each x-y target layer was used to quantitatively compare the reconstruction results.
Figure 3.
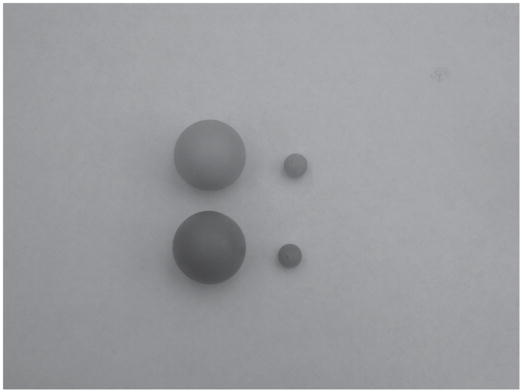
Photograph of 1 cm and 3 cm diameter high-contrast absorbers of μa = 0.23 cm−1 (darker ones in front) and 1 cm and 3 cm low-contrast absorbers of μa = 0.07 cm−1 (at back).
To evaluate the possible effect of ROI or fine-mesh zone selection on accuracy of the reconstructed absorption coefficients, we reconstructed the target using ROIs twice the size of the real target in x-y dimensions (2×) and three times (3×) the size of the target in x-y dimensions. Results obtained from these two ROIs were compared. Because the target depth is critical for accurate reconstruction of the absorption coefficient (22) and it can be estimated well from co-registered ultrasound images, we have kept very tight constraints on target depth in imaging reconstruction.
Clinical Experiments
Clinical studies were performed at the Radiology Department of the University of Connecticut Health Center. The Health Center IRB committee approved the human subject protocol. A state-of-the art US machine, ATL Sono CT, was used for the study. Ultrasound images and optical measurements were acquired simultaneously at multiple locations including the lesion region, a normal region of the same breast, and a symmetric normal region of the contralateral breast. The optical data acquired at normal regions were used as reference to calculate the scattered field caused by lesions.
Results
Phantom Experiments of 3 cm High and Low Contrast Absorbers
Figure 4 shows the co-registered ultrasound images (first column) and reconstructed optical absorption maps of the 3-cmdiameter high-contrast absorber obtained at 50Mhz (second column), 140Mhz (third column), and 350Mhz (fourth column) modulation frequencies. The reconstructed absorption maps shown in Figure 4 were obtained at 780 nm with the ROI in x-y dimensions equal to twice the size of the real target. The same target was translated in 0.5 cm depth steps to target centers at 2, 2.5, 3, and 3.5cm. In each image, there are 9 x-y images of 9 cm by 9 cm obtained from 0.5 cm (slice #1) to 4.5 cm (slice #9) in depth with 0.5 cm step. The slices are numbered from left to right and top to bottom. Ideally, the target should uniformly occupy six layers in z direction. However, the last two target layers close to the bottom were visible only in images obtained at 50Mhz when the target center was located at 2.0, 2.5, and 3.0 cm, respectively. In images obtained at 140Mhz, the top four target layers were seen whereas in images obtained at 350Mhz only the top three target layers were seen. This is due to the significant light absorption of the top target layers that limits the number of photons penetrating into the deep layers and ultimately detected at the surface. This light shadowing phenomenon is very similar to the well-known ultrasound shadow effect of a large lesion, where bottom layers of the lesion or normal tissues underneath the lesion appear black in the image (little sound reflection) due to significant sound absorption of top layers. The shadowing effect is more pronounced at high RF light modulation frequencies.
Figure 4.

First column: Ultrasound images of the 3 cm diameter highcontrast absorber located at depth of 2, 2.5, 3, and 3.5 cm (center location) inside Intralipid™, respectively. Second column: Reconstructed optical absorption maps at the corresponding target location. The light modulation frequency is 50Mhz. Third column: Reconstructed absorption maps at light modulation frequency 140MHz. Fourth column: Reconstructed absorption maps at light modulation frequency 350Mhz.
Table I provides the reconstructed average target μa measured within FWHM of each target layer and obtained at three modulation frequencies. The first column lists the target center depth and the second through fourth columns present the reconstructed average μa obtained at the corresponding layer for 50, 140, and 350 MHz, respectively. Results are listed for ROIs of two (2×) and three (3×) the real target size in x-y dimensions. The percentage ratio of the calculated to the calibrated value of μa = 0.23cm−1 is given in parenthesis. The average μa calculated from the first five target layers is also given at the bottom of each row. The highest reconstructed values, (68%, 50Mhz) and (63%, 140Mhz), are obtained at the third target layer when the target center is located at 2 cm depth. The average values over the first five target layers are 59% (50Mhz) and 47% (140Mhz), respectively. If the data are averaged over the first four layers, the reconstruction accuracy at 140Mhz improves to 53%. For 350Mhz, the highest value, 83%, is obtained at the second target layer and the average value is 48%. If the data are averaged over the first three layers, the reconstruction accuracy improves to 67%. The reconstructed average values drop quickly when the target center is translated deeper. In our clinical study, the breast is scanned with the combined probe compressed against the chest wall. The lesions are often located within a 3 to 4 cm depth. Clinical imaging conditions, therefore, most closely resemble targets at the 2 cm or 2.5 cm depths.
Table I.
Reconstructed average target μa obtained at 50, 140, and 350 MHz for the 3 cm high-contrast absorber. The first column lists the target center depth. For each frequency, the reconstructed average μa obtained at each layer is presented for ROI two (2×) and three (3×) times larger than the real target size in x-y. The percentage ratio of the calculated to the calibrated value μa = 0.23cm−1 is given in parenthesis.
| 50Mhz | 140Mhz | 350Mhz | |||||||
|---|---|---|---|---|---|---|---|---|---|
| Center Depth | ROI Layers | 2× | 3× | ROI Layers | 2× | 3× | ROI Layers | 2× | 3× |
| High Contrast 3 cm absorber | #1: | 0.123(54) | 0.118(51) | #1: | 0.110 (48) | 0.107(47) | #1: | 0.140(61) | 0.139(60) |
| #2: | 0.135(59) | 0.132(57) | #2: | 0.123 (54) | 0.121(53) | #2: | 0.192(83) | 0.190(83) | |
| #3: | 0.156(68) | 0.153(67) | #3: | 0.144 (63) | 0.143(62) | #3: | 0.149(65) | 0.148(64) | |
| #4: | 0.152(66) | 0.150(65) | #4: | 0.111(48) | 0.111(48) | #4: | 0.040(18) | 0.036(16) | |
| #5: | 0.110(48) | 0.108(47) | #5: | 0.055(24) | 0.055(24) | #5: | 0.029(13) | 0.029(13) | |
| 2.0 cm | #6: | 0.073(31) | 0.071(31) | #6: | 0.024(11) | 0.023(10) | #6: | 0.027(12) | 0.027 (12) |
| Ave: | 0.135(59) | 0.132(57) | Ave: | 0.109(47) | 0.107(47) | Ave: | 0.110(48) | 0.108(47) | |
| #1: | 0.123(53) | 0.120(52) | #1: | 0.109(47) | 0.107(47) | #1: | 0.159(69) | 0.159(69) | |
| #2: | 0.143(62) | 0.140(61) | #2: | 0.132(57) | 0.130(57) | #2: | 0.178(77) | 0.177(77) | |
| #3: | 0.143(62) | 0.139(60) | #3: | 0.112(48) | 0.110(48) | #3: | 0.123(53) | 0.122(53) | |
| #4: | 0.110(48) | 0.109(47) | #4: | 0.067(29) | 0.066(29) | #4: | 0.043(19) | 0.038(17) | |
| 2.5 cm | #5: | 0.074(32) | 0.072(31) | #5: | 0.038(17) | 0.038(17) | #5: | 0.029(13) | 0.028(12) |
| #6: | 0.048(21) | 0.044(19) | #6: | 0.023(10) | 0.023(10) | #6: | 0.026(11) | 0.026(11) | |
| Ave: | 0.119(52) | 0.116(50) | Ave: | 0.092(40) | 0.090(39) | Ave: | 0.106(46) | 0.105(46) | |
| #1: | 0.119(52) | 0.117(51) | #1: | 0.107(47) | 0.106(46) | #1: | 0.165(72) | 0.163(71) | |
| #2: | 0.126(55) | 0.123(53) | #2: | 0.109(47) | 0.107(47) | #2: | 0.167(73) | 0.167(73) | |
| #3: | 0.103(45) | 0.102(44) | #3: | 0.083(36) | 0.081(35) | #3: | 0.088(38) | 0.088(38) | |
| #4: | 0.075(33) | 0.073(32) | #4: | 0.057(25) | 0.057(25) | #4: | 0.034(15) | 0.030(13) | |
| 3.0 cm | #5: | 0.050(22) | 0.047(20) | #5: | 0.032(14) | 0.028(12) | #5: | 0.026(11) | 0.026(11) |
| #6: | 0.040(18) | 0.036(16) | #6: | 0.024(11) | 0.023(10) | #6: | 0.025(11) | 0.025(11) | |
| Ave: | 0.095(41) | 0.092(40) | Ave: | 0.078(34) | 0.076(33) | Ave: | 0.096(42) | 0.095(41) | |
| #1: | 0.095(41) | 0.092(40) | #1: | 0.090(39) | 0.087(38) | #1: | 0.141(61) | 0.140(61) | |
| #2: | 0.086(37) | 0.083(36) | #2: | 0.091(39) | 0.088(38) | #2: | 0.110(48) | 0.110(48) | |
| #3: | 0.066(29) | 0.064(28) | #3: | 0.076(33) | 0.075(33) | #3: | 0.042(18) | 0.042(18) | |
| 3.5 cm | #4: | 0.049(21) | 0.043(19) | #4: | 0.048(21) | 0.048(21) | #4: | 0.026(11) | 0.026(11) |
| #5: | 0.040(17) | 0.037(16) | #5: | 0.030(13) | 0.027(12) | #5: | 0.025(11) | 0.025(11) | |
| Ave: | 0.067(29) | 0.064(28) | Ave: | 0.067(29) | 0.065(28) | Ave: | 0.069(30) | 0.069(30) | |
This controlled study clearly shows that large absorbing tumors are under-reconstructed and advanced system and non-linear algorithmic developments are needed to improve the reconstruction accuracy of target optical properties. CW systems offer the best penetration but will not provide phase information that enhances sensitivity for imaging smaller lesions.
One important issue is the selection of ROI or fine-mesh zone used in image reconstruction. As we can see from Table I, the ROI has negligible effect as the maximum change observed from two different ROIs (2× and 3×) is only 3% for targets located at different depths and probed with different modulation frequencies.
Figure 5 shows the reconstructed optical absorption maps of the 3-cm-diameter low-contrast absorber obtained at 50Mhz (first column), 140Mhz (second column), and 350Mhz (third column) modulation frequencies, respectively. Since co-registered ultrasound images of the low-contrast absorber are essentially the same as the images of high-contrast absorber shown in Figure 4, these images are not shown in Figure 5. Table II provides the reconstructed average target μa obtained at three modulation frequencies. The percentage ratio of the calculated value to the calibrated value of μa = 0.07 cm−1 is given in parenthesis. It is clear that the accuracy of reconstructed target absorption maps has been improved in all modulation frequencies. At 50Mhz, the average reconstructed value over the first five-layers is 136%, 124%, 105%, and 87% for targets located at 2 cm, 2.5 cm, 3 cm, and 3.5 cm, respectively. At 140Mhz, the average reconstructed value over the first five-layers is 101%, 90%, 81%, and 69%, for the corresponding target locations. If the data are averaged over the first four layers, the reconstruction accuracy improves to 113%, 102%, 90%, and 76%, respectively. At 350Mhz, the target mass only appears at top two to three layers. The average reconstructed value over the first five-layers is 86%, 64%, 60%, and 29%, at the corresponding target locations. The average reconstructed value considering the first three-layers is 104%, 86%, 90%, and 41% for the respective depths.
Figure 5.

First column: Reconstructed optical absorption maps of the 3 cm diameter low-contrast absorber located at depth of 2, 2.5, 3, and 3.5 cm (center location) inside Intralipid ™, respectively. The light modulation frequency is 50Mhz. Second column: Reconstructed optical absorption maps at the corresponding target location obtained at 140Mhz modulation frequency. Third column: reconstructed absorption maps obtained at 350Mhz.
Table II.
Reconstructed average target μa obtained at 50, 140, and 350 MHz for the 3 cm low-contrast absorber. The first column lists the target center. The first column lists the target center depth. For each frequency, the reconstructed average μa obtained at each layer is presented for ROI two (2×) and three (3×) times larger than the real target size in x-y. The percentage ratio of the calculated to the calibrated value μa = 0.07cm−1 is given in parenthesis.
| 50Mhz | 140Mhz | 350Mhz | |||||||
|---|---|---|---|---|---|---|---|---|---|
| Center-Depth | ROI: | 2× | 3× | ROI: | 2× | 3× | ROI: | 2× | 3× |
| Low-Contrast | #1: | 0.090(129) | #1: | 0.074(106) | #1: | 0.073(104) | |||
| 3-cm absorber | #2: | 0.097(139) | #2: | 0.082(117) | #2: | 0.103(146) | |||
| #3: | 0.106(151) | #3: | 0.093(133) | #3: | 0.044(63) | ||||
| #4: | 0.103(146) | #4: | 0.067(96) | #4: | 0.049(69) | ||||
| #5: | 0.080(114) | #5: | 0.039(55) | #5: | 0.033(48) | ||||
| 2 cm | #6: | 0.057(81) | #6: | 0.025(36) | #6: | 0.017(25) | |||
| Ave: | 0.095(136) | 0.089(127) | Ave: | 0.071(101) | 0.071(101) | Ave: | 0.06(86) | 0.059(85) | |
| #1: | 0.090(129) | #1: | 0.077(110) | #1: | 0.076(108) | ||||
| #2: | 0.100(143) | #2: | 0.089(127) | #2: | 0.049(70) | ||||
| #3: | 0.099(142) | #3: | 0.072(103) | #3: | 0.056(80) | ||||
| #4: | 0.083(118) | #4: | 0.046(66) | #4: | 0.030(43) | ||||
| 2.5 cm | #5: | 0.061(87) | #5: | 0.032(45) | #5: | 0.013(18) | |||
| #6: | 0.046(66) | #6: | 0.025(36) | #6: | 0.007(10) | ||||
| Ave: | 0.087(124) | 0.083(119) | Ave: | 0.063(90) | 0.060(86) | Ave: | 0.045(64) | 0.044(63) | |
| #1: | 0.087(125) | #1: | 0.074(106) | #1: | 0.095(136) | ||||
| #2: | 0.091(130) | #2: | 0.073(104) | #2: | 0.066(94) | ||||
| #3: | 0.080(114) | #3: | 0.060(86) | #3: | 0.027(39) | ||||
| #4: | 0.062(89) | #4: | 0.044(63) | #4: | 0.015(21) | ||||
| 3.0 cm | #5: | 0.048(69) | #5: | 0.031(44) | #5: | 0.007(10) | |||
| #6: | 0.040(57) | #6: | 0.025(36) | #6: | 0.007(10) | ||||
| Ave: | 0.074(105) | 0.070(100) | Ave: | 0.056(81) | 0.054(77) | Ave: | 0.042(60) | 0.041(59) | |
| #1: | 0.080(114) | #1: | 0.061(87) | #1: | 0.047(67) | ||||
| #2: | 0.074(106) | #2 | 0.060(86) | #2: | 0.030(43) | ||||
| #3: | 0.061(87) | #3: | 0.052(74) | #3: | 0.009(13) | ||||
| 3.5 cm: | #4: | 0.049(70) | #4: | 0.039(56) | #4: | 0.007(10) | |||
| #5: | 0.041(59) | #5: | 0.029(41) | #5: | 0.007(10) | ||||
| Ave | 0.061(87) | 0.056(80) | Ave: | 0.048(69) | 0.046(66) | Ave: | 0.02(29) | 0.019(27) | |
As mentioned before, we have used the hybrid probe compressed against the chest wall in our clinical studies and the lesions are often located in less than 3 to 4 cm depth. The accuracy of reconstructed absorption maps of the low-contrast absorber is quite high at these depths, especially at 140Mhz. This suggests that our system has the capability to characterize benign lesions accurately. At a higher modulation frequency (e.g., 350Mhz), our system detection sensitivity is reduced and the penetration of diffusive waves is also reduced. These combined effects limit the usefulness of high modulation frequencies for probing large lesions (see Discussion and Summary).
As for the selection of the ROI or fine-mesh zone, the maximum change of μa is 0.011 cm−1, which is obtained when the target is located at 2 cm and probed with 50Mhz modulation frequency (target layer #1, data not shown). This maximum change in μa will not cause any benign lesions (typical μa < 0.15 cm−1) to be misdiagnosed as malignant lesions (typical μa > 0.15 cm−1). Therefore, the ROI selection is not critical for reconstruction of large absorbers.
Phantom Experiments of 1 cm High and Low Contrast Absorbers
Figure 6 shows the co-registered ultrasound images (first column) and reconstructed optical absorption maps of the 1 cm high-contrast absorber obtained at 50Mhz (second column), 140Mhz (third column), and 350Mhz (fourth column) modulation frequencies, respectively. The target was translated in depth in 0.5 cm steps to centers at 1, 1.5, 2, 2.5, 3, and 3.5 cm, respectively. Table III provides the reconstructed average absorption coefficients obtained at each layer with the percentage ratio of the calculated to the calibrated μa = 0.23 cm−1 given in parenthesis. The ROI used were twice the target size (2×) and three times the target size (3×). The reconstructed μa has been significantly improved across all target depth and modulation frequencies compared to the corresponding results for the corresponding 3 cm absorber. For 50Mhz probing frequency, the average reconstructed values are 60%, 67%, 72%, 64%, 70%, and 53% for 1 cm to 3.5 cm depths, respectively, when the ROI is twice the target size. For 140Mhz, the target is reconstructed as 61%, 71%, 75%, 76%, 77%, and 30% for 1 cm to 3.5 cm depths, respectively, with the same ROI. The highest reconstruction accuracy is achieved at 350Mhz and the reconstructed values are 74%, 79%, 81% and 54%, for 1 cm to 2.5 cm target depths. No solid target mass was observed in images beyond 2.5 cm depth. The better reconstruction accuracy for 350 MHz for shallow targets suggests that a higher RF modulation frequency could be useful to probe breast lesions near the surface of the skin.
Figure 6.

First column: Ultrasound images of the 1 cm diameter high-contrast absorber located at depth of 1, 1.5, 2, 2.5, 3, and 3.5 cm (center location) inside Intralipid ™, respectively. Second column: Reconstructed optical absorption maps at the corresponding target location. The light modulation frequency is 50Mhz. Third column: Reconstructed absorption maps obtained at 140MHz. Fourth column: Reconstructed absorption maps obtained at 350Mhz.
Table III.
Reconstructed average target μa of the 1 cm high-contrast absorber obtained at 50, 140, and 350 MHz. The first column lists the target center depth. For each frequency, the reconstructed average μa obtained at each layer is presented for ROI two (2×) and three (3×) times larger than the real target size in x-y. The percentage ratio of the calculated to the calibrated value μa = 0.23cm−1 is given in parenthesis.
| 50Mhz | 140Mhz | 350Mhz | ||||
|---|---|---|---|---|---|---|
| High-Contrast | ROI: 2× | 3× | ROI: 2× | 3× | ROI: 2× | 3× |
| 1 cm absorber | ||||||
| 1.0 cm | 0.138(60) | 0.134(58) | 0.141(61) | 0.086(37) | 0.171(74) | 0.099(43) |
| 1.5 cm | 0.153(67) | 0.098(43) | 0.163(71) | 0.129(56) | 0.182(79) | 0.129(56) |
| 2.0 cm | 0.166(72) | 0.103(45) | 0.173(75) | 0.111(48) | 0.187(81) | 0.131(57) |
| 2.5 cm | 0.147(64) | 0.096(42) | 0.175(76) | 0.111(48) | 0.124(54) | 0.083(36) |
| 3.0 cm | 0.160(70) | 0.110(48) | 0.177(77) | 0.112(49) | No target | |
| 3.5 cm | 0.123(53) | 0.098(43) | 0.068(30) | 0.062(27) | No target | |
The selection of the ROI for imaging small absorbers has a significant effect on accuracy of reconstructed target absorption coefficients. Table III indicates that the average reconstructed value for a 3× ROI was approximately 21% lower than if an ROI of twice the target size was used. Fortunately, with the ultrasound guidance, we have the knowledge about the approximate target size and can select appropriate ROI for dual-mesh based optical imaging reconstruction.
Figure 7 shows the reconstructed optical absorption maps of the 1 cm low-contrast absorber obtained at 50Mhz (first column), 140Mhz (second column), and 350Mhz (third column) modulation frequencies. The target was translated in depth in 0.5 cm steps and the target center was located at 1, 1.5, 2, 2.5, 3, and 3.5 cm, respectively. Because co-registered ultrasound images of the low-contrast absorber are essentially the same as the images of high-contrast absorber shown in column one of Figure 6, these images are not shown in Figure 7. Table IV provides the reconstructed average absorption coefficients obtained at the target layer with the percentage ratio of the calculated to the calibrated μa =0.07 cm−1 given in parenthesis. The low contrast small absorber was over-reconstructed by 0.019 cm−1 on average (27%) across the depth at 50Mhz, and by 0.021 cm−1 on average (30%) at 140Mhz. As discussed previously, these small changes will not cause errors in classification of benign and malignant tumors. At 350Mhz, the over-reconstruction is 0.059 cm−1 P(84%) on average. The main reason is the higher noise level of our system at 350Mhz modulation frequency, which is more pronounced when the perturbation is smaller (see Discussion and Summary).
Figure 7.

First column: Reconstructed optical absorption maps of the 1 cm diameter low-contrast absorber located at depth of 1, 1.5, 2, 2.5, 3, and 3.5 cm (center location) inside Intralipid ™, respectively. The light modulation frequency is 50Mhz. Second column: Reconstructed optical absorption maps obtained at 140MHz. Third column: Reconstructed absorption maps obtained at 350Mhz.
Table IV.
Reconstructed average target μa of the 1 cm low-contrast absorber obtained at 50, 140, and 350 MHz. The first column lists the target center depth. For each frequency, the reconstructed average μa obtained at each layer is presented for ROI two (2×) and three (3×) times larger than the real target size in x-y. The percentage ratio of the calculated to the calibrated value μa = 0.07cm−1 is given in parenthesis.
| 50Mhz | 140Mhz | 350Mhz | ||||
|---|---|---|---|---|---|---|
| Low-Contrast | ROI: 2× | 3× | ROI: 2× | 3× | ROI: 2× | 3× |
| 1 cm absorber | ||||||
| 1.0cm | 0.089(127) | 0.059(84) | 0.086(123) | 0.055(79) | 0.114(163) | 0.066(94) |
| 1.5 cm | 0.094(134) | 0.063(90) | 0.099(141) | 0.063(90) | 0.139(199) | 0.081(116) |
| 2.0 cm | 0.092(131) | 0.063(90) | 0.093(133) | 0.061(87) | 0.134(191) | 0.085(120) |
| 2.5 cm | 0.087(124) | 0.065(93) | 0.107(153) | 0.079(113) | No target | |
| 3.0 cm | 0.083(119) | 0.032(46) | 0.069(99) | 0.066(94) | No target | |
| 3.5 cm | No target | No target | No target | |||
A Clinical Example
An example was obtained from a 53-year-old woman who had a 3 cm × 3 cm × 3 cm invasive ductal carcinoma of high grade (III) located at the 6 o’clock position in her right breast. The patient was scheduled for chemotherapy treatment and we scanned her before the treatment. Two light modulation frequencies of 50Mhz and 140Mhz were used in the scan. Figure 8(a) shows the ultrasound image of the cancer, which is located between 0.5 cm and 3.5 cm in depth direction. Because the cancer has irregular margins in x-y dimensions, the ROI is chosen as the size of the hand-held probe (9 cm × 9 cm). Figure 8(b1, b2), (c1, c2), and (d1, d2) are corresponding reconstructed absorption maps obtained from 50Mhz and 140Mhz at 690 nm, 780 nm, and 830 nm, respectively. Similar to the 3 cm high-contrast absorber experiment, the absorption is high at the first three target layers in the 140Mhz images. At the fourth target layer, the absorption mass is barely visible in 690 nm and 830 nm images at 140Mhz. When the 50Mhz was used to probe the lesion, the absorption mass in the fourth target layer is readily seen. Also the light penetration at 830 nm is significantly improved at the 50Mhz frequency. The total hemoglobin maps and the blood oxygen saturation maps at 50Mhz and 140Mhz are computed and the images are shown in Figure 8(e1, e2) and (f1, f2), respectively. Table V lists the average absorption coefficients measured within FWHM of each target layer at three wavelengths and two modulation frequencies, as well as computed total hemoglobin concentrations of both maximum and average values. The significant improvement in computed hemoglobin concentration occurs in the fourth layer and about 20 (μ/liter) difference is observed. Furthermore, the estimated oxygen saturation distribution has dramatically improved because of the increased light penetration at 830 nm. As one can see, the oxygen saturation patterns are similar at both modulation frequencies in slice #4 and #5, and the improvements occur at slice #6 and #7.
Figure 8.


(a) Shows the ultrasound image of the cancer, which is located between 0.5 cm and 3.5 cm in depth direction. (b1, b2), (c1, c2), and (d1, d2) are corresponding reconstructed absorption maps obtained from 50Mhz and 140Mhz at 690 nm,780 nm, and 830 nm, respectively. The total hemoglobin maps and the blood oxygen saturation maps at 50Mhz and 140Mhz are shown in (e1, e2) and (f1, f2), respectively.
Table V.
Reconstructed average μa of the corresponding lesion layers obtained at 690, 780, and 830nm and modulation frequencies of 50 and 140 MHz (Columns two to four). Ave4 and Ave5 are average values calculated from first four and first five layers, respectively. The fifth column is the calculated corresponding total hemoglobin concentration of both maximum value and average value within the FWHM.
| 50Mhz | 140Mhz | 50Mhz | 140Mhz | 50Mhz | 140Mhz | 50Mhz | 140Mhz | |
|---|---|---|---|---|---|---|---|---|
| Lesion-Depth | 690nm | 780nm | 830nm | Hemoglobin Con. (μmol/liter) Maximum/Ave. | ||||
| #1: 0.152 | 0.156 | #1: 0.183 | 0.209 | #1: 0.185 | 0.141 | 125.2/86.9 | 115.1/80.0 | |
| #2: 0.159 | 0.166 | #2: 0.190 | 0.211 | #2: 0.193 | 0.143 | 125.9/91.0 | 112.6/81.3 | |
| #3: 0.187 | 0.136 | #3: 0.197 | 0.239 | #3: 0.203 | 0.170 | 130.3/94.0 | 129.2/92.1 | |
| #4: 0.106 | 0.026 | #4: 0.162 | 0.174 | #4: 0.173 | 0.094 | 108.7/79.9 | 82.1/60.7 | |
| 0.5 to 3.5 cm | #5: 0.043 | 0.026 | #5: 0.085 | 0.064 | #5: 0.106 | 0.014 | 65.2/46.1 | 49.3/15.3 |
| #6: 0.027 | 0.026 | #6: 0.044 | 0.019 | #6: 0.073 | 0.014 | 59.6/28.2 | 47.7/7.7 | |
| Ave4: 0.122 | 0.121 | Ave4: 0.183 | 0.208 | Ave4: 0.188 | 0.137 | Ave4: 122.6/87.9 | 109.8/78.5 | |
| Ave5: 0.102 | 0.102 | Ave5: 0.163 | 0.179 | Ave5: 0.172 | 0.111 | Ave5: 111.1/79.6 | 97.6/65.9 | |
It is interesting to note that the absorption maps as well as the total hemoglobin concentration map reveal heterogeneous tumor vasculature patterns with more microvessels distributed at the tumor periphery. We have seen this type of angiogenesis distributions in many larger carcinomas (20). In the literature, the periphery enhancement or rim enhancement of breast lesions in contrast enhanced MR images has been reported (26). Authors have concluded that the rim enhancement is due to a combination of angiogenesis, distribution and degree of fibrosis, expression pattern of growth factors, and various histologic features.
Discussion and Summary
A few studies in the literature have reported the use of multiple modulation frequencies. In an earlier study, Jiang et al. reported simulation and experimental results using three modulations frequencies of 50 MHz, 200Mhz, and 300 MHz and found no observable changes on image quality of reconstructed phantom targets (23). In another study, O’Leary et al. simulated images from 50Mhz to 1Ghz and observed modulation-frequency-dependent improvement in image quality with low background absorption (i.e., 0.01 cm−1 < μa <0.1 cm−1) (24). Recently, Milstein et al. has reported simulation and experimental results of fluorescence tomography using multi-frequency data of 78.4Mhz, 314Mhz, and 628Mhz (25). The authors observed improvement when multiple frequency data were used to reconstruct two small objects in a simulation study. However, no improvement was noted in the experimental studies. In the recent experimental study reported by Gulsen et al., the authors reported superior imaging quality when data of six modulation frequencies were used to reconstruct phantom targets (15).
Our objective is to select one or two modulation frequencies for optimal probing of breast lesions of various sizes located at different depths, not to combine multiple frequency data to improve imaging. Our limited clinical cases studied so far suggest that measurements obtained from the same tissue volume may be significantly different for different modulation frequencies, especially phase profiles. We may acquire data using one or two modulation frequencies based on lesion size and depth provided by real-time ultrasound. However, we choose one modulation frequency that yields more homogeneous measurements at the normal contralateral breast for accurate estimation of bulk tissue optical properties and for accurate measurement of lesion perturbation.
Although the higher modulation frequencies can provide improved reconstruction accuracy, their range is limited by the reduced signals detected at greater penetration depths. Many components affect the system performance at higher RF frequencies. In our system, the minimal bandwidth of preamplifiers, mixers, and RF switches is 500Mhz. The component that limits the frequency response is the PMT (R928) that has 3dB bandwidth of 160Mhz. As a result, the average signal decreases by approximately 60-70% from 140Mhz to 350Mhz in 0.6%-0.7% Intralipid solution at a fixed PMT high voltage gain. In addition, diffusive waves modulated at higher RF frequencies penetrate less deep due to the exponential damping. Simulations have shown that 350Mhz is a good compromise between deep-tissue penetration and higher sensitivity in the shallower regions. In experimental studies, both factors affect the sensitivity of the system at the higher end of the RF modulation (e.g., 350Mhz). In our system, higher coherent interference noise at 350MHz further limited the sensitivity and contrast relative to the lower frequencies. During the review of this manuscript, we have reduced the maximum modulation frequency to 250MHz and achieved comparable noise performance across all frequencies.
In our phantom studies, the absorbers were immersed in Intralipid ™ solution of 0.07% concentration. The fitted background absorption and reduced scattering coefficients were in the range of 0.02 to 0.031 cm−1 and 4.9 to 6.1 cm−1 in different sets of experiments. The fitted bulk absorption and reduced scattering coefficients from normal breasts are within the range of 0.01 to 0.07 cm−1 and 2 to 13 cm−1 (unpublished data). With higher background tissue absorption and scattering, the penetration depth of diffusive waves will be further reduced. The system performance under a range of background absorption and scattering coefficients is currently under evaluation.
In summary, we have constructed a new frequency domain optical tomography system utilizing three RF modulation frequencies, which are optimized for probing breast lesions of different size located at different depths. With the real-time co-registered ultrasound guidance on lesion size and location, an optimal light modulation frequency can be selected which may yield more accurate estimates of lesion angiogenesis and hypoxia. Phantom experiments of large and small absorbers of both high and low optical contrasts have demonstrated that a high modulation frequency, such as 350Mhz, is preferable for probing small lesions closer to the surface while a low modulation frequency, such as 50Mhz, is desirable for imaging deeper and larger lesions. A clinical example of a large invasive carcinoma is presented and significant modulation-frequency-dependent and wavelength-dependent tissue penetration of diffusive-waves has been observed. To evaluate the possible effect of ROI or fine-mesh zone selection on accuracy of the reconstructed absorption coefficients, we reconstructed the target using ROIs twice the size of the real target in x-y dimensions and three times the size of the target in x-y dimensions. The results have shown that the ROI has negligible effect on reconstructed optical properties of larger 3 cm absorbers. For smaller 1 cm absorbers, the ROI has to be twice the size of the absorber to ensure accurate reconstruction of target optical properties.
Acknowledgments
This work is supported by National Institute of Health (R01EB002136).
References
- 1.Chance B. Near-infrared Images Using Continuous, Phase-modulated, and Pulsed Light with Quantitation of Blood and Blood Oxygenation. Ann NY Acad Sci. 1998;838:29–45. doi: 10.1111/j.1749-6632.1998.tb08185.x. [DOI] [PubMed] [Google Scholar]
- 2.Tromberg B, Shah N, Lanning R, Cerussi A, Espinoza J, Pham T, Svaasand L, Butler J. Non-Invasive In Vivo Characterization of Breast Tumors Using Photon Migration Spectroscopy. Neoplasia. 2000;2:26–40. doi: 10.1038/sj.neo.7900082. [DOI] [PMC free article] [PubMed] [Google Scholar]
- 3.Ntziachristos V, Yodh A, Schnall M, Chance B. Concurrent MRI and Diffuse Optical Tomography of Breast After Indocyanine Green Enhancement. PNAS. 2000;97:2767–2772. doi: 10.1073/pnas.040570597. [DOI] [PMC free article] [PubMed] [Google Scholar]
- 4.Pogue B, Poplack SP, McBride TO, Wells WA, Osterman K, Osterberg U, Paulsen KD. Quantitative Hemoglobin Tomography with Diffuse Near-infrared Spectroscopy: Pilot Results in the Breast. Radiology. 2001;218:261–266. doi: 10.1148/radiology.218.1.r01ja51261. [DOI] [PubMed] [Google Scholar]
- 5.Culver JP, Choe R, Holboke MJ, Zubkov L, Durduran T, Slemp A, Ntziachristos V, Chance B, Yodh AG. Three-dimensional Diffuse Optical Tomography in the Parallel Plane Transmission Geometry: Evaluation of a Hybrid Frequency Domain/Continuous Wave Clinical System for Breast Imaging. Med Phys. 2003;30:235–247. doi: 10.1118/1.1534109. [DOI] [PubMed] [Google Scholar]
- 6.Jiang H, Xu Y, Iftimia N, Eggert J, Klove K, Baron L, Fajardo L. Three-dimensional Optical Tomographic Imaging of Breast in a Human Subject. IEEE Trans on Medical Imaging. 2001;20:1334–1340. doi: 10.1109/42.974928. [DOI] [PubMed] [Google Scholar]
- 7.Taroni P, Spinelli L, Torricelli A, Pifferi A, Danesini GM, Cubeddu RP. Multi-wavelength Time Domain Optical Mammography. Technology in Cancer Research and Treatment. 2005:527–538. doi: 10.1177/153303460500400506. [DOI] [PubMed] [Google Scholar]
- 8.Dehghani H, Pogue B, Poplack SP, Paulsen KD. Multiwavelength Three-dimensional Near-infrared Tomography of the Breast: Initial Simulation, Phantom, and Clinical Results. Appl Opt. 2003;42:135–145. doi: 10.1364/ao.42.000135. [DOI] [PubMed] [Google Scholar]
- 9.Zhang Q, Brukilacchio TJ, Li A, Stott JJ, Chaves T, Hillman E, Wu T, Chorlton MA, Rafferty E, Moore RH, Kopas DB, Boas D. Co-registered Tomographic X-ray and Optical Breast Imaging: Initial Results. Journal of Bomedical Optics. 2005;10:024033. doi: 10.1117/1.1899183. [DOI] [PubMed] [Google Scholar]
- 10.Heffer E, Pera V, Schutz O, Siebold H, Fantini S. Near-infrared Imaging of the Human Breast: Complementing Hemoglobin Concentration Maps with Oxygenation Images. Journal of Biomedical Optics. 2004;9:1152–1160. doi: 10.1117/1.1805552. [DOI] [PubMed] [Google Scholar]
- 11.Grosenick D, Moesta KT, Wabnitz H, Mucke J, Stroszczynski C, Macdonald R, Schlag PM, Rinneberg H. Time-domain Optical Mammography: Initial Clinical Results on Detection and Characterization of Breast Tumors. Applied Optics. 2003;42:3170–3186. doi: 10.1364/ao.42.003170. [DOI] [PubMed] [Google Scholar]
- 12.Floery D, Helbich TH, Riedl CC, Jaromi S, Weber M, Leodolter S, Fuchsjaeger MH. Characterization of Benign and Malignant Breast Lesions with Computed Tomographic Laser Mammography (CTLM) Investigative Radiology. 2005;40:328–335. doi: 10.1097/01.rli.0000164487.60548.28. [DOI] [PubMed] [Google Scholar]
- 13.Chance B, Nioka SJ, Zhang J, Conant EF, Hwang E, Briest S, Orel SG, Schnall Czerniecki BJ. Breast Cancer Detection Based on Incremental Biochemical and Physiological Properties of Breast Cancers: A Six-Year, Two-Site Study. Acad Radiol. 2005;23:925–933. doi: 10.1016/j.acra.2005.04.016. [DOI] [PubMed] [Google Scholar]
- 14.Piao DQ, Jiang S, Srinivasan S, Dehghani H, Pogue B. Video-rate Near-infrared Optical Tomography using Spectrally Encoded Parallel Light Delivery. Optics Letters. 2005;30:2593–2595. doi: 10.1364/ol.30.002593. [DOI] [PubMed] [Google Scholar]
- 15.Gulsen G, Xiong B, Birgul O, Nalcioglu O. Design and Implementation of a Multifrequency Near-infrared Diffuse Optical Tomography System. Journal of Biomedical Optics. 2006;11:014020-1–10. doi: 10.1117/1.2161199. [DOI] [PubMed] [Google Scholar]
- 16.Chen NG, Guo PY, Yan SK, Piao DQ, Zhu Q. Simultaneous Near Infrared Diffusive Light and Ultrasound Imaging. Appl Opt. 2001;40:6367–6380. doi: 10.1364/ao.40.006367. [DOI] [PMC free article] [PubMed] [Google Scholar]
- 17.Chen NG, Huang MM, Xia HJ, Piao QZ, Cronin EB, Zhu Q. Portable Near Infrared Diffusive Light Imager for Breast Cancer Detection. Journal of Biomedical Optics. 2004:504–510. doi: 10.1117/1.1695410. [DOI] [PMC free article] [PubMed] [Google Scholar]
- 18.Zhu Q, Huang MM, Chen NG, Zarfos K, Jagjivan B, Kane M, Hegde P, Kurtzman SH. Ultrasound-guided Optical Tomographic Imaging of Malignant and Benign Breast Lesions. Neoplasia. 2003;5:379–388. doi: 10.1016/s1476-5586(03)80040-4. [DOI] [PMC free article] [PubMed] [Google Scholar]
- 19.Zhu Q, Cronin E, Currier A, Vine HS, Huang MM, Chen NG, Xu C. Benign Versus Malignant Breast Masses: Optical Differentiation Using US to Guide Optical Imaging Reconstruction. Radiology. 2005;237:57–66. doi: 10.1148/radiol.2371041236. [DOI] [PMC free article] [PubMed] [Google Scholar]
- 20.Zhu Q, Kurtzman SH, Hegde P, Tannenbaum S, Kane M, Huang MM, Chen NG, Jagjivan B, Zarfos K. Utilizing Optical Tomography with Ultrasound Localization to Image Heterogeneous Hemoglobin Distribution in Large Breast Cancers. Neoplasia. 2005;7:263–270. doi: 10.1593/neo.04526. [DOI] [PMC free article] [PubMed] [Google Scholar]
- 21.Fishkin JB, Coquoz O, Anderson ER, Brenner M, Tromberg B. Frequency-domain Photon Migration Measurements of Normal and Malignant Tissue Optical Properties in a Human Subject. Applied Optics. 1997;36:10–20. doi: 10.1364/ao.36.000010. [DOI] [PubMed] [Google Scholar]
- 22.Zhu Q, Chen NG, Piao DQ, Guo PY, Ding XH. Design of Near Infrared Imaging Probe with the Assistance of Ultrasound Localization. Appl Opt. 2001;40:3288–3303. doi: 10.1364/ao.40.003288. [DOI] [PMC free article] [PubMed] [Google Scholar]
- 23.Jiang H, Paulsen K, Osterberg U, Pogue B, Patterson M. Optical Image Reconstruction Using Frequency-domain Data: Simulations and Experiments. J Opt Soc Am A. 1996;13:253–266. [Google Scholar]
- 24.O’Leary M, Boas D, Chance B, Yodh A. Experimental Images of Heterogeneous Turbid Media by Frequency-domain Diffusing-photon Tomography. Optics Letters. 1995;20:426–428. doi: 10.1364/ol.20.000426. [DOI] [PubMed] [Google Scholar]
- 25.Milstein A, Stott J, Oh S, Boas D, Millane RP, Bouman C, Webb K. Fluorescence Optical Diffusion Tomography Using Multiple- frequency Data. J Opt Soc Am A. 2004;21:1035–1049. doi: 10.1364/josaa.21.001035. [DOI] [PubMed] [Google Scholar]
- 26.Matsubayashi R, Matsuo Y, Edakuni G, Satoh T, Osamu Tokunaga O, Sho Kudo S. Breast Masses with Peripheral Rim Enhancement on Dynamic Contrast-enhanced MR Images: Correlation of MR Findings with Histologic Features and Expression of Growth Factors. Radiology. 2000;217:841–848. doi: 10.1148/radiology.217.3.r00dc07841. [DOI] [PubMed] [Google Scholar]