Abstract
Stimulation of endothelial cells (ECs) with ATP evoked an increase in intracellular Ca2+ concentration ([Ca2+]i). In a single bovine aortic EC, the [Ca2+]i rise started at a specific peripheral locus and propagated throughout the entire cell as a Ca2+ wave. The initiation locus was constant upon repeated stimulation with ATP or other agonists (bradykinin and thrombin). The Ca2+ wave was unaffected by the removal of extracellular Ca2+, demonstrating its dependence on intracellular Ca2+ release. Microinjection of heparin into the cell inhibited the ATP-induced Ca2+ responses, indicating that the Ca2+ wave is at least partly mediated by the inositol 1,4,5-trisphosphate receptor. Immunofluorescence staining revealed that caveolin, a marker protein for caveolae, is distributed heterogeneously in the cell and that Ca2+ waves preferentially originate at caveolin-rich cell edges. In contrast to caveolin, internalized transferrin and subunits of the clathrin-associated adaptor complexes such as adaptor protein-1 and -2 were diffusely distributed. Disruption of microtubules by Colcemid led to redistribution of caveolin away from the edges into the perinuclear center of the cell, and the ATP-induced [Ca2+]i increase was initiated on the rim of the centralized caveolin. Thus, caveolae may be involved in the initiation of ATP-induced Ca2+ waves in ECs.
Intracellular Ca2+ is a second messenger mediating a variety of important vascular endothelial cell (EC) functions, including the production of vasoactive substances (1–3), cell proliferation (4), and gene expression (5, 6). In many cell types including excitable (7, 8) and nonexcitable cells (9–12), binding of ligands with G protein-coupled receptors stimulates phospholipase C and induces the hydrolysis of membrane phosphatidylinositol 4,5-bisphosphate into inositol 1,4,5-trisphosphate (IP3). The IP3 releases Ca2+ from the endoplasmic reticulum (ER) or sarcoplasmic reticulum, a known intracellular Ca2+ storage site, creating a spike or a rapid rise in intracellular Ca2+ concentrations ([Ca2+]i) in single cells (13). Recent advances in digital imaging techniques on the subcellular level have revealed that the Ca2+ spike is spatially and temporally organized in the form of a Ca2+ wave, and it has been well characterized in some cell types (14–16). In highly polarized cells such as pancreatic acinar cells (11, 12), for example, agonists have been shown to evoke local cytosolic Ca2+ spikes in structurally distinct intracellular microdomains, where a large amount of excretion granules are concentrated, and subsequent Ca2+ waves throughout the entire cell. It was also observed that in ECs, IP3-mobilizing agonists evoke Ca2+ waves that originate at small loci at the cell edge and propagate throughout the entire cell (9, 17). However, details of the initiation of the Ca2+ wave such as the locus-associated subcellular components or structure in ECs have not been fully clarified.
Caveolae have been a recent focus of interest as signal transducing subcompartments in the cell, and are putative sites of Ca2+ influx (18–20). They are non-clathrin-coated invaginations or vesicles near the plasma membrane, found in many cell types including ECs, adipocytes, fibroblasts, and muscle cells (21). Caveolae were first identified as endocytic compartments in ECs that transport macromolecules or internalize small molecules across the plasma membrane by transcytosis or potocytosis (22). More recently, biochemical subcellular fractionation and immunoelectron microscopy have revealed that a variety of signaling molecules are enriched within caveolar membranes. For instance, receptors for endothelin (23) and platelet-derived growth factor (24), subunits of G proteins (25–27), phospholipase C (28), the endothelial NO synthase (eNOS) (29, 30), protein kinase C (28, 31), an IP3 receptor-like protein (18), and plasmalemmal Ca2+-ATPase (19) are concentrated at caveolae and most of them are related to intracellular Ca2+ signaling. In one reported example of spatiotemporally organized subcellular signaling confined to caveolae, platelet-derived growth factor was found to rapidly induce phosphorylation of its receptor and the related signaling molecules residing in the caveolae (24, 28). In another example, the intracellular targeting of Ca2+-dependent enzyme eNOS to caveolae was essential for ligand-stimulated optimal production of NO (32). It has also been found that caveolin, a 22-kDa major integral caveolar protein, plays a major role in maintaining caveolar structure and function (31, 33, 34). Most of the caveolae or caveolin in ECs were reported to be localized or clustered primarily at the cell margin and the leading edge (29, 35).
In this study, we analyzed ATP-induced Ca2+ waves in individual ECs by confocal laser scanning microscopy with Indo-1. We combined this Ca2+ imaging with indirect immunofluorescence staining of ECs with an antibody against caveolin to examine the relationship between the initiation sites of Ca2+ waves and the caveolin distribution. In addition, we determined the localization of internalized transferrin, a marker of early endosomes, and subunits of the clathrin-associated adaptor protein-1 and -2 (AP-1 and -2), and compared them with that of caveolin.
MATERIALS AND METHODS
Materials.
Materials were purchased from the following sources. Hanks’ balanced salt solution (HBSS), ATP, heparin (molecular weight 6,000), de-N-sulfated heparin, fluorescein isothiocyanate (FITC)-dextran (molecular weight 4,400), monoclonal anti-α-adaptin, monoclonal anti-β1- and β2-adaptins, Sigma; bradykinin, thapsigargin, and demecolcine (Colcemid) solution, Wako Pure Chemical (Osaka); Indo 1-AM, Dojindo (Kumamoto, Japan); medium-199, ICN; fetal bovine serum, GIBCO (Grand Island, NY); FITC-conjugated transferrin and pluronic F127, Molecular Probes; rabbit polyclonal anti-caveolin antibody, Transduction Laboratories (Lexington, KY); FITC-donkey anti-rabbit IgG, Jackson ImmunoResearch; Cy5-goat anti-rabbit IgG, FITC-sheep anti-mouse Ig, Amersham; PermaFluor, Immunon (Pittsburgh).
Cell Culture.
Primary cultures of ECs were obtained from the descending thoracic aorta of a bovine fetus by brief collagenase digestion of the intimal lining, and were grown in Medium-199 containing 20% fetal bovine serum, 2 mM l-glutamine, 50 units/ml of penicillin, and 50 μg/ml of streptomycin. ECs were routinely passed by trypsinization in a 0.25% trypsin/1 mM EDTA solution before reaching confluence. Cumulative population doublings of ECs were calculated by Coulter Counter (Model ZM system), and subconfluent ECs with a cumulative population doubling under 40 were used in the experiments.
Dye Loading.
ECs were incubated on a coverslip at 37.0°C in 5% CO2 for 50 min in Medium-199 containing Indo 1-AM at a final concentration of 5 μM and 0.04% wt/vol pluronic F127, a dispersing agent. The cells were then washed with Indo 1-AM-free medium-199 and maintained in fresh medium with 20% fetal bovine serum at 37.0°C in 5% CO2 for 20 min to allow complete deesterification of Indo 1-AM. The cells were washed with HBSS and placed in the flow-loading chamber.
Agonist Stimulation of ECs under Flow Conditions.
We used a parallel-plate-type flow chamber (36) for agonist stimulation of the ECs. One side of the chamber was a coverslip (2.6 × 4.5 × 0.02 cm) on which cells were cultured, and the opposite side was a plate made of polymethacrylate. These two flat surfaces were held ≈200 μm apart by a silicone rubber gasket. HBSS (pH 7.4) was used as the flow perfusate in the presence and absence of ATP, bradykinin, A23187, and thapsigargin. The perfusate was supplied at a flow rate of 3 ml/min through the flow chamber from upstream through a silicone tube connected to a reservoir and drained downstream by a roller/tube pump (Atto Instruments, Potomac, MD) with a depulsator. The chamber was mounted on the stage of an inverted microscope (Diaphot 300, Nikon). The experiment was performed at room temperature.
Microinjection.
The microinjection system consisted of an Eppendorf micromanipulator 5171, a microinjector 5246, and capillaries (Femtotips; Eppendorf) with an inner tip diameter of about 0.5 μm. The holding pressure was 50 hPa, the injection pressure was 1,500 hPa, and the duration of injection was 200 ms. The injection volume was about 0.1–4% of the cell volume. Heparin (10, 50, 80 mg/ml) or de-NS heparin (10, 80 mg/ml) was coinjected with FITC-dextran (5 mg/ml), buffered with Hepes (10 mM, pH 7.2). The final intracellular concentration of the injected substances was calibrated by the fluorescence of coinjected FITC-dextran. After microinjection, the ECs were placed in an incubator for 1 to 2 h and then Indo-1 was loaded into the ECs for [Ca2+]i recordings.
Imaging of [Ca2+]i.
Fluorescent digital images of Indo-1 were obtained with a confocal laser scanning system (MRC-1000UV; Bio-Rad) equipped with an ultraviolet argon ion laser (Enterprise Ion Laser; Coherent, Santa Clara, CA). Light with a 351-nm wavelength passes from the laser into the scanning unit and excites the cells through a 40× objective (Fluor 40 water-immersion, N.A. 1.15, Nikon). The fluorescence emitted by the cells formed two-dimensional dual images through the objective, a beam splitter, a bandpass (405 nm) or a long pass (480 nm) filters, and photomultipliers. Indo-1 undergoes a large shift in peak emission from 480 (F480) to 405 nm (F405) upon binding with Ca2+, so that semiquantitative Ca2+ imaging could be feasibly performed by expressing recorded emission fluorescence as a ratio (F405/F480). Multiple regions of interest were traced for monitoring the time course of F405/F480 using the accessory time-course software of the Bio-Rad MRC 1000UV system. We marked several small dots on a coverslip with a solvent-resistant ink to identify the cells used for [Ca2+]i imaging for subsequent immunohistochemistry. Eight-bit dual digital images (96 × 128 pixels) of F405 and F480 were simultaneously acquired with a framing resolution of 0.38 s intervals, and stored as Bio-Rad PIC files in a DOS system. The recorded files were converted to PICS format and then background-corrected ratio images were processed into eight-bit pseudocolored images off-line with clsm artist, which is free software (written by M. Ono, Yokohama City University, School of Medicine), using a Power Macintosh 9500/120 (Apple).
Immunohistochemistry.
Indirect immunofluorescence staining of ECs was performed to examine the relationship between the caveolin distribution and the initiation locus of a Ca2+ wave or the distribution of markers for some cellular components. After the [Ca2+]i imaging, the cells were washed with PBS, fixed in PBS containing 3% formaldehyde for 10 min, and permeabilized with 0.1% Triton X-100 in PBS for 5 min. Cells were sequentially incubated with PBS plus 1.0% BSA for 30 min, 10 μg/ml rabbit anti-caveolin polyclonal antibody in PBS plus 0.5% BSA for 1 h, and then with FITC- conjugated anti-rabbit IgG (25 μg/ml) plus 0.5% BSA for 1 h. For double staining of adaptor complexes and caveolin, monoclonal antibodies against α-adaptin (110 μg/ml) or β1- and β2- adaptins (170 μg/ml) were simultaneously applied with anti-caveolin antibody. As secondary antibodies, mixtures of FITC-conjugated anti-mouse Ig (diluted 1/100) for adaptor complexes and Cy5-conjugated anti-rabbit IgG (10 μg/ml) for caveolin were applied. Internalized FITC-conjugated transferrin and caveolin were also doublestained. ECs were incubated with the transferrin (50 μg/ml) in culture medium for 30 min at 37°C, extensively washed, and then immunostained using a Cy5-conjugated secondary antibody for caveolin. Fluorescent-labeled samples were mounted in an antifading agent (PermaFluor) on a coverglass. Through a 60× objective (Fluor 100 oil-immersion, numerical aperture 1.3, Nikon), FITC- and Cy5-labeled samples were excited by the 488 and 647 laser lines of the krypton/argon ion laser (model 5470K; Ion Laser Technology, Salt Lake City) of the MRC-1000UV system, respectively. Sequentially collected confocal z-scan images were projected with free mrc2M software (written by M. Ono, Yokohama City University, School of Medicine) and trimmed in Adobe (Mountain View, CA) photoshop 3.0J.
RESULTS
ATP-Induced [Ca2+]i Increases Originate at Specific Loci at Cell Edges.
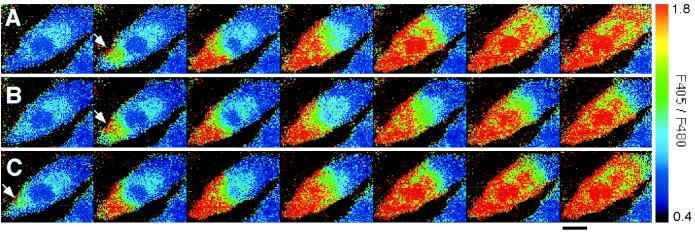
When ECs were repeatedly stimulated with 500 nM ATP under flow conditions, an increase in [Ca2+]i occurred in response to every stimulation (Fig. 1 A–C). The increase in [Ca2+]i started at a localized region at the edge of the cell and was propagated throughout the entire cell in the form of a Ca2+ wave. This was observed in virtually all of the cells that responded to stimuli. After reaching a peak, [Ca2+]i decreased gradually and homogeneously throughout the cell (data not shown). Ca2+ waves also propagated into the nuclei, but never originated in the nuclei. In certain cells, Ca2+ waves simultaneously originated at several loci at the cell edge and fused with each other (Fig. 4). The initiation loci and the propagation of Ca2+ waves did not change even when the direction of flow was reversed (data not shown).
Figure 1.
Spatiotemporal organization of Ca2+ waves in response to repeated ATP stimulation. Each set of successive pseudocolored images represents a Ca2+ wave induced by sequential stimulation with 500 nM ATP under flow conditions three times in the same cell (A–C). Ca2+ waves repeatedly originated in the same locus at the cell edge (arrows).The images were made at intervals of 0.38 s. Flow direction is from left to right. (Bar = 20 μm.)
Figure 4.
Effect of extracellular Ca2+ on ATP-induced Ca2+ waves. (A) Ca2+ wave propagation induced by 500 nM ATP with 1.8 mM extracellular Ca2+. (B) Ca2+ wave propagation induced by 500 nM ATP with free extracellular Ca2+ and 0.4 mM EGTA in the same cell as in A. The initiation loci (arrows) were not affected with or without extracellular Ca2+. The images were made at intervals of 0.76 s. (Bar = 20 μm.)
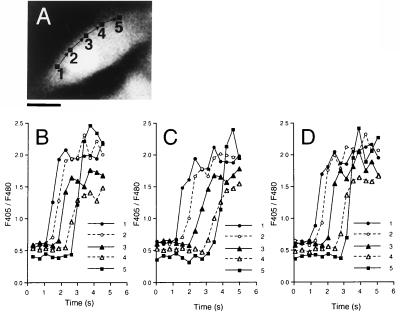
The initiation locus and the path of a Ca2+ wave were highly reproducible in response to repeated stimulations. To quantitatively compare Ca2+ waves in response to three successive stimuli, the time course of the changes in [Ca2+]i were measured in five regions of interest (Fig. 2 A, 1 to 5). The propagation of the Ca2+ wave was almost identical in three repeated stimuli (B, C, D). The velocity of Ca2+ wave propagation was 30.0 ± 14.5 μm/s (mean ± SD, n = 83).
Figure 2.
Quantitative analysis of Ca2+ wave propagation through intracellular regions induced by repeated ATP stimulation. (A) A fluorescent cell image of 480-nm emission before stimulation. Arrows indicate the path of the Ca2+ wave. (Bar = 20 μm.) (B–D) These traces demonstrate the time course of Ca2+ changes in five subcellular regions 2.6 μm square (1–5), 10 μm apart from each other in a single cell, stimulated with ATP three times.The respective velocities of Ca2+ wave propagation were 25, 17, and 21 μm/s.
Figure 5.
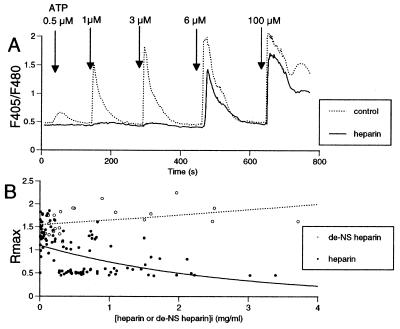
Inhibition of ATP-induced [Ca2+]i increases by microinjection with heparin. (A) Representative traces of ATP-induced [Ca2+]i responses in single ECs with (—) or without (⋅ ⋅ ⋅) microinjection of heparin. An EC microinjected with heparin showed decreased amplitude of [Ca2+]i spikes as compared with a noninjected cell. The intracellular concentration of microinjected heparin ([heparin]i) in this cell was estimated to be 620 μg/ml by calibration with coinjected FITC-dextran (see Materials and Methods). (B) Plots of the peak amplitude of ATP (3 μM)-induced [Ca2+]i responses, which are expressed by the maximum ratio of F405/F480 (Rmax), in ECs microinjected with heparin (•, n = 99) or de-N-sulfated heparin (○, n = 22).
[Ca2+]i Responses to Agonists Other than ATP.
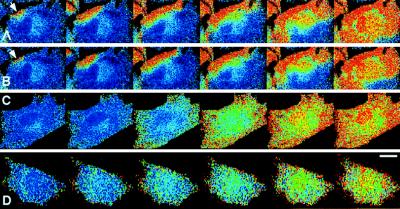
After recording the ATP-induced Ca2+ responses, the ECs were washed with HBSS and then stimulated with bradykinin, thrombin, A23187 (a calcium ionophore), or thapsigargin (a specific inhibitor of Ca2+-ATPase on ER). The initiation loci and propagation pathway of Ca2+ waves induced by 100 nM bradykinin (Fig. 3 B) and 1 unit/ml thrombin (data not shown) were the same as those generated by 500 nM ATP (Fig. 3 A). Any combination of two of these three IP3-mobilizing agonists (1 μM ATP/200 nM bradykinin/2 units/ml thrombin), and all three of them combined, evoked Ca2+ waves that originated in the same locus as evoked by any one of the agonist alone (data not shown), indicating that the initiation locus is not specific to the species of ligand. On the other hand, a non-IP3-mobilizing agonist such as A23187 (1 μM) and thapsigargin (1 μM) increased [Ca2+]i relatively slowly and homogeneously all over the cell, and caused no Ca2+ waves (Fig. 3 C, D).
Figure 3.
[Ca2+]i changes in response to various agonists. Successive images demonstrate [Ca2+]i changes in response to (A) 500 nM ATP, (B) 100 nM bradykinin, (C) 1 μM A23187, and (D) 1 μM thapsigargin. The images are shown at intervals of 1.14 s in A and B, 2 s in C, and 18 s in D. The cell shown in A and B is the same and arrows indicate the specific locus for the Ca2+ wave initiation. Flow direction is from right to left in all images. (Bar = 20 μm.)
IP3-mediated Ca2+ Mobilization Is Involved in ATP-induced Ca2+ Spikes.
After successive images of Ca2+ wave propagation induced in a cell by 500 nM ATP had been acquired, we exposed the cell to Ca2+-free HBSS with 0.4 mM EGTA for 1 min and then compared responses to the same ATP stimulation with and without extracellular Ca2+. Although the peak amplitude of the Ca2+ response decreased slightly, the initiation loci and paths of the Ca2+ waves were unaffected in the absence of extracellular Ca2+ (Fig. 4 A, B).
Microinjection of heparin, a competitive inhibitor of the IP3 receptor (13, 37–39), had no effect on resting [Ca2+]i, but decreased the amplitude of the [Ca2+]i spikes caused by ATP (Fig. 5A, ⋅ ⋅ ⋅). The peak amplitude of [Ca2+]i spikes induced by 3 μM ATP was inversely correlated to the concentration of heparin (Fig. 5B, •). In contrast, a control heparin molecule, de-N-sulfated heparin, failed to inhibit the ATP-induced Ca2+ responses (Fig. 5B ○). These findings suggest that the source of Ca2+ for the ATP-induced Ca2+ spikes is IP3-mediated mobilization of Ca2+ from internal stores.
Ca2+ Waves Preferentially Originate at the Periphery of Caveolin-Rich Microdomains.
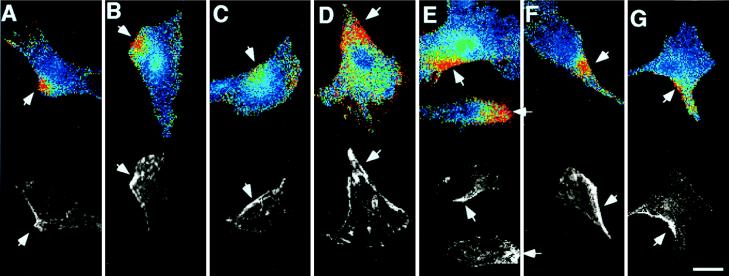
To examine the relationship between the spatiotemporal [Ca2+]i dynamics and caveolin distribution, ECs were immunostained with polyclonal antibody to caveolin after the recording of Ca2+ waves (n = 39). Caveolin was distributed heterogeneously in the cell and tended to concentrate preferentially at specific parts of the cell edge (Fig. 6 A to G).The initiation loci of the Ca2+ waves corresponded precisely to the caveolin-rich cell edge regions.
Figure 6.
Comparison of the Ca2+ wave initiation sites and the distribution of caveolin. Seven pairs of images (A–G) demonstrate the relationship between the initiation loci of ATP-induced Ca2+ waves and caveolin distribution. (Upper) Pseudocolored ratio images at the moment just after the Ca2+ waves arose at subcellular microdomains at the cell edges. (Lower) Fluorescent images immunostained with anti-caveolin antibody are shown with a gray scale. The hot spots for Ca2+ wave initiation are highly enriched with caveolin (arrows). (Bar = 20 μm.)
Colcemid Altered Caveolin Distribution and Initiation Sites of Ca2+ Waves.
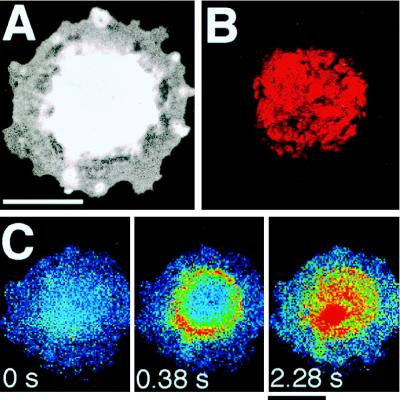
Treatment with Colcemid, which is known to disrupt microtubule organization, caused ECs become round with no extending filopodia (Fig. 7A). This morphological change was reversible by subsequent culture with Colcemid-free medium (data not shown). Caveolin was retracted away from the cell edge and nodularly centralized around the nucleus in the cell after Colcemid treatment (Fig. 7B). A Ca2+ wave induced by 1 μM ATP did not originate at the cell edge, but rather on the rim of the gathered caveolin (Fig. 7C).
Figure 7.
Effect of Colcemid treatment on the distribution of caveolin and initiation sites of ATP-induced Ca2+ waves. (A) A fluorescent cell image of 480-nm emission of Indo-1. Colcemid treatment (0.1 μg/ml) for 24 h caused the cell to become rounded. (B) An image of caveolin distribution in the same cell as in A. This is a projection of 10 z-scan images taken confocally at intervals of 0.5 μm from the basal to the apical. Caveolin was retracted in the perinuclear center of the cell. (C) An ATP-induced Ca2+ wave did not originate at the cell edge but on the rim of nodularly assembled caveolin. (Bar = 20 μm.)
Initiation Sites of the Ca2+ Waves Are Not Associated with Clathrin-associated Membranes.
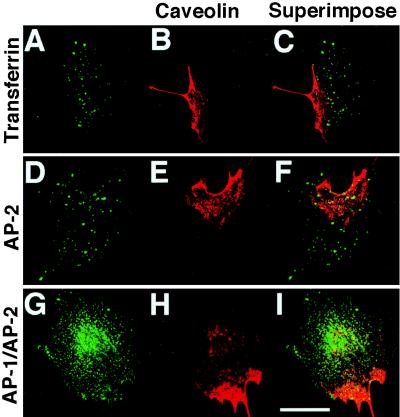
Internalized FITC-conjugated transferrin, which is supposed to be internalized via its clathrin-coated receptor into early endosomes (39), was distributed evenly throughout a cell in a clear dotted pattern and did not preferentially colocalize with caveolin concentrated at the cell edge (Fig. 8 A–-C). Indirect immunofluorescence for α-adaptin, a specific subunit of the clathrin-associated adaptor complex AP-2 (40, 41), revealed that the subcellular distribution of the AP-2 exhibits a diffuse punctuate pattern similar to that of internalized FITC-conjugated transferrin (Fig. 8 D–F). The immunostaining of β1- and β2-adaptins, which are subunits of the clathrin-associated adaptor complex AP-1 (42) and AP-2, respectively, showed a diffuse distribution and a somewhat dense staining in the perinuclear region, which was apparently distinct from the distribution of caveolin (Fig. 8 G and H). These findings indicate that the sites of initiation of the Ca2+ waves are not associated with clathrin-associated vesicles or membranes.
Figure 8.
Distribution of internalized FITC-conjugated transferrin and adaptor complexes. Caveolin was doublestained with markers of other vesicular components. Caveolin-rich cell edges appear to be distinct from and not associated with subcellular distribution of (A) internalized FITC-conjugated transferrins, (D) α-adaptins (AP-2), and (G) β1- and β2-adaptins (AP-1 and AP-2). Corresponding caveolin images (B, E, H) and superimposed images (C, F, I) are shown in the middle and the right column, respectively. Every image displayed is a projection of 5 z-scan images taken confocally at intervals of 1 μm from the basal to the apical. (Bar = 20 μm.)
DISCUSSION
The results of the present study demonstrate that the ATP-induced Ca2+ waves in ECs originate at specific discrete loci in caveolin-rich cell edges from which they propagate throughout the rest of the cell. Although Ca2+ waves and oscillations in ECs have been previously observed by other researchers (9, 17, 43), this is the first description of the association of the wave origin with caveolin-rich regions.
The reason why a Ca2+ wave originates at a caveolin-rich cell edge is not clear at present. Several possible mechanisms can be proposed. (i) Receptors for ATP and bradykinin may be concentrated at caveolae, but their subcellular distribution in unstimulated static ECs is still unknown. It has been reported that bradykinin itself, when bound to its receptors, promotes the recruitment and sequestration of the occupied receptors and the receptor-coupled Gα subunits into caveolae in DDT1MF-2 smooth muscle cells (44). However, the time course of this recruitment (t1/2 2–5 min) does not parallel Gα-mediated bradykinin stimulation of PI hydrolysis (around 15 s) in the cell, suggesting that the concentration of bradykinin receptors into caveolae may not be required for the early Ca2+ signaling through the receptor (44). (ii) Substrates or signal transduction cascades required for the production of IP3 may be concentrated at caveolae. In A431 cells, plasma membrane phosphatidylinositol 4,5-bisphosphate, a substrate for IP3, was found to be largely localized in caveolae, and this caveolar phosphatidylinositol 4,5-bisphosphate was specifically hydrolyzed by hormone-stimulated phospholipase C (45). Therefore, IP3 may be locally generated around caveolae. (iii) IP3 receptors or releasable Ca2+ stores may be concentrated at or near caveolae. The ER, an intracellular Ca2+ store bearing an IP3 receptor on its membrane, may interconnect or colocalize with caveolae (46). Another possibility is the involvement of an IP3 receptor-like protein concentrated on caveolar membranes. If this molecule functions similar to an IP3 receptor for Ca2+ fluxes across caveolar membranes where plasmalemmal Ca2+-ATPase is presumably colocalized, caveolae could possibly play a similar role to ER (18, 19). Histochemical studies have indicated that caveolae of smooth muscle cells contain high concentrations of Ca2+ (47). It is also known that caveolae, morphologically, are not a static component of the cell surface and that they can either be open in direct communication with the extracellular space or be closed as plasmalemmal vesicles to store trapped molecules such as Ca2+ (20).
Although the physiological significance of Ca2+ waves originating at specific loci at cell edges is unclear, it may be advantageous to ECs as a defense against the cytotoxicity of Ca2+ and to quantify signals. If the Ca2+ wave originates near caveolae, where a large amount of Ca2+ dependent kinases and enzymes such as protein kinase C (48) and eNOS (29, 30) are concentrated, the Ca2+ signal could reach target proteins rapidly and transduction could be performed efficiently. Mislocalization of eNOS caused by a mutation in the eNOS gene impairs Ca2+-dependent production of stimulated NO, suggesting that intracellular targeting of eNOS to caveolae is critical for optimal NO production (32). Regulated signal transduction in discrete microdomains near the caveolae is an attractive hypothesis for achieving spatial and temporal specificity in signaling. Further investigations including experiments using antisense RNA inhibition of caveolin and mutational analysis of caveolin are needed to clarify how caveolae or caveolin are functionally involved in the initiation of endothelial Ca2+ waves.
Acknowledgments
We sincerely thank Dr. Michio Ono for his assistance in image processing with his free software clsm artist. This work was partly supported by grants-in-aid for Scientific Research and for Scientific Research on Priority Areas from the Japanese Ministry of Education, Science and Culture, a research grant for cardiovascular diseases from the Japanese Ministry of Health and Welfare, research funds from Tsumura Co., and the Program for Promotion of Fundamental Studies in Health Sciences of the Organization for Drug ADR Relief Research and Development Promotion and Product Review of Japan.
ABBREVIATIONS
- ECs
endothelial cells
- [Ca2+]i
intracellular free calcium ion concentrations
- IP3
inositol 1,4,5-trisphosphate
- ER
endoplasmic reticulum
- FITC
fluorescein isothiocyanate
- AP-1 and -2
adaptor protein-1 and -2
- eNOS
endothelial NO synthase
- HBSS
Hanks’ balanced salt solution
References
- 1.Blatter L A, Taha Z, Mesaros S, Shacklock P S, Wier W G, Malinski T. Circ Res. 1995;76:922–924. doi: 10.1161/01.res.76.5.922. [DOI] [PubMed] [Google Scholar]
- 2.Parsaee H, McEwan J R, MacDermot J. Br J Pharmacol. 1993;110:411–415. doi: 10.1111/j.1476-5381.1993.tb13825.x. [DOI] [PMC free article] [PubMed] [Google Scholar]
- 3.Wiemer G, Popp R, Scholkens B A, Gogelein H. Brain Res. 1994;638:261–266. doi: 10.1016/0006-8993(94)90658-0. [DOI] [PubMed] [Google Scholar]
- 4.Kohn E C, Alessandro R, Spoonster J, Wersto R P, Liotta L A. Proc Natl Acad Sci USA. 1995;92:1307–1311. doi: 10.1073/pnas.92.5.1307. [DOI] [PMC free article] [PubMed] [Google Scholar]
- 5.Marsen T A, Simonson M S, Dunn M J. J Cardiovasc Pharmacol. 1995;26:S1–S4. [PubMed] [Google Scholar]
- 6.Morita T, Kurihara H, Maemura K, Yoshizumi M, Nagai R, Yazaki Y. Circ Res. 1994;75:630–636. doi: 10.1161/01.res.75.4.630. [DOI] [PubMed] [Google Scholar]
- 7.Cornell-Bell A H, Finkbeiner S M. Cell Calcium. 1991;12:185–204. doi: 10.1016/0143-4160(91)90020-f. [DOI] [PubMed] [Google Scholar]
- 8.Ishide N, Miura M, Sakurai M, Takishima T. Am J Physiol. 1992;263:H327–H332. doi: 10.1152/ajpheart.1992.263.2.H327. [DOI] [PubMed] [Google Scholar]
- 9.Jacob R. Cell Calcium. 1990;11:241–249. doi: 10.1016/0143-4160(90)90075-6. [DOI] [PubMed] [Google Scholar]
- 10.Rooney T A, Sass E J, Thomas A P. J Biol Chem. 1990;265:10792–10796. [PubMed] [Google Scholar]
- 11.Kasai H, Li Y X, Miyashita Y. Cell. 1993;74:669–677. doi: 10.1016/0092-8674(93)90514-q. [DOI] [PubMed] [Google Scholar]
- 12.Thorn P, Lawrie A M, Smith P M, Gallacher D V, Petersen O H. Cell. 1993;74:661–668. doi: 10.1016/0092-8674(93)90513-p. [DOI] [PubMed] [Google Scholar]
- 13.Berridge M J. Nature (London) 1993;361:315–325. doi: 10.1038/361315a0. [DOI] [PubMed] [Google Scholar]
- 14.Rooney T A, Thomas A P. Cell Calcium. 1993;14:674–690. doi: 10.1016/0143-4160(93)90094-m. [DOI] [PubMed] [Google Scholar]
- 15.Berridge M J, Dupont G. Curr Opin Cell Biol. 1994;6:267–274. doi: 10.1016/0955-0674(94)90146-5. [DOI] [PubMed] [Google Scholar]
- 16.Miyazaki S. Curr Opin Cell Biol. 1995;7:190–196. doi: 10.1016/0955-0674(95)80027-1. [DOI] [PubMed] [Google Scholar]
- 17.Ohata H, Ujike Y, Momose K. Am J Physiol. 1997;272:C1980–C1987. doi: 10.1152/ajpcell.1997.272.6.C1980. [DOI] [PubMed] [Google Scholar]
- 18.Fujimoto T, Nakade S, Miyawaki A, Mikoshiba K, Ogawa K. J Cell Biol. 1992;119:1507–1513. doi: 10.1083/jcb.119.6.1507. [DOI] [PMC free article] [PubMed] [Google Scholar]
- 19.Fujimoto T. J Cell Biol. 1993;120:1147–1157. doi: 10.1083/jcb.120.5.1147. [DOI] [PMC free article] [PubMed] [Google Scholar]
- 20.Anderson R G. Proc Natl Acad Sci USA. 1993;90:10909–10913. doi: 10.1073/pnas.90.23.10909. [DOI] [PMC free article] [PubMed] [Google Scholar]
- 21.Severs N J. J Cell Sci. 1988;90:341–348. doi: 10.1242/jcs.90.3.341. [DOI] [PubMed] [Google Scholar]
- 22.Anderson R G, Kamen B A, Rothberg K G, Lacey S W. Science. 1992;255:410–411. doi: 10.1126/science.1310359. [DOI] [PubMed] [Google Scholar]
- 23.Chun M, Liyanage U K, Lisanti M P, Lodish H F. Proc Natl Acad Sci USA. 1994;91:11728–11732. doi: 10.1073/pnas.91.24.11728. [DOI] [PMC free article] [PubMed] [Google Scholar]
- 24.Liu P, Ying Y, Ko Y G, Anderson R G. J Biol Chem. 1996;271:10299–10303. doi: 10.1074/jbc.271.17.10299. [DOI] [PubMed] [Google Scholar]
- 25.Sargiacomo M, Sudol M, Tang Z, Lisanti M P. J Cell Biol. 1993;122:789–807. doi: 10.1083/jcb.122.4.789. [DOI] [PMC free article] [PubMed] [Google Scholar]
- 26.Chang W J, Ying Y S, Rothberg K G, Hooper N M, Turner A J, Gambliel H A, De Gunzburg J, Mumby S M, Gilman A G, Anderson R G. J Cell Biol. 1994;126:127–138. doi: 10.1083/jcb.126.1.127. [DOI] [PMC free article] [PubMed] [Google Scholar]
- 27.Li S, Okamoto T, Chun M, Sargiacomo M, Casanova J E, Hansen S H, Nishimoto I, Lisanti M P. J Biol Chem. 1995;270:15693–15701. doi: 10.1074/jbc.270.26.15693. [DOI] [PubMed] [Google Scholar]
- 28.Liu J, Oh P, Horner T, Rogers R A, Schnitzer J E. J Biol Chem. 1997;272:7211–7222. doi: 10.1074/jbc.272.11.7211. [DOI] [PubMed] [Google Scholar]
- 29.Garcia-Cardena G, Oh P, Liu J, Schnitzer J E, Sessa W C. Proc Natl Acad Sci USA. 1996;93:6448–6453. doi: 10.1073/pnas.93.13.6448. [DOI] [PMC free article] [PubMed] [Google Scholar]
- 30.Shaul P W, Smart E J, Robinson L, German Z, Yuhanna I S, Ying Y, Anderson R G, Michel T. J Biol Chem. 1996;271:6518–6522. doi: 10.1074/jbc.271.11.6518. [DOI] [PubMed] [Google Scholar]
- 31.Lisanti M P, Scherer P E, Vidugiriene J, Tang Z, Hermanowski-Vosatka A, Tu Y H, Cook R F, Sargiacomo M. J Cell Biol. 1994;126:111–126. doi: 10.1083/jcb.126.1.111. [DOI] [PMC free article] [PubMed] [Google Scholar]
- 32.Liu J, Garcia-Cardena G, Sessa W C. Biochemistry. 1996;35:13277–13281. doi: 10.1021/bi961720e. [DOI] [PubMed] [Google Scholar]
- 33.Fra A M, Williamson E, Simons K, Parton R G. Proc Natl Acad Sci USA. 1995;92:8655–8659. doi: 10.1073/pnas.92.19.8655. [DOI] [PMC free article] [PubMed] [Google Scholar]
- 34.Rothberg K G, Heuser J E, Donzell W C, Ying Y S, Glenney J R, Anderson R G. Cell. 1992;68:673–682. doi: 10.1016/0092-8674(92)90143-z. [DOI] [PubMed] [Google Scholar]
- 35.Parton R G. J Histochem Cytochem. 1994;42:155–166. doi: 10.1177/42.2.8288861. [DOI] [PubMed] [Google Scholar]
- 36.Ohtsuka A, Ando J, Korenaga R, Kamiya A, Toyama-Sorimachi N, Miyasaka M. Biochem Biophys Res Commun. 1993;193:303–310. doi: 10.1006/bbrc.1993.1624. [DOI] [PubMed] [Google Scholar]
- 37.Berridge M J, Irvine R F. Nature (London) 1989;341:197–205. doi: 10.1038/341197a0. [DOI] [PubMed] [Google Scholar]
- 38.Ehrlich B E, Watras J. Nature (London) 1988;336:583–586. doi: 10.1038/336583a0. [DOI] [PubMed] [Google Scholar]
- 39.Ghosh R N, Maxfield F R. J Cell Biol. 1995;128:549–561. doi: 10.1083/jcb.128.4.549. [DOI] [PMC free article] [PubMed] [Google Scholar]
- 40.Peeler J S, Brodsky F M, Anderson R G. J Biol Chem. 1990;265:16514–16520. [PubMed] [Google Scholar]
- 41.Keen J H. J Biol Chem. 1995;270:23768–23773. doi: 10.1074/jbc.270.40.23768. [DOI] [PubMed] [Google Scholar]
- 42.Ahle S, Mann A, Eichelsbacher U, Ungewickell E. EMBO J. 1988;7:919–929. doi: 10.1002/j.1460-2075.1988.tb02897.x. [DOI] [PMC free article] [PubMed] [Google Scholar]
- 43.Missiaen L, Lemaire F X, Parys J B, De Smedt H, Sienaert I, Casteels R. Pflügers Arch. 1996;431:318–324. doi: 10.1007/BF02207268. [DOI] [PubMed] [Google Scholar]
- 44.de Weerd W F, Leeb-Lundberg L M. J Biol Chem. 1997;272:17858–17866. doi: 10.1074/jbc.272.28.17858. [DOI] [PubMed] [Google Scholar]
- 45.Pike L J, Casey L. J Biol Chem. 1996;271:26453–26456. doi: 10.1074/jbc.271.43.26453. [DOI] [PubMed] [Google Scholar]
- 46.Bundgaard M. Fed Proc. 1983;42:2425–2430. [PubMed] [Google Scholar]
- 47.Suzuki S, Sugi H. Cell Tissure Res. 1989;257:237–246. doi: 10.1007/BF00261826. [DOI] [PubMed] [Google Scholar]
- 48.Tang Z L, Scherer P E, Lisanti M P. Gene. 1994;147:299–300. doi: 10.1016/0378-1119(94)90087-6. [DOI] [PubMed] [Google Scholar]


