

Abstract
Background
The ubiquitous plasma membrane transcobalamin II receptor (TC II-R) mediates uptake of cobalamin (Cbl; vitamin B12), an essential micronutrient. Tumors often require more Cbl than normal tissue, and increased Cbl uptake may result from increased TC II-R expression. To examine whether Cbl could therefore be used as a carrier molecule to target a chemotherapy drug, we tested an analogue of Cbl with nitric oxide as a ligand, nitrosylcobalamin (NO-Cbl). Because interferon β (IFN-β) has antitumor effects and increases expression of some membrane receptors, we examined whether it may enhance the effects of NO-Cbl.
Methods
Antiproliferative effects of NO-Cbl were assessed in 24 normal and cancer cell lines. Xenograft tumors of human ovarian cancer NIH-OVCAR-3 cells were established in athymic nude mice, and tumor growth was monitored after treatment with NO-Cbl and IFN-β, both individually and concomitantly. TC II-R expression and apoptosis was monitored in vitro and in vivo. RNA protection assays and mitochondrial membrane potential assays were used to distinguish the extrinsic and intrinsic apoptotic pathways, respectively.
Results
Cancer cell lines were more sensitive to NO-Cbl (with ID50s [the dose that inhibits growth by 50%] as low as 2 µM) than normal cell lines (with ID50s of 85–135 µM). Single-agent NO-Cbl and IFN-β treatment of NIH-OVCAR-3 xenografts induced tumor regression, whereas combination treatment induced tumor eradication. IFN-β treatment increased TC II-R expression in vitro and uptake of [57Co]cobalamin in vivo. Compared with NIH-OVCAR-3 cells treated with NO-Cbl, cells treated with NO-Cbl and IFN-β were more apoptotic and expressed higher mRNA levels of various apoptosis-associated genes. No changes in mitochondrial membrane potential were observed in cells treated with NO-Cbl.
Conclusion
NO-Cbl inhibited tumor growth in vivo by activating the extrinsic apoptotic pathway. The increased expression of TC II-R induced by IFN-β resulted in enhanced antitumor effects with NO-Cbl both in vitro and in vivo.
Cobalamin (Cbl; vitamin B12), an essential micronutrient, was first isolated and crystallized in 1948 by Rickes et al. (1). Since then, a number of studies (2–4) have demonstrated that Cbl is important in maintaining differentiation, proliferation, and metabolic status of cells. Circulating Cbl binds plasma transcobalamin II (TC II), a 43-kd nonglycosylated protein (3), and is taken up by receptor-mediated endocytosis in all cells via a specific receptor, TC II receptor (TC II-R) (5). Following endocytosis of TC II-Cbl, TC II is degraded in the lysosomes and the liberated Cbl is converted to its coenzyme forms, methyl-Cbl and 5′-deoxyadenosyl-Cbl. Methyl-Cbl is used for the conversion of homocysteine to methionine by the enzyme methionine synthase; 5′-deoxyadenosyl-Cbl is used for the conversion of methylmalonyl coenzyme A (CoA) to succinyl CoA, an important intermediate of the tricarboxylic acid cycle (6), by the enzyme methylmalonyl CoA mutase. Intracellular Cbl deficiency results in multiple organ disorders that include hematologic (reticulocytes), immunologic (lymphocytes), gastrointestinal (absorptive epithelial), and neurologic (glial) defects. Impaired DNA synthesis is associated with the onset of megaloblastosis (7–9).
Studies dating back 50 years demonstrate that the TC II/TC II-R delivery system of Cbl plays an important role in Cbl uptake in transformed cells. First, Cbl accumulation occurred preferentially in tumors (10,11). Second, autoradiography of histologic sections demonstrated an increased affinity for Cbl by some tumors in vivo (11,12). Third, accumulation of Cbl in tumors has recently been confirmed with radioimaging studies in rats (13) and humans (14), using radiolabeled Cbl analogues to detect occult tumors. Fourth, most tumor cells are methionine dependent (15) and cease to proliferate in the absence of methionine in the medium. However, when cultured in the presence of homo-cysteine, an immediate precursor of methionine, methionine-dependent cells demonstrate increased TC II-R activity and Cbl import (16), indicating increased loss or enhanced use of Cbl (17,18). Fifth, although the molecular mechanism (lack of binding to TC II or induction of Cbl deficiency) is not clear, certain Cbl analogues have antiproliferative activity against leukemia cells (19). In addition, monoclonal antibodies against TC II that block its binding to TC II-R can inhibit proliferation of leukemic cells (20,21). Taken together, these studies suggest that increased Cbl delivery in cancer cells may be a result of increased TC II-R expression on the cancer cell plasma membrane.
Current antitumor therapies have focused on drug targeting and selective uptake of chemotherapeutic agents (22,23). We hypothesized that because malignancies require more Cbl than normal tissues, Cbl bound to TC II could be used as a carrier molecule to target a chemotherapeutic drug. In the current study, we tested this hypothesis and used the cell surface TC II-R to mediate internalization of a Cbl analogue that is toxic to cancer cells. We designed a Cbl analogue with nitric oxide (NO) as an axial ligand, nitrosylcobalamin (NO-Cbl), to function as a biologic “Trojan horse” that uses receptor-mediated Cbl uptake to target NO-Cbl to cancer cells (24). We rationalized that once NO is liberated intracellularly, it would inhibit cellular metabolism (25) and directly damage DNA (26), leading to apoptosis and necrosis (27).
Because we hypothesized that increased TC II-R expression would lead to enhanced cellular uptake of NO-Cbl, we sought to examine the effects of agents that would modulate expression of TC II-R. Interferons (IFNs) increase expression of several plasma membrane receptors on the surface of normal cells, including human leukocyte antigen (HLA-I), HLA-II, and β2-microglobulin (28,29). IFNs also increase expression of tumor-associated antigens such as carcinoembryonic antigen, tumor-associated glycoprotein-72 (30), and the ovarian cancer-related CA125 antigen (31). However, the effect of IFNs on TC II-R is unknown. Because IFN-β enhances expression of tumor-associated antigens (32) and has direct antitumor activity (28,29), we examined the effects of IFN-β on the antitumor activity of NO-Cbl and TC II-R expression.
MATERIALS AND METHODS
Synthesis of NO-Cbl
NO-Cbl was synthesized as described (24). The reaction proceeded in a closed system within a heavy-wall vessel (Ace Glass, Vineland, NJ). The system was nitrogen purged daily and evacuated before NO gas exposure. Hydroxocobalamin (vitamin B12a) acetate (Sigma Chemical, St. Louis, MO) was dissolved in dichloromethane (Burdick and Jackson, Muskegon, MI) at a concentration of 5 mg/mL and exposed in the vessel to chemically pure 2.5 grade NO gas (Praxair, Wickliff, OH) at 150 psi. With the use of a stainless steel cylinder (Swagelok; Abbott Valve and Fitting, Solon, OH) containing NaOH pellets, nitrogen oxide contaminants were removed from the NO gas before the gas entered the system. The solid NO-Cbl product was collected after rotary evaporation of the solvent and stored at −20 °C until use.
Cell Culture
Twenty-four cell lines were obtained from the American Type Culture Collection (ATCC, Manassas, VA) (Table 1). Cells were maintained in RPMI or Dulbecco’s modified Eagle medium (Mediatech, Herndon, VA) containing 5% fetal bovine serum (FBS; HyClone, Logan, UT) and 1% Antibiotic-Antimycotic (GIBCO BRL, Invitrogen, Carlsbad, CA) according to the recommendations from the ATCC. Cells were maintained in 5% CO2 at 37 °C in a humidified tissue culture incubator.
Table 1.
Nitrosylcobalamin human cell lines, sulforhodamine assay
| Cell line | Type | ID50(µM) |
|---|---|---|
| RPMI-8226 | Leukemia | 2 |
| SR | Leukemia | 2 |
| MOLT 4 | Acute lymphoblastic leukemia | 5 |
| K-562 | Chronic myelogenous leukemia | 6 |
| NIH-OVCAR-3 | Ovarian carcinoma | 8 |
| U 266 | Myeloma | 10 |
| U 937 | Promonocytic leukemia | 11 |
| JURKAT | Acute T-cell leukemia | 15 |
| MCF-7 | Breast carcinoma | 16 |
| KU-2 | Renal carcinoma | 16 |
| HUT 78 | Cell lymphoma | 20 |
| WM9 | Melanoma | 22 |
| WM 35 | Melanoma | 30 |
| Caov-3 | Ovarian carcinoma | 32 |
| WM 164 | Melanoma | 35 |
| WI-38 VA13 | Fibroblasts SV40 T antigen | 36 |
| DU 145 | Prostate, androgen insensitive | 51 |
| A 549 | Lung carcinoma | 54 |
| WM 3211 | Melanoma | 54 |
| LNCaP | Prostate, androgen sensitive | 55 |
| PC-3 | Prostate, PMSA negative* | 56 |
| C4-2 | Prostate, androgen insensitive | 75 |
| WI-38 | Normal lung fibroblasts | 85 |
| HUVEC | Umbilical vein endothelium | 135 |
PMSA = prostate-specific membrane antigen.
Sulforhodamine B Cell Growth Assay
Cells were plated in 96-well plates in 0.2-mL aliquots containing 2000 cells. After 6 hours to allow for cell adherence, drug stock solutions (100x) of NO-Cbl, IFN-β (Biogen, Cambridge, MA), or the simultaneous combination (NO-Cbl and IFN-β) were diluted in medium and added to the wells. The cells were cultured for 5 days in the continuous presence of the various agents. Growth was monitored by the sulforhodamine B (SRB; Sigma Chemical) colorimetric assay (33,34) as follows: After 5 days, the medium was removed, and the cells were fixed with 10% trichloroacetic acid and stained with SRB. Bound dye was eluted from the cells with 10 mM Tris-HCl (pH 10.5), and absorbance was measured at 570 nm. To quantify the growth of the cells, the experimental absorbance values (Aexp) were compared with initial absorbance readings representing the starting cell numbers (Aini). To determine the starting cell number, an additional 96-well plate was seeded with cells and fixed at the beginning of the experiment. After 5 days’ growth, the untreated control cells and drug-treated cells were fixed and stained with SRB. The absorbances derived from the initial plate and from the untreated cells at the end of the growth period (Afin) were defined as 0% and 100% growth, respectively. The percentage control growth (100% × [Aexp − Aini]/[Afin − Aini]) is expressed as a percentage of untreated controls. A decrease in cell number (death) is represented as a negative value on the y-axis. Each treatment group contained eight replicates. A Coulter counter was also used to independently verify cell number following drug treatment.
In Vivo Experiments
All procedures for animal experimentation were approved by the Institutional Animal Care and Use Committee at the Cleveland Clinic Foundation. On day 0, 3-week-old NCR male athymic nude homozygous (nu/nu) mice (Taconic, Germantown, NY) were injected subcutaneously into their flanks (along the midaxillary line) with 2 × 10⁶ NIH-OVCAR-3 cells suspended in phosphate-buffered saline (PBS). On day 7, the mice were injected with NO-Cbl (100 mg/kg, intraperitoneally), human IFN-β (1 × 10⁵ U, subcutaneously), or both. Control mice received a subcutaneous injection of 0.1 mL PBS. The drug injections were administered daily for 54 days. Tumors were measured three times a week for the duration of the study, and tumor volumes were derived using the formula for a prolate spheroid: (4/3)πab², where 2a = major diameter and 2b = minor diameter. Each of the four experimental groups (control, NO-Cbl, IFN-β, NO-Cbl + IFN-β) contained eight mice, and each mouse had one tumor.
After 54 days, mice were killed and the tumors were removed. Tumors were fixed in formalin, embedded in paraffin, and processed by the Cleveland Clinic Histology Core facility. Sections (4-µm thick) were stained with hematoxylin and eosin and evaluated for pathologic changes in a blinded fashion.
Immunohistochemical Analysis of TC II-R
Additional mice were inoculated with NIH-OVCAR-3 or WM9 cells. Tumors were grown for 3 days, and the mice were then injected subcutaneously with IFN-β (105 U/day) for 3 days. The mice were killed and the tumors removed, processed, and sectioned as described above. The sections were processed for immunohistochemical analysis as follows: After dewaxing, the sections were subjected to antigen retrieval using proteinase K (10 µg/mL) (GIBCO BRL, Invitrogen) at 37 °C for 30 minutes. Endogenous peroxidase activity of the sections was quenched by incubation in 3% hydrogen peroxide in methanol for 10 minutes at room temperature. The sections were then blocked in 10% FBS for 30 minutes at room temperature and incubated with rabbit polyclonal anti-TC II-R antibody (1:5 dilution) in blocking solution (10% FBS) at room temperature for 1 hour. After extensive washing in PBS (pH 7.4), the sections were incubated with a horseradish peroxidase-conjugated secondary antibody (1:50 dilution) in blocking solution for 30 minutes at room temperature, and the antigen-antibody complexes were detected with diaminobenzidine as a chromogen. The sections were counterstained with hematoxylin and examined by light microscopy on a Leica DMR microscope (Leica, Heidelberg, Germany) equipped with a MagnaFire Color cooled charge-coupled device camera (Optronics, Goleta, CA) running Optronics software. The signal intensity (represented by the brown color) was quantified using Image-Pro software (Media Cybernetics, Silver Spring, MD). TC II-R levels were normalized to those in untreated WM9 cells (signal intensity [Int] = 1 arbitrary unit). Additional sections were incubated with secondary antibody alone as a background control.
Western Blot Analysis
NIH-OVCAR-3 cells were treated for 4 hours and 16 hours with IFN-β (500 U/mL). Cells were scraped from the tissue culture dish into 1 mL of 10 mM Tris/140 mM NaCl solution and processed in a Dounce tissue homogenizer (10 upward strokes). Total cell proteins (100 µg per sample) were separated by electrophoresis on a 7.5% sodium dodecyl sulfate-polyacrylamide gel and transferred to a nitrocellulose membrane (Bio-Rad, Hercules, CA) with the use of a wet transfer apparatus (Bio-Rad) for 90 minutes at 85 V, as described (35). The membranes were incubated in blocking buffer (1x Tris-buffered saline, 0.2% Triton 100, 0.4% bovine serum albumin [BSA], and 2% nonfat dry milk) for 2 hours at room temperature and then incubated overnight with a rabbit polyclonal TC II-R antibody (1:500 dilution in 1x Tris-buffered saline, 0.2% Triton 100, 0.4% BSA) (Bellur Seetharam, Medical College of Wisconsin, Milwaukee). After washing in 1x Tris-buffered saline, 0.2% Triton 100, 0.4% BSA, membranes were incubated with horseradish peroxidase-conjugated goat anti-rabbit-immunoglobulin (1:10 000 dilution) (Zymed, San Francisco, CA) for 30 minutes at room temperature. The protein bands were visualized by enhanced chemilu-minescence (NEN Life Sciences, Boston, MA). Antibodies against actin (diluted 1:4000) (Sigma Chemical) were used to ensure equal loading.
[57Co]Cobalamin Tumor Imaging
NIH-OVCAR-3 cells (4 × 10⁶) were injected subcutaneously into the flanks of nude mice. Tumors were grown to a diameter of approximately 8 mm (approximately 2 weeks). The mice were then injected subcutaneously with 105 U IFN-β daily beginning on day −3 and continuing through day 5. On day 0, mice received 0.4 µCi of [57Co]cobalamin by mouth. The mice were anesthetized (with 0.3 mL avertin injected intraperitoneally) and imaged on days 4 and 6 by placing them directly on a phosphor screen. Images were processed with OptiQuant image analysis software (Cyclone; Packard Instrument Co., Meriden, CT).
Ribonuclease Protection Assay
The reagents for the ribonuclease protection assay (RPA) were the human apoptosis multiprobe template sets hAPO-1c and hAPO-3c from BD Pharmingen (San Diego, CA); ATP, GTP, CTP, UTP, and T7 RNase from GIBCO BRL/Life Technologies (Grand Island, NY); RNasin from Promega (Madison, WI); DNase I and RNase from Roche (Indianapolis, IN); [α-32P]UTP from ICN Biomedicals (Costa Mesa, CA); and RNAzol from Tel-test (Friendswood, TX). Total RNA (10 µg), isolated from NIH-OVCAR-3 cells using RNAzol according to manufacturer’s specifications, was separated on 5% native (non-denaturing polyacrylamide/urea) gels. RPA was performed according to the manufacturer’s instructions (BD Pharmingen). For a positive control, a multiprobe RNA (provided by the manufacturer) was resolved after labeling. The free probe migration pattern was identical to that provided in the package insert. For a negative control, yeast transfer RNA was hybridized to probe; no bands were visualized following resolution (data not shown).
Caspase-8 Activity Assay
NIH-OVCAR-3 cells were grown to 80% confluency and treated with NO-Cbl (10 µM). At various times, cells were detached with trypsin, counted, and lysed according to the manufacturer’s recommendations (ApoAlert Caspase-8 Assay, Clontech, Palo Alto, CA). In this assay, if activated caspase-8 is present in the cell lysate, it will cleave the chromophore from the substrate (a synthetic peptide with the sequence IETD conjugated to the chromophore 7-amino-4-trifluoromethyl coumarin [AFC]), which can then be detected fluorometrically with a Wallac 1420 multilabel counter (Perkin Elmer, Gaithersburg, MD) using a 400-nm excitation filter and a 505-nm emission filter. Caspase-8 activity is depicted in fluorescence units. Three controls were used in each experiment. These include untreated cells (negative control), induced cells treated with a caspase-8 inhibitor (provided in the kit), and a positive control for caspase-8 induction (provided in the kit). All controls were performed according to the manufacturer’s recommended protocol.
Annexin V/TUNEL Staining
NIH-OVCAR-3 cells were cultured for 48 hours and exposed to various treatments (control, NO-Cbl, IFN-β, NO-Cbl + IFN-β). Apoptotic cells were stained for annexin V-fluorescein isothio-cyanate and propidium iodide using a commercially available kit (BD Pharmingen), and apoptotic cells were detected by flow cytometry using FACScan and BD CellQuest software (Becton Dickinson, San Jose, CA).
Apoptotic cells in NIH-OVCAR-3 xenograft tissue sections were detected by TUNEL (terminal deoxynucleotidyltransferase-mediated dUTP-biotin nick end-labeling) using a commercially available kit (Roche). The cells were processed according to the manufacturer’s recommended protocol. Because TUNEL staining varies between tissue type, the untreated tissue served as an internal negative control.
JC-1 Mitochondrial Membrane Potential Imaging
NIH-OVCAR-3 cells were grown to 80% confluence in 60-mm dishes. Cells were washed in PBS, placed in serum-free medium containing 5 µg/mL of the mitochondrial binding dye JC-1 (5,5′,6,6′-tetrachloro-1,1′,3,3′-tetraethyl benzimidazolyl carbocyanine iodide; Molecular Probes, Eugene, OR) and incubated for 30 minutes at 37 °C. Cells were washed with PBS and placed in complete medium containing NO-Cbl (20 µM) or sodium nitroprusside (SNP, 200–1000 µM; Alexis Biochemicals, San Diego, CA) for 4 hours. SNP is an NO donor that causes mitochondrial damage and serves as a positive control. To prepare the cells for imaging, the majority of the medium was removed and a 24 × 40-mm coverslip was dropped into the center of the dish. Confocal images were collected with a Leica TCS-SP laser scanning confocal microscope (Leica) and an oil immersion HCX PL APO 100x, 1.4 numerical aperture (NA) objective. The JC-1 treated cells were excited at 488 nm, and emission was recorded simultaneously, with the slit of the first photomultiplier tube selecting the wavelengths 510–550 nm and the second slit selecting 580–680 nm. Images were scanned at 1024 × 1024 × 8 bits per pixel and averaged four times. The confocal pinhole was set to 1 Airy unit, and the voltage to the photomultiplier tubes of each channel was maintained at equal values for each channel. Illumination was limited to periods of acquisition. In this way, the images collected at each wavelength were taken from exactly the same focal plane and represented the amount of monomeric and J-aggregate JC-1 fluorescence. JC-1 exists as a green fluorescent monomer when mitochondrial membrane potential has been disrupted. When mitochondria retain normal membrane potential, JC-1 aggregates to form a red fluorescent species. Untreated cells (data not shown) were used as a negative control and generated images identical to NO-Cbl treated cells (20–200 µM).
4-Amino-5-Methylamino-2′,7′-Difluorofluorescein Imaging to Detect Intracellular Nitric Oxide Release
NIH-OVCAR-3 cells were grown to 80% confluency in 60-mm dishes and pretreated with 500 µM of the nitric oxide synthase (NOS) inhibitor NG-monomethyl-l-arginine monoacetate (L-NMMA, Alexis Biochemicals) for 1 hour. Cells were washed twice with PBS, placed in serum-free medium containing 5 µM DAF-FM diacetate (4-amino-5-methylamino-2′,7′-difluoro-fluorescein; Molecular Probes) and 15 µM L-NMMA and incubated for 30 minutes at 37 °C. Cells were washed with PBS and placed in complete medium containing 100 µM NO-Cbl and 500 µM L-NMMA. Time-lapse images of DAF-FM fluorescence, which was generated as a result of NO release, were collected on a Leica DMIRB inverted epifluorescence microscope (Leica) equipped with a dry N Plan x20, 0.4 NA objective and a Leica incubation system, which provides digital control of temperature, humidity, and CO2. The microscope is also equipped with a computer-controlled Lambda-10 motorized optical filter wheel and shutter (Sutter Instruments, Huntley, IL) for fluorescence excitation. DAF-FM was excited at 480 nm, and the 527-nm emission image was captured with a CoolSnap cooled charge-coupled device camera (Roper Scientific, Tucson, AZ) running at 10 MHz, with 100-ms light exposures every 6 minutes for 5 hours. Untreated cells were processed identically as negative controls, and no fluorescence was detected even after 24 hours (data not shown).
Statistical Analysis
Median effect analysis was used to calculate drug interactions between NO-Cbl and IFN-β (36). Unless otherwise stated, results are expressed as means with 95% confidence intervals (95% CIs). Differences in mean tumor volume between groups were compared using the unpaired two-tailed Student’s t test, using a pooled estimator of variance. Statistical significance was computed using Sigma Plot 4.0 (SPSS, Chicago, IL).
RESULTS
Antitumor Effects of NO-Cbl, IFN-β, and the Combination In Vitro and In Vivo
To test our hypothesis that NO-Cbl would have greater anti-cellular effects against malignant cells than against normal cells, we measured the antiproliferative efficacy of NO-Cbl in 22 human tumor cell lines of solid and hematologic origin and two normal cell lines (Table 1). We used the SRB antiproliferative assay, which is used by the National Cancer Institute (NCI) to evaluate new chemotherapeutic agents. Hematologic tumors were most sensitive to NO-Cbl, with ID50s (the dose that inhibits growth by 50%) of some leukemia cell lines as low as 2 µM. Of cell lines derived from solid tumors, NIH-OVCAR-3 was the most sensitive to NO-Cbl and had the lowest ID50, 8.0 µM (95% CI = 7.9 to 8.1). The MCF-7 (derived from a breast cancer) and WM9 (derived from a melanoma) cell lines had ID50s of 16.0 µM (95% CI = 15.9 to 16.1) and 22.0 µM (95% CI = 21.9 to 22.1), respectively. NO-Cbl had potent antiproliferative activity in over 20 different malignant cell lines.
Nonmalignant cell lines were relatively resistant to NO-Cbl, with ID50s ranging from approximately 50 to 135 µM. The NCI Developmental Therapeutics Program independently tested NO-Cbl in a 60-cell line screen and obtained results similar to ours (our personal communication). Antiproliferative effects were also measured by the metabolic assay MTT and by direct cell counting using a Coulter counter (data not shown). Both assays yielded ID50 values for each cell line examined that were comparable to those obtained by the SRB assay.
We used median effect analysis to analyze drug interactions between NO-Cbl and IFN-β (36). Combination treatment resulted in synergistic antiproliferative activity in several different cell lines (Fig. 1). Synergy between NO-Cbl and IFN-β has subsequently been observed in approximately 50% of all cell lines tested to date (data not shown). Because the highest dose of the combination treatment had the highest antiproliferative effects in NIH-OVCAR-3 but not in the MCF-7 and WM9 cell lines, we hypothesized that the sensitivity of a given cell line to NO-Cbl may depend on its basal expression of TC II-R. We further hypothesized that treatment with IFN-β would result in increased cellular uptake of NO-Cbl as a result of increased TC II-R expression.
Fig. 1.
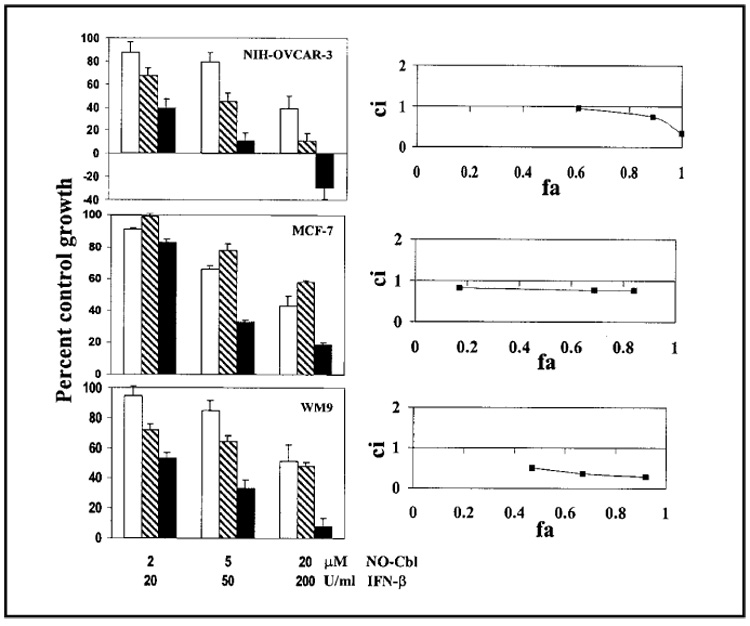
Effects of nitrosylcobalamin (NO-Cbl), interferon β (IFN-β), or the combination of both agents on the proliferation of the ovarian cancer cell line NIH-OVCAR-3, the breast cancer cell line MCF-7, and the melanoma cell line WM9. (Left panels) Cells were treated with NO-Cbl (open bars), IFN-β (hatched bars), or the combination of the two (solid bars) for 5 days, and growth was measured by the colorimetric sulforhodamine B assay (33,34). Data points represent the mean of eight replicates. Data are expressed as mean percentage of control with 95% confidence intervals. (Right panels) Synergy between NO-Cbl and IFN-β was determined by median effect analysis (36). The y-axis shows the combination index (ci). A ci greater than 1 indicates antagonism between NO-Cbl and IFN-β, a ci equal to 1 indicates additivity, and a ci less than 1 indicates synergy. The x-axis shows the fraction affected (fa). An fa of 0 corresponds to 100% of control growth, whereas an fa of 1 corresponds to 0% of control growth.
We focused our studies on NIH-OVCAR-3 cells because this cell line was derived from a solid tumor and, of the lines we tested, was most sensitive to NO-Cbl and to the combination of NO-Cbl and IFN-β. To test drug activity in vivo, subcutaneous NIH-OVCAR-3 xenografts were established in nude mice. Mice were treated daily with NO-Cbl, IFN-β, or both, beginning 7 days after cell inoculation, at which time tumors were both visible and palpable (Fig. 2, A). Untreated control tumors grew unimpeded. After 54 days, the tumors from mice treated with NO-Cbl were 88.7% (95% CI = 84.3% to 90.2%; P = .004) smaller than the control tumors, and tumors from mice treated with IFN-β treatment were 75.4% (95% CI = 54.4% to 82.2%; P = .009) smaller than the control tumors. This degree of inhibition was similar to that observed in a previous study (37). Because the combination NO-Cbl and IFN-β therapy resulted in complete tumor eradication by day 18, combination treatment was discontinued on day 25. There was no recurrence of tumors in the combination group, even after 12 weeks. The elimination of the tumors in vivo using combination NO-Cbl and IFN-β therapy is consistent with the antiproliferative synergy observed in vitro.
Fig. 2.

Effect of nitrosylcobalamin (NO-Cbl), interferon β (IFN-β), or the combination of both agents on ovarian cancer NIH-OVCAR-3 xenografts. A) NCR male athymic nude (nu/nu) mice (n = 8 per group) were injected subcutaneously with 2 × 10⁶ NIH-OVCAR-3 cells. Daily drug treatments of control (phosphate-buffered saline), NO-Cbl (100 mg/kg, intraperitoneally), human IFN-β (105 U/day, subcutaneously), or the combination began on day 7 after injection of the cells. Tumor volume was measured three times per week. Points represent the mean tumor volume (in cubic mm) ± 95% confidence intervals. B) NIH-OVCAR-3 tumors were isolated from an additional series of mice after 10 days. Tumors were processed, sectioned, and stained to visualize apoptotic cells. Apoptotic cells were detected by terminal deoxynucleotidyltransferase-mediated dUTP-biotin nick end labeling. Representative sections from control (untreated), NO-Cbl treated, IFN-β treated, and NO-Cbl and IFN-β treated (NO-Cbl + IFN-β) are shown. Light areas identify cells undergoing apoptosis.
To determine whether NO-Cbl, IFN-β, or the combination therapy was cytostatic or cytotoxic, tumor sections were evaluated for apoptosis by TUNEL staining (Fig. 2, B). Tumors harvested on day 14 (after 7 days of treatment) from NO-Cbl-treated or IFN-β-treated mice demonstrated scattered fluorescence. Tumors harvested from control mice demonstrated only rare fluorescence. Tumors from mice receiving the combination NO-Cbl and IFN-β therapy had the greatest fraction of fluorescent cells. Tumors from NO-Cbl-treated mice were more necrotic than control tumors, suggesting that NO-Cbl was more cytotoxic than cytostatic. Histologic evaluation of the heart, spleen, liver, pancreas, kidneys, and lungs after 2 months of treatment showed no differences between NO-Cbl-treated and control mice.
Effect of IFN-β on TC II-R expression
One possible explanation for the synergistic effects of the combination of NO-Cbl and IFN-β therapy is that IFN-β increased TC II-R expression. To test this possibility, we assessed TC II-R expression by immunohistochemical analysis and measured [57Co]cobalamin uptake in nude mice with NIH-OVCAR-3 xenograft tumors. For these studies, we included WM9 melanoma xenografts because WM9 cells were more resistant than NIH-OVCAR-3 cells to NO-Cbl in vitro.
NIH-OVCAR-3 and WM9 cells were injected subcutaneously in nude mice and grown for 3 days. IFN-β (105 U, injected subcutaneously) was then administered for 3 days, at which time tumors were harvested and stained with anti-TC II-R antibodies. Basal levels of TC II-R were higher in NIH-OVCAR-3 tumor sections than in WM9 tumor sections (Fig. 3, A). After IFN-β treatment, TC II-R expression increased from a signal intensity value of 6.5 arbitrary units (95% CI = 5.6 to 7.3) to 18.2 arbitrary units (95% CI = 16.1 to 19.9) in NIH-OVCAR-3 tumor sections and from 1.0 to 3.7 in WM9 tumor sections. TC II-R levels were normalized to untreated WM9 cells. Thus, IFN-β may increase the sensitivity of tumors, such as the relatively resistant WM9 cell line, to NO-Cbl via its induction of TC II-R expression.
Fig. 3.

Biochemical analysis of transcobalamin II receptor (TC II-R) expression. A) Established xenograft tumors of ovarian cancer NIH-OVCAR-3 cells (upper panels) and melanoma WM9 cells (lower panels) were treated with and without 105 U interferon-β (IFN-β) subcutaneously (s.c.) for 3 days. Sections from tumors, isolated after 3 days, were analyzed for the presence of TC II-R by immunohistochemistry with a rabbit polyclonal anti-TC II-R antibody. The signal intensity (brown color) was quantified and TC II-R levels were normalized to those in untreated WM9 cells (signal intensity [Int] = 1). The relative intensities of the immunostaining are shown for each panel. B) Expression of TC II-R in NIH-OVCAR-3 cells treated with IFN-β in vitro for 4 hours and for 16 hours was determined by western blot analysis with a rabbit polyclonal anti-TC II-R antibody. TC II-R was detected as a monomer of 62 kd and a corresponding dimer of 124 kd. Lysates of rat liver and kidney are shown as positive controls. Only the 62-kd band was detected in the rat samples because of the presence of the reducing agent dithiothreitol (DTT) in the lysis buffer. The blot was stripped and reprobed with an anti-actin antibody to show that equivalent amounts of lysates were loaded in each lane.
We confirmed that IFN-β increased TC II-R expression in vitro by western blot analysis. After 16 hours of IFN-β treatment, NIH-OVCAR-3 cell lysates had increased levels of the TC II-R, which was identified as a monomer at 62 kd and a corresponding dimer at 124 kd (35,38–40) (Fig. 3, B).
We next devised a [57Co]cobalamin uptake experiment to monitor the uptake of [57Co]cobalamin by tumor cells relative to normal tissues and to determine whether IFN-β could modulate that uptake. NIH-OVCAR-3 tumors were established in both flanks of nude mice, allowed to reach 8 mm in diameter (approximately 2 weeks), and then treated with IFN-β for 3 days. Three days later (on day 0), mice were given [57Co]cobalamin (0.4 µCi) by mouth. IFN-β treatment was continued for an additional 5 days. When the mice were imaged on day 4 (and at earlier time points, data not shown), radioactivity was concentrated in the liver and kidneys, although the tumors could still be visualized (Fig. 4). By day 6, the highest specific activity of [57Co]cobalamin was seen in the tumors of the mice treated with IFN-β.
Fig. 4.

Effect of interferon β (IFN-β) on the uptake of [57Co]cobalamin in NIH-OVCAR-3 xenografts. NIH-OVCAR-3 cells were injected in the flanks of nude mice and grown for 14 days before the administration of [57Co]cobalamin (day 0). IFN-β (105 U) was administered subcutaneously from days −3 through 5. The biodistribution of the [57Co]cobalamin was examined on days 4 and 6 by placing the anesthetized mice on a phosphor imaging screen and collecting images with the use of the OptiQuant image analysis software. Areas of low [57Co]cobalamin signal intensity are identified by the blue color, and areas of high signal intensity are identified by the red color.
To quantify the radioactivity, the tumors were harvested and the disintegrations per minute (dpm) per gram tissue for both tumor and normal muscle were determined. Each value was expressed as a ratio of tumor dpm to muscle dpm to calculate the uptake by tumor cells relative to normal tissue. The tumor: muscle ratio was 2.03 (95% CI = 1.13 to 2.93) and 2.83 (95% CI = 1.33 to 4.34) for control mice, compared with 4.73 (95% CI = 3.18 to 6.28) and 8.50 (95% CI = 5.79 to 11.21) for IFN-β-treated mice on days 4 and 6, respectively. The concentration of [57Co]cobalamin in the tumors of IFN-β-treated mice was statistically significantly greater than the concentration in tumors of control mice on both day 4 (P<.001) and day 6 (P<.001). Thus, tumor cells take up more cobalamin than normal tissue, and IFN-β treatment increases the tumor uptake of cobalamin. The increase in uptake corresponds with the increased TC II-R immunostaining in the tumors of mice treated with IFN-β (Fig. 3, A).
Mechanism of NO-Cbl-Initiated Apoptosis
Because IFN-β increased TC II-R expression and the NO-Cbl and IFN-β combination induced apoptosis and tumor eradication, we next investigated the mechanism of cell death by performing annexin V staining of NIH-OVCAR-3 cells treated in vitro with NO-Cbl, IFN-β, or the combination of NO-Cbl and IFN-β. Treatment for 48 hours with NO-Cbl (10 µM) or IFN-β (20 U/mL) induced 14% (95% CI = 3% to 25%) and 9% (95% CI = −1% to 19%) annexin V-positive cells, respectively. The combination of NO-Cbl and IFN-β induced 35% (95% CI = 25% to 45%) annexin V-positive cells, consistent with the increase in fluorescent cells detected by TUNEL staining in tumor sections (Fig. 2, B). For a negative control, we used a single agent, interleukin 2 (20–250 U/mL), which resulted in annexin V-positive cell staining similar to untreated cells after 48 hours of treatment, demonstrating a cytokine-specific cytotoxicity.
Ribonuclease protection assays were performed to assess induction of the components of the extrinsic apoptotic pathway. In vitro, NIH-OVCAR-3 cells were treated with NO-Cbl, IFN-β, or the combination of NO-Cbl and IFN-β for various lengths of time (Fig. 5, A). NO-Cbl, as a single agent, induced mRNAs for FasL, DR3, DR4, DR5, and tumor necrosis factor-related apoptosis-inducing ligand (TRAIL). In addition, NO-Cbl increased mRNA levels of caspase-8, an initiator caspase, as well as caspase-3, caspase-6, and caspase-7, the effector caspases. Combination treatments increased mRNA of several death-associated genes including Fas, DR5, DR4, TRAIL, caspase-8, caspase-3, and caspase-7. Hence, transcription of multiple death-associated genes is induced by NO-Cbl and combination drug treatment.
Fig. 5.

Effect of nitrosylcobalamin (NO-Cbl) on the induction of apoptosis-related mRNA. A) RNA from NIH-OVCAR-3 cells that were left untreated (U), treated with NO-Cbl (N), interferon β (IFN-β) (β), or treated with the combination (+) for either 4 hours or 8 hours was isolated and used in a ribonuclease protection assay to assess mRNA induction of multiple genes associated with apoptosis. Specific induced mRNAs for death-associated genes are indicated by arrows. DR3 = death receptor 3; TRAIL = tumor necrosis factor-related apoptosis-inducing ligand; TRADD = tumor necrosis factor receptor associated death domain; TNFRp55 = tumor necrosis factor receptor p55 chain; L32 = 50S ribosomal house keeping gene; GAPDH = glyceraldehyde-3-phosphate dehydrogenase. B) Caspase-8 activity was measured in NIH-OVCAR-3 cells treated with NO-Cbl (10 µM) for various times (0–4 h). Equal amounts of total cell protein were assayed for caspase-8 activity. Enzyme activity is expressed in total fluorescence units per each time point. Points represent mean caspase-8 activity ± 95% confidence intervals of triplicate samples.
Caspase-8 acts immediately downstream of the death-inducing signaling complex (DISC) that forms at the cytoplasmic domain of the tumor necrosis factor (TNF) family of death receptors. Because caspase-8 mRNA levels were increased in cells treated with NO-Cbl, we determined whether there was a corresponding increase in caspase-8 activity. NIH-OVCAR-3 cells treated with NO-Cbl showed a time-dependent increase in caspase-8 activity, with maximal caspase-8 enzymatic activity observed at 2 hours (Fig. 5, B). This result implies that NO-Cbl activates the extrinsic apoptotic pathway.
To determine whether NO-Cbl also induced apoptosis through the mitochondrial-dependent intrinsic pathway (41–43), we next examined the effect of NO-Cbl on mitochondrial membrane potential (ΨΔm) using the indicator dye JC-1. SNP, an NO donor that induces mitochondrial damage (44) as a result of peroxynitrite formation (45), was used as a positive control. A 4-hour exposure to SNP (200 µM) reduced the mitochondrial membrane potential (ΨΔm), whereas a 4-hour exposure to NO-Cbl (20–200 µM) did not (Fig. 6). This result suggests that the mitochondrial-dependent intrinsic pathway is not involved in NO-Cbl-induced apoptosis at these doses.
Fig. 6.

Effect of nitrosylcobalamin (NO-Cbl) on mitochondrial membrane potentials. NIH-OVCAR-3 cells were incubated with the mitochondrial membrane binding dye JC-1 for 30 minutes in serum-free medium. The cells were then placed in complete medium and treated with either sodium nitroprusside (SNP; 200 µM) as a positive control or NO-Cbl (200 µM) for 4 hours. The cells were imaged with a laser scanning confocal microscope. Functional mitochondria that have an intact transmembrane potential (ΨΔm) stain red, whereas mitochondria that have lost transmembrane potential stain green. Compared with NO-Cbl treatment, SNP treatment caused a dramatic loss of ΨΔm, indicated by a loss of red signal.
Time-Lapse Analysis of NO-Cbl Release
We then examined whether NO was released from the Cbl carrier after NO-Cbl was internalized by tumor cells. We used DAF-FM, a dye that fluoresces only when bound to NO, which serves as a marker of NO release as it dissociates from NO-Cbl. A time-lapse analysis was performed to provide a visual assessment of the kinetics of NO release (Fig. 7). When bound to NO, the dye fluoresces for several hours. NO is released progressively from NO-Cbl and accumulated within the cells during the observation period. No signal was observed in untreated controls. This result suggests that NO is released from the Cbl carrier after the NO-Cbl is internalized.
Fig. 7.
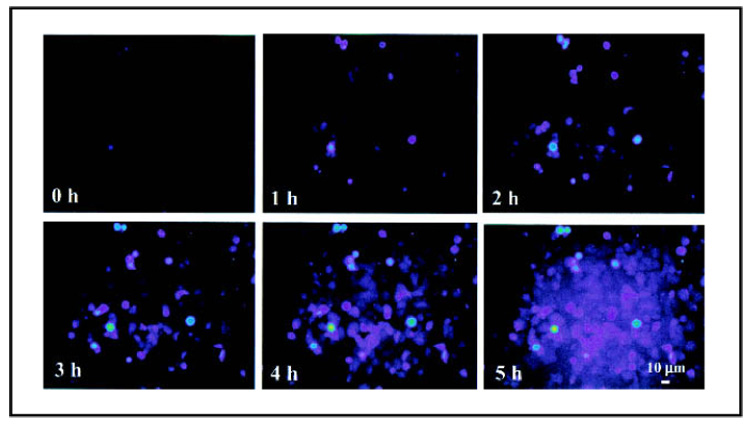
Intracellular release of nitric oxide (NO) from NO-Cbl. NIH-OVCAR-3 cells were incubated with inducible NO synthase (iNOS) inhibitor NG-monomethyl-l-arginine monoacetate (L-NMMA) (500 µM) for 1 hour to inhibit endogenous iNOS activity. The cells then were incubated with 5 µM DAF-FM diacetate (4-amino-5-methylamino-2′,7′-difluorofluorescein) for 30 minutes. DAF-FM is a dye that diffuses into cells and is trapped there after esterases remove its terminal acetate residues. DAF-FM is strongly fluorescent when it binds NO. The cells were washed, placed in complete medium, and treated with NO-Cbl (100 µM) and L-NMMA (500 µM). Time lapse images were obtained within a custom incubator by confocal fluorescent microscopy. Images were collected every 6 minutes for 5 hours. Color reflects the intensity of the NO signal, which ranges from moderate intensity (violet) to high intensity (green-yellow).
DISCUSSION
In this study, we showed that NO-Cbl inhibited tumor growth in vivo by activating the extrinsic apoptotic pathway of cell death and that administering NO-Cbl and IFN-β had synergistic antiproliferative effects. The use of vitamin B12 as a carrier to deliver nitric oxide is novel. Initially, vitamin B12 was proposed for use as a scavenger and cytoprotective agent to bind and inactivate NO at neutral pH (46–49). However, we decided that an acid-labile NO-Cbl bond could be used to a pharmacologic advantage (24). This activation mechanism, whereby NO is released at acidic pH, occurs in the lysosomes only on receptor-mediated endocytosis of the drug from the plasma. Thus, the premature release of NO from the Cbl carrier in the bloodstream is prevented.
NO can cause both apoptosis and necrosis (27), making it a good candidate for antitumor therapy. Whether NO causes apoptosis or necrosis is a function of the concentration of NO delivered, the site of delivery, and the kinetics of NO release from the donor. The xenograft studies in this article suggest that NO clearly induced apoptosis (presence of TUNEL positive cells) and necrosis. RNA protection assay analysis demonstrated that a variety of apoptosis-associated genes were induced by NO-Cbl. NO-induced apoptosis has been examined in several studies (50–55). Different NO donors appear to activate different apoptotic pathways. For example, S-nitroso-l-acetyl-dl-penicillamine (SNAP) and diethylenetriamine-NO adduct (NOC-18) both induce mitochondrial damage, characterized by a decrease in mitochondrial membrane potential, cytochrome c leakage, and caspase-9 activation; these are components of the intrinsic pathway of apoptosis (50–55). Other NO donors, such as glycerol trinitrate, appear to induce FasL/CD95L and TRAIL/APO2L, ligands that activate the extrinsic pathway of apoptosis, resulting in activation of caspase-8 (56). A combination of the NO donor SNP (1000 µM) and TRAIL increased apoptosis of human colorectal carcinoma (44). NO-Cbl appears to induce apoptosis via activation of death receptors through the extrinsic pathway rather than by inducing mitochondrial damage characteristic of the intrinsic pathway. It should be emphasized that NO-Cbl can induce apoptosis at much lower concentrations (8-70 µM) than other NO donors. This observation suggests that higher concentrations of NO may predominantly induce mitochondrial-dependent apoptosis, whereas lower concentrations of NO may induce the death-receptor pathway of apoptosis. However, because the kinetics of NO release vary widely depending on the NO donor, it is possible that a high concentration of an NO donor with slow kinetics could activate the extrinsic pathway of apoptosis.
We propose that the combination of NO-Cbl and IFN-β was synergistic by increasing TC II-R expression and NO-Cbl uptake. However, there may be an alternative explanation for the synergistic anticellular effects observed with the combination of NO-Cbl and IFN-β therapy. Aside from increasing TC II-R expression, enhanced cell death may result from an increase in endogenous NO production after IFN-β treatment. IFN-γ induces expression of inducible NO synthase (iNOS) (29). In iNOS knockout mice, transfected tumor cells that secreted IFN-β grew aggressively, whereas such tumors in wild-type mice were suppressed (57). This finding suggests that IFN-β mediated induction of NO in host tissues may provide additional antitumor activity. We found that IFN-β can induce NO synthesis in tumor cells and that this induction was blocked with the specific inhibitor L-NMMA (data not shown). This observation suggests that endogenous NO production combined with exogenous NO delivery may increase apoptosis. The question remains: Is NO-Cbl-induced death caused by massive nitrosylation of multiple cellular targets, or is there a particularly sensitive trigger that initiates apoptosis? This topic remains under active investigation.
Finally, the increased expression of TC II-R by IFN-β is an interesting finding that suggests that TC II-R may be related to a family of cell surface markers such as human leukocyte antigens HLA I and HLA II, β2-microglobulin, and carcinoembryonic antigen, all of which contain immunoglobulin structural domains (28,29,58). The molecular mechanism of how IFN-β modulates TC II-R expression (translational or transcriptional) is not clear at the moment and must wait for elucidation until the complete structure of the TC II-R gene is understood.
NOTES
Supported by Ethicon Endosurgery, CCF Innovations, the American Cancer Society, and the Taussig Cancer Center Bridge Grant Program. B. Seetharam was supported by grant DK50052 from the National Institutes of Health, Department of Health and Human Services.
We thank Timothy P. Maloy (The Cleveland Clinic Foundation) for his assistance with the JC-1 imaging experiments and his expertise in the digital processing of the figures.
REFERENCES
- 1.Rickes EL, Brink NG, Koniuszy FR, Wood TR, Folkers K. Crystalline vitamin B12. Science. 1948;107:396–397. doi: 10.1126/science.107.2781.396. [DOI] [PubMed] [Google Scholar]
- 2.Linnell JC, Matthews DM. Cobalamin metabolism and its clinical aspects. Clin Sci (Colch) 1984;66:113–121. doi: 10.1042/cs0660113. [DOI] [PubMed] [Google Scholar]
- 3.Seetharam B, Bose S, Li N. Cellular import of cobalamin (vitamin B-12) J Nutr. 1999;129:1761–1764. doi: 10.1093/jn/129.10.1761. [DOI] [PubMed] [Google Scholar]
- 4.Weir DG, Scott JM. Vitamin B12 cobalamin. In: Shils ME, Olson JA, Shike M, Ross AC, editors. Modern nutrition in health and disease. Philadelphia (PA): Lippincott Williams, and Wilkins; 1999. pp. 659–728. [Google Scholar]
- 5.Seetharam B, Li N. Transcobalamin II and its cell surface receptor. Vitam Horm. 2000;59:337–366. doi: 10.1016/s0083-6729(00)59012-8. [DOI] [PubMed] [Google Scholar]
- 6.Huennekens FM, DiGirolamo PM, Fujii K, Jacobsen DW, Vitols KS. B12-dependent methionine synthetase as a potential target for cancer chemotherapy. Adv Enzyme Regul. 1976;14:187–205. doi: 10.1016/0065-2571(76)90013-3. [DOI] [PubMed] [Google Scholar]
- 7.Chanarin I. Megaloblastic anaemia, cobalamin, and folate. J Clin Pathol. 1987;40:978–984. doi: 10.1136/jcp.40.9.978. [DOI] [PMC free article] [PubMed] [Google Scholar]
- 8.Chanarin I. Nutritional aspects of hematological disorders. In: Shils ME, Olson JA, Shike M, Ross AC, editors. Modern nutrition in health and disease. Philadelphia (PA): Lippincott Williams, and Wilkins; 1999. pp. 214–287. [Google Scholar]
- 9.Fenton WA, Rosenberg LE. Inherited disorders of cobalamin transport and metabolism. In: Scriver CR, Beaudet A, Sly W, Valle D, Childs B, Kinzler K, et al., editors. The metabolic and molecular bases of inherited disease. New York (NY): McGraw-Hill; 2000. pp. 711–758. [Google Scholar]
- 10.Oleson JJ, Little PA. Effect of pteroylglutamic acid and vitamin B12 on growth of Rous tumor implants. Proc Soc Exp Biol (NY) 1949;71:226–227. doi: 10.3181/00379727-71-17143. [DOI] [PubMed] [Google Scholar]
- 11.Flodh H, Ullberg S. Accumulation of labelled vitamin B12 in some transplanted tumours. Int J Cancer. 1968;3:694–699. doi: 10.1002/ijc.2910030518. [DOI] [PubMed] [Google Scholar]
- 12.Cooperman JM, Luhby AL, Teller DN, Marley JF. Distribution of radio-active and nonradioactive vitamin B12 in the dog. J Biol Chem. 1960;235:191–194. [PubMed] [Google Scholar]
- 13.Collins DA, Hogenkamp HP. Transcobalamin II receptor imaging via radiolabeled diethylene-triaminepentaacetate cobalamin analogs. J Nucl Med. 1997;38:717–723. [PubMed] [Google Scholar]
- 14.Collins DA, Hogenkamp HP, O’Connor MK, Naylor S, Benson LM, Hardyman TJ, et al. Biodistribution of radiolabeled adenosylcobalamin in patients diagnosed with various malignancies. Mayo Clin Proc. 2000;75:568–580. doi: 10.4065/75.6.568. [DOI] [PubMed] [Google Scholar]
- 15.Hoffman RM. Altered methionine metabolism and transmethylation in cancer. Anticancer Res. 1985;5:1–30. [PubMed] [Google Scholar]
- 16.Fiskerstrand T, Riedel B, Ueland PM, Seetharam B, Pezacka EH, Gulati S, et al. Disruption of a regulatory system involving cobalamin distribution and function in a methionine-dependent human glioma cell line. J Biol Chem. 1998;273:20180–20184. doi: 10.1074/jbc.273.32.20180. [DOI] [PubMed] [Google Scholar]
- 17.Liteplo RG, Hipwell SE, Rosenblatt DS, Sillaots S, Lue-Shing H. Changes in cobalamin metabolism are associated with the altered methionine auxotrophy of highly growth autonomous human melanoma cells. J Cell Physiol. 1991;149:332–338. doi: 10.1002/jcp.1041490222. [DOI] [PubMed] [Google Scholar]
- 18.Hall CA, Chu RC, Begley JA. The role of transcobalamin II in the methionine dependency of human lymphocytes. Proc Soc Exp Biol Med. 1988;189:217–222. doi: 10.3181/00379727-189-42801. [DOI] [PubMed] [Google Scholar]
- 19.McLean GR, Pathare PM, Wilbur DS, Morgan AC, Woodhouse CS, Schrader JW, et al. Cobalamin analogues modulate the growth of leukemia cells in vitro. Cancer Res. 1997;57:4015–4022. [PubMed] [Google Scholar]
- 20.McLean GR, Quadros EV, Rothenberg SP, Morgan AC, Schrader JW, Ziltener HJ. Antibodies to Transcobalamin II block in vitro proliferation of leukemic cells. Blood. 1997;89:235–242. [PubMed] [Google Scholar]
- 21.McLean GR, Williams MJ, Woodhouse CS, Ziltener HJ. Transcobalamin II and in vitro proliferation of leukemic cells. Leuk Lymphoma. 1998;30:101–109. doi: 10.3109/10428199809050933. [DOI] [PubMed] [Google Scholar]
- 22.Zee-Cheng RK, Cheng CC. Delivery of anticancer drugs. Methods Find Exp Clin Pharmacol. 1989;11:439–529. [PubMed] [Google Scholar]
- 23.Duncan R. Drug-polymer conjugates: potential for improved chemotherapy. Anticancer Drugs. 1992;3:175–210. doi: 10.1097/00001813-199206000-00001. [DOI] [PubMed] [Google Scholar]
- 24.Bauer JA. Synthesis, characterization and nitric oxide release profile of nitrosylcobalamin: a potential chemotherapeutic agent. Anticancer Drugs. 1998;9:239–244. doi: 10.1097/00001813-199803000-00006. [DOI] [PubMed] [Google Scholar]
- 25.Anggard E. Nitric oxide: mediator, murderer, and medicine. Lancet. 1994;343:1199–1206. doi: 10.1016/s0140-6736(94)92405-8. [DOI] [PubMed] [Google Scholar]
- 26.Burney S, Caulfield JL, Niles JC, Wishnok JS, Tannenbaum SR. The chemistry of DNA damage from nitric oxide and peroxynitrite. Mutat Res. 1999;424:37–49. doi: 10.1016/s0027-5107(99)00006-8. [DOI] [PubMed] [Google Scholar]
- 27.Gross SS, Wolin MS. Nitric oxide: pathophysiological mechanisms. Annu Rev Physiol. 1995;57:737–769. doi: 10.1146/annurev.ph.57.030195.003513. [DOI] [PubMed] [Google Scholar]
- 28.Borden EC. Interferons. In: Holland JF, Frei EF III, Bast RC, Kufe DW, Morton DL, Weischelbaum RR, editors. Cancer medicine. Baltimore (MD): Williams & Wilkins; 1997. pp. 1199–1212. [Google Scholar]
- 29.Stark GR, Kerr IM, Williams BR, Silverman RH, Schreiber RD. How cells respond to interferons. Ann Rev Biochem. 1998;67:227–264. doi: 10.1146/annurev.biochem.67.1.227. [DOI] [PubMed] [Google Scholar]
- 30.Greiner JW, Guadagni F, Goldstein D, Smalley RV, Borden EC, Simpson JF, et al. Intraperitoneal administration of interferon-gamma to carcinoma patients enhances expression of tumor-associated glycoprotein-72 and carcinoembryonic antigen on malignant ascites cells. J Clin Oncol. 1992;10:735–746. doi: 10.1200/JCO.1992.10.5.735. [DOI] [PubMed] [Google Scholar]
- 31.Marth C, Zeimet AG, Herold M, Brumm C, Windbichler G, Muller-Holzner E, et al. Different effects of interferons, interleukin-1 beta and tumor necrosis factor-alpha in normal (OSE) and malignant human ovarian epithelial cells. Int J Cancer. 1996;67:826–830. doi: 10.1002/(SICI)1097-0215(19960917)67:6<826::AID-IJC12>3.0.CO;2-#. [DOI] [PubMed] [Google Scholar]
- 32.Leon JA, Mesa-Tejada R, Gutierrez MC, Estabrook A, Greiner JW, Schlom J, et al. Increased surface expression and shedding of tumor associated antigens by human breast carcinoma cells treated with recombinant human interferons or phorbol ester tumor promoters. Anticancer Res. 1989;9:1639–1647. [PubMed] [Google Scholar]
- 33.Rubinstein LV, Shoemaker RH, Paull KD, Simon RM, Tosini S, Skehan P, et al. Comparison of in vitro anticancer-drug-screening data generated with a tetrazolium assay versus a protein assay against a diverse panel of human tumor cell lines. J Natl Cancer Inst. 1990;82:1113–1118. doi: 10.1093/jnci/82.13.1113. [DOI] [PubMed] [Google Scholar]
- 34.Skehan P, Storeng R, Scudiero D, Monks A, McMahon J, Vistica D, et al. New colorimetric cytotoxicity assay for anticancer-drug screening. J Natl Cancer Inst. 1990;82:1107–1112. doi: 10.1093/jnci/82.13.1107. [DOI] [PubMed] [Google Scholar]
- 35.Bose S, Seetharam B. Purification, membrane expression, and interactions of transcobalamin II receptor. Methods Enzymol. 1997;281:281–289. doi: 10.1016/s0076-6879(97)81034-8. [DOI] [PubMed] [Google Scholar]
- 36.Chou TC, Talalay P. Quantitative analysis of dose-effect relationships: the combined effects of multiple drugs or enzyme inhibitors. Adv Enzyme Regul. 1984;22:27–55. doi: 10.1016/0065-2571(84)90007-4. [DOI] [PubMed] [Google Scholar]
- 37.Lindner DJ, Borden EC. Synergistic antitumor effects of a combination of interferon and tamoxifen on estrogen receptor-positive and -negative human tumor cell lines in vivo and in vitro. J Interferon Cytokine Res. 1997;17:681–693. doi: 10.1089/jir.1997.17.681. [DOI] [PubMed] [Google Scholar]
- 38.Bose S, Komorowski R, Seetharam S, Gilfix B, Rosenblatt DS, Seetharam B. In vitro and in vivo inactivation of transcobalamin II receptor by its antiserum. J Biol Chem. 1996;271:4195–4200. doi: 10.1074/jbc.271.8.4195. [DOI] [PubMed] [Google Scholar]
- 39.Bose S, Feix J, Seetharam S, Seetharam B. Dimerization of transcobalamin II receptor. Requirement of a structurally ordered lipid bilayer. J Biol Chem. 1996;271:11718–11725. doi: 10.1074/jbc.271.20.11718. [DOI] [PubMed] [Google Scholar]
- 40.Bose S, Seetharam S, Dahms NM, Seetharam B. Bipolar functional expression of transcobalamin II receptor in human intestinal epithelial Caco-2 cells. J Biol Chem. 1997;272:3538–3543. doi: 10.1074/jbc.272.6.3538. [DOI] [PubMed] [Google Scholar]
- 41.Ashkenazi A, Dixit VM. Death receptors: signaling and modulation. Science. 1998;281:1305–1308. doi: 10.1126/science.281.5381.1305. [DOI] [PubMed] [Google Scholar]
- 42.Green DR, Reed JC. Mitochondria and apoptosis. Science. 1998;281:1309–1311. doi: 10.1126/science.281.5381.1309. [DOI] [PubMed] [Google Scholar]
- 43.Nicholson DW. From bench to clinic with apoptosis-based therapeutic agents. Nature. 2000;407:810–816. doi: 10.1038/35037747. [DOI] [PubMed] [Google Scholar]
- 44.Lee YJ, Lee KH, Kim HR, Jessup JM, Seol DW, Kim TH, et al. Sodium nitroprusside enhances TRAIL-induced apoptosis via a mitochondria-dependent pathway in human colorectal carcinoma CX-1 cells. Oncogene. 2001;20:1476–1485. doi: 10.1038/sj.onc.1204225. [DOI] [PubMed] [Google Scholar]
- 45.Aleryani S, Milo E, Kostka P. Formation of peroxynitrite during thiolmediated reduction of sodium nitroprusside. Biochim Biophys Acta. 1999;1472:181–190. doi: 10.1016/s0304-4165(99)00119-1. [DOI] [PubMed] [Google Scholar]
- 46.Brouwer M, Chamulitrat W, Ferruzzi G, Sauls DL, Weinburg JB. Nitric oxide interactions with cobalamins: biochemical and functional consequences. Blood. 1996;88:1857–1864. [PubMed] [Google Scholar]
- 47.Greenberg SS, Xie J, Zatarain JM, Kapusta DR, Miller MJ. Hydroxocobalamin (vitamin B12a) prevents and reverses endotoxin-induced hypotension and mortality in rodents: role of nitric oxide. J Pharmacol Exp Ther. 1995;273:257–265. [PubMed] [Google Scholar]
- 48.Rochelle LG, Morana SJ, Kruszyna H, Russell MA, Wilcox DE, Smith RP. Interactions between hydroxocobalamin and nitric oxide (NO): evidence for a redox reaction between NO and reduced cobalamin and reversible NO binding to oxidized cobalamin. J Pharmacol Exp Ther. 1995;275:48–52. [PubMed] [Google Scholar]
- 49.Kruszyna H, Magyar JS, Rochelle LG, Russell MA, Smith RP, Wilcox DE. Spectroscopic studies of nitric oxide (NO) interactions with cobalamins: reaction of NO with superoxocobalamin(III) likely accounts for cobalamin reversal of the biological effects of NO. J Pharmacol Exp Ther. 1998;285:665–671. [PubMed] [Google Scholar]
- 50.Bal-Price A, Borutaite V, Brown GC. Mitochondria mediate nitric oxide-induced cell death. Ann N Y Acad Sci. 1999;893:376–378. doi: 10.1111/j.1749-6632.1999.tb07859.x. [DOI] [PubMed] [Google Scholar]
- 51.Bal-Price A, Brown GC. Nitric-oxide-induced necrosis and apoptosis in PC12 cells mediated by mitochondria. J Neurochem. 2000;75:1455–1464. doi: 10.1046/j.1471-4159.2000.0751455.x. [DOI] [PubMed] [Google Scholar]
- 52.Umansky V, Ushmorov A, Ratter F, Chlichlia K, Bucur M, Lichtenauer A, et al. Nitric oxide-mediated apoptosis in human breast cancer cells requires changes in mitochondrial functions and is independent of CD95 (APO-1/Fas) Int J Oncol. 2000;16:109–117. doi: 10.3892/ijo.16.1.109. [DOI] [PubMed] [Google Scholar]
- 53.Ushmorov A, Ratter F, Lehmann V, Droge W, Schirrmacher V, Umansky V. Nitric-oxide-induced apoptosis in human leukemic lines requires mitochondrial lipid degradation and cytochrome C release. Blood. 1999;93:2342–2352. [PubMed] [Google Scholar]
- 54.Tamatani M, Ogawa S, Nunez G, Tohyama M. Growth factors prevent changes in Bcl-2 and Bax expression and neuronal apoptosis induced by nitric oxide. Cell Death Differ. 1998;5:911–919. doi: 10.1038/sj.cdd.4400439. [DOI] [PubMed] [Google Scholar]
- 55.Yabuki M, Tsutsui K, Horton AA, Yoshioka T, Utsumi K. Caspase activation and cytochrome c release during HL-60 cell apoptosis induced by a nitric oxide donor. Free Radic Res. 2000;32:507–514. doi: 10.1080/10715760000300511. [DOI] [PubMed] [Google Scholar]
- 56.Chlichlia K, Peter ME, Rocha M, Scaffidi C, Bucur M, Krammer PH, et al. Caspase activation is required for nitric oxide-mediated, CD95(APO-1/Fas)-dependent and independent apoptosis in human neoplastic lymphoid cells. Blood. 1998;91:4311–4320. [PubMed] [Google Scholar]
- 57.Wang B, Xiong Q, Shi Q, Le X, Abbruzzese JL, Xie K. Intact nitric oxide synthase II gene is required for interferon-beta-mediated suppression of growth and metastasis of pancreatic adenocarcinoma. Cancer Res. 2001;61:71–75. [PubMed] [Google Scholar]
- 58.Bates PA, Luo J, Sternberg MJ. A predicted three-dimensional structure for the carcinoembryonic antigen (CEA) FEBS Lett. 1992;301:207–214. doi: 10.1016/0014-5793(92)81249-l. [DOI] [PubMed] [Google Scholar]