

PREFACE
The National Toxicology Program (NTP) and the National Institute of Environmental Health Sciences (NIEHS) established the NTP Center for the Evaluation of Risks to Human Reproduction (CERHR) in June 1998. The purpose of the Center is to provide timely, unbiased, scientifically sound evaluations of human and experimental evidence for adverse effects on reproduction and development caused by agents to which humans may be exposed.
Genistein was selected for expert panel evaluation because of public concern for the possible health effects of human exposures. Genistein is a phytoestrogen found in some legumes, especially soybeans. Phytoestrogens are non-steroidal, estrogenic compounds that occur naturally in many plants. In plants, nearly all genistein is bound to a sugar molecule and this genistein-sugar complex is called genistin. Genistein and genistin are found in many food products, especially soy-based foods such as tofu, soy milk, and soy infant formula, and in some over-the-counter dietary supplements.
To obtain information about genistein for the CERHR evaluation, the PubMed (Medline) and Toxline databases were searched through February 2006 with genistein and its CAS RN (446-72-0), soy, soya, and relevant keywords. References were also identified from databases such as REPROTOX®, HSDB, IRIS, and DART and from the bibliographies of reports being reviewed.
This evaluation results from the effort of a 14-member panel of government and non-government scientists that culminated in a public expert panel meeting held March 15–17, 2006. This report is a product of the expert panel and is intended to (1) interpret the strength of scientific evidence that genistein is a reproductive or developmental toxicant based on data from in vitro, animal, or human studies, (2) assess the extent of human exposures to include the general public, occupational groups, and other sub-populations, (3) provide objective and scientifically thorough assessments of the scientific evidence that adverse reproductive/developmental health effects may be associated with such exposures, and (4) identify knowledge gaps to help establish research and testing priorities to reduce uncertainties and increase confidence in future evaluations. This report has been reviewed by members of the expert panel and by CERHR staff scientists. Copies have been provided to the CERHR Core Committee, which is made up of representatives of NTP-participating agencies.
This Expert Panel Report will be included in the subsequent NTP-CERHR Monograph on the Potential Human Reproductive and Developmental Effects of Genistein. This monograph will include the NTP-CERHR Brief, the Expert Panel Report, and all public comments on the Expert Panel Report. The NTP-CERHR Monograph will be made publicly available and transmitted to appropriate health and regulatory agencies.
The NTP-CERHR is headquartered at NIEHS, Research Triangle Park, NC and is staffed and administered by scientists and support personnel at NIEHS and at Sciences International, Inc., Alexandria, Virginia.
1.0 CHEMISTRY, USE, AND HUMAN EXPOSURE
1.1 Chemistry
1.1.1 Nomenclature
The Chemical Abstracts Service registry number for genistein is 446-72-0. ChemID-plus (2004) synonyms for genistein include 4′,5,7-trihydroxyisoflavone, 5,7,4′-trihydroxyisoflavone, genisterin, prunetol, and sophoricol. Isoflavones such as genistein can be conjugated to glucose or other carbohydrate moieties. Carbohydrate conjugates are generically called glycosides and glucose conjugates are called glucosides. Genistein glucoside is called genistin. The term “total genistein” is used in this report to refer to genistein aglycone and its conjugates. In some studies, genistein has been administered to humans or experimental animals to model effects of dietary soy-based foods. CERHR has produced a report specifically on soy formula that will consider effects of dietary soy products (Rozman et al., 2006). The current report will be restricted to considerations of effects of genistein itself. In some instances, studies using administration of isoflavone mixtures may be considered marginally useful in evaluating possible effects of genistein. The Expert Panel recognizes that use of a mixture of isoflavones may not adequately model the effects of genistein or of dietary soy products.
The terms “soy” and “soybean” are commonly used for the leguminous Asian plant Glycine max. Soybean is also used to designate the edible seed of this plant. In this report, the term “soy” is used as an adjective to denote products derived from the edible seed (e.g., soy milk, soy formula, soy meal) and soybean is used to refer to the edible seed itself.
1.1.2 Formula and molecular mass
The molecular formula for genistein is C15H10O5, and the molecular mass is 270.241 (Chemfinder, 2004). Structures for genistein and its derivatives are listed in Figure 1 (UK Committee on Toxicity, 2003).
Fig. 1.
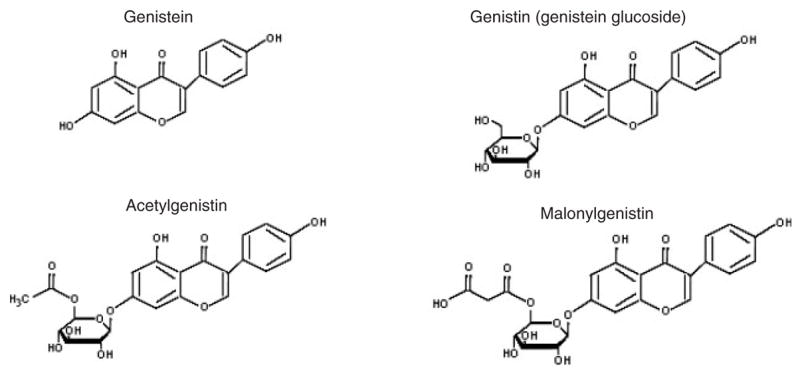
Structures of genistein and genistein glucosides.
1.1.3 Chemical and physical properties
Genistein, which occurs naturally in soybeans, is a phytoestrogen classified as an isoflavone (MAFF, 1998b; Setchell et al., 1998; UK Committee on Toxicity, 2003). In unfermented soy products, small amounts of genistein and other isoflavones (daidzein and to a lesser extent glycitein) are present as aglycones, the unconjugated forms. Most genistein and other isoflavones in unfermented soy products are conjugated to a sugar molecule to form glycosides. Glucose in glycosides can be esterified with acetyl or malonyl groups to form acetyl-or malonylglycosides (UK Committee on Toxicity, 2003). Genistein derivatives were the most abundant isoflavones found in 11 varieties of soybeans (UK Committee on Toxicity, 2003). As a result of bacterial hydrolysis during fermentation (Setchell, 1998), aglycones represent a larger portion of isoflavones in miso, tempeh, and soybean paste (ILSI, 1999; UK Committee on Toxicity, 2003). Isoflavones in cooked soybeans, texturized vegetable protein, and soy milk powder are more than 95% glycosides. Tofu, made from precipitated soy milk curd, contains isoflavones with ~20% as aglycones, and tempeh, a fermented soybean product, ~40% aglycones (reviewed by Xu et al., 2000). Table 1 compares genistein and genistin levels in some unfermented and fermented soy foods (reviewed by ILSI, 1999).
Table 1.
Genistein and Genistin Levels in Unfermented and Fermented Soy Foods
| Level, μg/g [mg/100 g] |
||
|---|---|---|
| Soy food | Genistein | Genistin |
| Soybeans, soy nuts, and soy powder | 4.6–18.2 [0.46–1.82] | 200.6–968.1 [20.06–96.81] |
| Soy milk and tofu | 1.9–13.9 [0.19–1.39] | 94.8–137.7 [9.48–13.77] |
| Miso or natto (fermented) | 38.5–229.1 [3.85–22.91] | 71.1–492.8 [7.11–49.28] |
From ILSI (1999).
Conjugation with glucose groups increases water solubility of genistein and other isoflavones, which are low molecular-weight hydrophobic compounds (UK Committee on Toxicity, 2003). Glucoside compounds are deconjugated by gut microflora to form the active aglycone compound (MAFF, 1998b) under acidic conditions (UK Committee on Toxicity, 2003) or by metabolic enzymes (Setchell et al., 1998). Therefore, exposure to a particular isoflavone (e.g., genistein) is theoretically the sum of the aglycone and respective glycoside compound concentrations converted on the basis of molecular weight. However, the aglycone is reconjugated in the gut wall leaving approximately 1–2% free aglycone to enter the portal circulation. Chen and Rogan (2004) report that isoflavones are glucuronidated and circulate primarily in conjugated form.
1.2 Use and Human Exposure
1.2.1 Production information
No information on production volume was located. Genistein is a naturally occurring product that can be extracted from soy and other beans.
1.2.2 Use and sales
Exposure to genistein and its glycoside occurs principally through foods made with soybeans and soy protein but not soy oils. Other plant parts used as food that have been shown to contain genistein include barley (Hordeum species) meal, sunflower (Helianthus) seed, clover (Trifolium species) seed, caraway (Cuminum cymicum) seed, peanut (Arachis hypogaea), kidney bean (Phaseolus vulgaris), chickpea (Cicer arietinum), pea (Pisum sativum), lentil (Lens culinaris), kudzu (Pueraria lobata) leaf and root, mungo (Vigna mungo) sprout, alfalfa (Medicago species) sprout, broccoli (Brassica oleracea italica), and cauliflower (Brassica oleracea botrytis) (Mazur, 1998). As discussed in Section 1.2.3, nearly all human genistein exposure is attributable to ingestion of soy products.
Some of the most common types of soy foods are tofu, soy milk, soy flour, textured soy protein, tempeh, and miso (FDA, 2000). Soy protein can be used in baked goods, breakfast cereals, pasta, beverages, toppings, meat, poultry, fish products, and imitation dairy products such as imitation milk and cheese (United Soybean Board, 2004). Soy is present in 60% of processed foods [not otherwise defined] available from UK supermarkets (UK Committee on Toxicity, 2003). The percentage of processed foods containing soy in the US is not known. Exposure to genistein can also occur through soy supplements marketed for the treatment of menopausal symptoms (Drugstore.com, 2004).
Based on sales of soy products, it appears that genistein glycoside exposure in the US is increasing and will continue to increase. US retail sales of soy products were $852 million in 1992 and were projected to rise to $3.714 billion in 2002 (FDA, 2000). The Soyfoods Association of America reports soy sales of $3.234 billion in 2000, $3.65 billion in 2002, and $4 billion in 2003 (Soyfoods Association of North America, 2003). Increases in soy product sales have been attributed to greater knowledge about and interest in longevity and good health by baby boomers, growth of the Asian population in the US, greater intake of Asian foods by Americans, and increased consumption of plant-based foods by young people (reviewed in FDA, 2000).
1.2.3 Occurrence and exposure
A database on isoflavone levels in soybeans and various soy foods was compiled by the US Department of Agriculture (USDA) and Iowa State University following review of the published international scientific literature (USDA, 2002). Unpublished data and analyses conducted at Iowa State University were also included in the survey. Results were presented for the most common isoflavones, genistein, daidzein, and glycitein, and their conjugates although some studies did not include glycitein values. Glucoside values were converted to free form (aglycone) values using ratios of molecular weights. Total isoflavones were calculated if values were available for daidzein and genistein, but it was noted that the reported total isoflavone values may not equal values obtained by addition of individual isoflavones. CERHR condensed and summarized the USDA-Iowa State University information in Table 2. The original USDA-Iowa State University database (http://www.nal.usda.gov/fnic/foodcomp/Data/isoflav/isoflav.html) can be referenced for additional information on data quality and total number of products evaluated. Table 2 does not include information on total isoflavone levels in soy infant formulas because the information is addressed in detail in the CERHR Expert Panel Report on Soy Formula (see CERHR web site http://cerhr.niehs.nih.gov/).
Table 2.
USDA-Iowa State University Survey of Isoflavone Levels in Food
| Content (mg/100 g)a |
||||
|---|---|---|---|---|
| Food description | Isoflavone | Meanb | Range | Confidence codec |
| Breads/crackers: 9-grain, rye | Daidzein | 0–0.01 | 0–0.01 | c |
| Genisteind | 0–0.01 | 0–0.01 | c | |
| Total isoflavone | 0–0.02 | 0–0.02 | c | |
| Sprouted, raw alfalfa seeds, with or without sprouted raw clover seeds | Daidzein | 0 | 0 | b |
| Genistein | 0 | 0 | b | |
| Glycitein | 0 | 0 | b,c | |
| Total isoflavone | 0 | 0 | b | |
| Meatless bacon | Daidzein | 2.80 | 2.80 | c |
| Genistein | 6.90 | 6.90 | c | |
| Glycitein | 2.40 | 2.40 | c | |
| Total isoflavone | 12.10 | 12.10 | c | |
| Beans: black, great northern, kidney, navy, pink, pinto, red, white, or snap green | Daidzein | 0–0.02 | 0–0.02 | c (b for kidney beans) |
| Genistein | 0–0.74 | 0–0.74 | c (b for kidney beans) | |
| Total isoflavone | 0–0.74 | 0–0.74 | c (b for kidney beans) | |
| Broadbeans (fava beans) | Daidzein | 0–0.02 | 0–0.02 | c |
| Genistein | 0–1.29 | 0–1.29 | c | |
| Total isoflavone | 0.03–1.29 | 0.03–1.29 | c | |
| Chickpeas (garbanzo beans) | Daidzein | 0.04 | 0–0.08 | c |
| Genistein | 0.06 | 0–0.12 | c | |
| Total isoflavone | 0.10 | 0–0.20 | c | |
| Raw clover sprouts | Daidzein | 0 | 0 | c |
| Genistein | 0.35 | 0.35 | c | |
| Total isoflavone | 0.35 | 0.35 | c | |
| Cowpeas, common (blackeyes, crowder, southern) | Daidzein | 0.01 | 0–0.03 | c |
| Genistein | 0.02 | 0–0.03 | c | |
| Total isoflavone | 0.03 | 0–0.06 | c | |
| Flax seed, raw | Daidzein | 0 | 0 | c |
| Genistein | 0 | 0 | c | |
| Total isoflavone | 0 | 0 | c | |
| Frichick meatless chicken nuggets, cooked or raw | Daidzein | 3.45–4.35 | 3.45–4.35 | c |
| Genistein | 7.90–9.35 | 7.90–9.35 | c | |
| Glycitein | 0.85–0.90 | 0.85–0.90 | c | |
| Total isoflavone | 12.20–14.60 | 12.20–14.60 | c | |
| Green Giant Harvest Burger, frozen or prepared | Daidzein | 2.58–2.95 | 2.58–2.95 | c |
| Genistein | 4.68–5.28 | 4.68–5.28 | c | |
| Glycitein | 0.95–1.07 | 0.95–1.07 | c | |
| Total isoflavone | 8.22–9.30 | 8.22–9.30 | c | |
| Soy infant formulas | See CERHR Report for Soy Infant Formula | |||
| Instant soy beverage powder | Daidzein | 40.07 | 29.50–70.00 | a |
| Genistein | 62.18 | 55.00–73.15 | a | |
| Glycitein | 10.90 | 10.50–11.10 | b | |
| Total isoflavone | 109.51 | 100.10–125.00 | a | |
| Kala chana seeds | Daidzein | 0 | 0 | c |
| Genistein | 0.64 | 0.64 | c | |
| Total isoflavone | 0.64 | 0.64 | c | |
| Lapacho tea | Daidzein | 0.02 | 0.02 | c |
| Genistein | 0.03 | 0.03 | c | |
| Total isoflavone | 0.05 | 0.05 | c | |
| Lentils | Daidzein | 0 | 0–0.01 | b |
| Genistein | 0 | 0–0.01 | b | |
| Total isoflavone | 0.01 | 0–0.02 | b | |
| Lima beans, cooked or raw | Daidzein | 0–0.02 | 0–0.04 | c |
| Genistein | 0–0.01 | 0–0.01 | c | |
| Total isoflavone | 0–0.03 | 0–0.05 | c | |
| Miso | Daidzein | 16.13 | 7.10–36.64 | a |
| Genistein | 24.56 | 11.70–52.39 | a | |
| Glycitein | 2.87 | 2.30–3.80 | b | |
| Total isoflavone | 42.55 | 22.70–89.20 | a | |
| Miso soup mix, dry | Daidzein | 24.93 | 20.75–29.11 | c |
| Genistein | 35.46 | 33.69–37.24 | c | |
| Total isoflavone | 60.39 | 54.44–66.35 | c | |
| Mung or mungo beans | Daidzein | 0.01 | 0–0.02 | c |
| Genistein | 0.01–0.18 | 0–0.37 | c | |
| Total isoflavone | 0.03–0.19 | 0–0.38 | c | |
| Natto (boiled and fermented soybeans) | Daidzein | 21.85 | 16.02–31.46 | a |
| Genistein | 29.04 | 21.52–42.53 | a | |
| Glycitein | 8.17 | 6.89–13.01 | a | |
| Total isoflavone | 58.93 | 46.40–86.99 | a | |
| Oil: soybean or canola and soybean | Daidzein | 0 | 0 | c (a for soybean) |
| Genistein | 0 | 0 | c (a for soybean) | |
| Glycitein | 0 | 0 | c (a for soybean) | |
| Total isoflavone | 0 | 0 | c (a for soybean) | |
| Peanuts | Daidzein | 0.03 | 0.01–0.05 | b |
| Genistein | 0.24 | 0.08–0.39 | b | |
| Total isoflavone | 0.26 | 0.13–0.39 | b | |
| Peas, split | Daidzein | 2.42 | 0–7.26 | b |
| Genistein | 0 | 0–0.01 | b | |
| Total isoflavone | 2.42 | 0–7.26 | b | |
| Pigeon peas (red gram) | Daidzein | 0.02 | 0.02 | c |
| Genistein | 0.54 | 0.54 | c | |
| Total isoflavone | 0.56 | 0.56 | c | |
| Snacks, hard granola bars | Daidzein | 0.05 | 0.05 | c |
| Genistein | 0.08 | 0.08 | c | |
| Total isoflavone | 0.13 | 0.13 | c | |
| Soybean butter | Daidzein | 0.22 | 0.22 | c |
| Genistein | 0.30 | 0.30 | c | |
| Glycitein | 0.05 | 0.05 | c | |
| Total isoflavone | 0.57 | 0.57 | c | |
| Soy cheeses: cheddar, mozzarella, parmesan | Daidzein | 1.10–11.24 | 0.20–21.10 | c |
| Genistein | 0.80–20.08 | 0.50–38.20 | c | |
| Glycitein | 3.00–4.10 | 2.70–4.10 | c | |
| Total isoflavone | 6.40–31.32 | 3.33–59.30 | c | |
| Soy drink | Daidzein | 2.41 | 0.70–4.12 | c |
| Genistein | 4.60 | 2.10–7.10 | c | |
| Total isoflavone | 7.01 | 2.80–11.22 | c | |
| Soy fiber | Daidzein | 18.80 | 16.58–21.03 | c |
| Genistein | 21.68 | 17.11–26.26 | c | |
| Glycitein | 7.90 | 7.90 | c | |
| Total isoflavone | 44.43 | 38.13–50.73 | c | |
| Soy flours | Daidzein | 57.47–99.27 | 1.65–130.92 | a |
| Genistein | 71.21–98.75 | 2.75–145.23 | a | |
| Glycitein | 7.55–20.19 | 3.95–28.28 | b | |
| Total isoflavone | 131.19–198.95 | 4.40–295.55 | a | |
| Soy hot dog or meatless canned franks | Daidzein | 1.0–3.40 | 1.0–3.40 | c |
| Genistein | 2.0–8.20 | 2.0–8.20 | c | |
| Glycitein | 0.3–3.40 | 0.3–3.40 | c | |
| Total isoflavone | 3.35–15.00 | 3.35–15.00 | c | |
| Soy meal | Daidzein | 57.47 | 57.47 | c |
| Genistein | 68.35 | 68.35 | c | |
| Total isoflavone | 125.82 | 125.82 | c | |
| Soy milk, fluid or iced | Daidzein | 1.90–4.45 | 0.34–9.84 | a (c for iced) |
| Genistein | 2.81–6.06 | 1.12–11.28 | a (c for iced) | |
| Glycitein | 0.56 | 0.36–0.86 | a (c for iced) | |
| Total isoflavone | 4.71–9.65 | 1.26–21.13 | a (c for iced) | |
| Soy milk skin or film, raw or cooked | Daidzein | 18.20–79.88 | 18.20–116.00 | c |
| Genistein | 32.50–104.80 | 32.5–131.70 | c | |
| Glycitein | 18.40 | 18.4 | c | |
| Total isoflavone | 50.70–193.88 | 50.70–266.10 | c | |
| Soy noodles | Daidzein | 0.90 | 0.90 | c |
| Genistein | 3.70 | 3.70 | c | |
| Glycitein | 3.90 | 3.90 | c | |
| Total isoflavone | 8.50 | 8.50 | c | |
| Soy protein concentrate or isolate, aqueous washed or untreated | Daidzein | 33.59–43.04 | 7.70–91.05 | b |
| Genistein | 55.59–59.62 | 27.17–105.10 | b | |
| Glycitein | 5.16–9.47 | 4.27–26.40 | c | |
| Total isoflavone | 97.43–102.07 | 46.50–199.25 | b | |
| Soy protein concentrate, alcohol extracted | Daidzein | 6.83 | 0.79–21.09 | a |
| Genistein | 5.33 | 1.29–10.73 | a | |
| Glycitein | 1.57 | 1.57 | c | |
| Total isoflavone | 12.47 | 2.08–31.82 | a | |
| Soy sauce from hydrolyzed vegetable protein or from soy and wheat (shoyu) | Daidzein | 0.10–0.93 | 0.10–1.40 | c,b |
| Genistein | 0–0.82 | 0–1.54 | c,a | |
| Glycitein | 0–0.45 | 0–0.45 | c | |
| Total isoflavone | 0.10–1.64 | 0.10–2.30 | c,b | |
| Soy-based formulas for adults | Daidzein | 0.02–0.14 | 0.02–0.14 | c |
| Genistein | 0.06–0.40 | 0.06–0.40 | c | |
| Total isoflavone | 0.08–0.54 | 0.08–0.54 | c | |
| Soybean chips | Daidzein | 26.71 | 26.71 | c |
| Genistein | 27.45 | 27.45 | c | |
| Total isoflavone | 54.16 | 54.16 | c | |
| Soybean curd cheese | Daidzein | 9.00 | 9.00 | c |
| Genistein | 19.20 | 19.20 | c | |
| Total isoflavone | 28.20 | 28.20 | c | |
| Soybean curd, fermented | Daidzein | 14.30 | 14.30 | c |
| Genistein | 22.40 | 22.40 | c | |
| Glycitein | 2.30 | 2.30 | c | |
| Total isoflavone | 39.00 | 39.00 | c | |
| Soybeans from South America or Asia, raw | Daidzein | 20.16–72.68 | 9.89–124.20 | a,b,c (origin-dependent) |
| Genistein | 31.54–72.31 | 13.00–138.24 | a,b,c (origin-dependent) | |
| Glycitein | 13.78 | 9.10–20.40 | a,b,c (origin-dependent) | |
| Total isoflavone | 59.75–144.99 | 42.54–238.89 | a,b,c (origin-dependent) | |
| Soybeans, immature seeds raw or cooked | Daidzein | 6.85–9.27 | 6.62–12.20 | c |
| Genistein | 6.94–9.84 | 5.94–14.40 | c | |
| Glycitein | 4.29 | 1.29–4.29 | c | |
| Total isoflavone | 13.79–20.42 | 13.79–26.60 | c | |
| Soybeans, mature seeds, sprouted, raw | Daidzein | 19.12 | 13.78–22.50 | c |
| Genistein | 21.60 | 11.25–30.50 | c | |
| Total isoflavone | 40.71 | 25.03–53.00 | c | |
| Soybeans, green mature seeds, raw | Daidzein | 67.79 | 54.60–75.35 | c |
| Genistein | 72.51 | 62.65–91.72 | c | |
| Glycitein | 10.88 | 6.72–19.69 | c | |
| Total isoflavone | 151.17 | 135.40–186.76 | c | |
| Soybeans, mature seeds, raw, cooked, boiled, or roasted | Daidzein | 19.12–52.20 | 0.54–91.30 | a,b,c |
| Genistein | 11.25–91.71 | 1.10–150.10 | a,b,c | |
| Glycitein | 10.88–13.36 | 0–30.70 | a,b,c | |
| Total isoflavone | 40.71–153.40 | 1.66–237.00 | a,b,c | |
| Soybean flakes, defatted or full fat | Daidzein | 36.97–48.23 | 13.92–88.04 | a,c |
| Genistein | 79.98–85.69 | 28.00–156.06 | a,c | |
| Glycitein | 1.57–14.23 | 1.57– 26.76 | c | |
| Total isoflavone | 125.82–128.99 | 50.10–244.10 | a,c | |
| Soylinks, raw or cooked | Daidzein | 0.75–1.18 | 0.75–1.18 | c |
| Genistein | 2.45–2.70 | 2.45–2.70 | c | |
| Glycitein | 0.30 | 0.30 | c | |
| Total isoflavone | 3.75–3.93 | 3.75–3.93 | c | |
| Soy paste | Daidzein | 15.03 | 3.00–27.20 | a |
| Genistein | 15.21 | 0.31–29.98 | a | |
| Glycitein | 7.70 | 7.70–7.70 | c | |
| Total isoflavone | 31.52 | 3.31–59.40 | a | |
| Spices, fenugreek seed | Daidzein | 0.01 | 0.01 | c |
| Genistein | 0.01 | 0.01 | c | |
| Total isoflavones | 0.02 | 0.02 | c | |
| Sunflower seed kernels | Daidzein | 0 | 0 | c |
| Genistein | 0 | 0 | c | |
| Total isoflavone | 0 | 0 | c | |
| Tea, green or jasmine | Daidzein | 0.01–0.01 | 0.01–0.01 | c |
| Genistein | 0.03–0.04 | 0.03–0.04 | c | |
| Total isoflavone | 0.04–0.05 | 0.04–0.05 | c | |
| Tempeh/tempeh burger/tempeh cooked | Daidzein | 6.4–19.25 | 4.67–27.30 | a,c |
| Genistein | 19.60–31.55 | 1.11–39.77 | a,c | |
| Glycitein | 2.10–3.00 | 0.90–3.20 | b,c | |
| Total isoflavone | 29.00–53.00 | 6.88–62.50 | a,c | |
| Tofu, cooked or uncooked | Daidzein | 5.39–25.34 | 0.57–25.8 | a,b,c |
| Genistein | 6.48–42.15 | 1.95–42.15 | a,b,c | |
| Glycitein | 1.64–5.0 | 1.05–5.30 | a,b,c | |
| Total isoflavone | 13.51–67.49 | 3.61–67.49 | a,b,c | |
| Tofu yogurt | Daidzein | 5.7 | 5.7 | c |
| Genistein | 9.4 | 9.4 | c | |
| Glycitein | 1.20 | 1.20 | c | |
| Total isoflavone | 16.30 | 16.30 | c | |
| USDA beef patties | Daidzein | 0.35–0.67 | 0.20–1.05 | a |
| Genistein | 0.77–1.09 | 0.35–1.65 | a | |
| Glycitein | 0.02–0.10 | 0–0.20 | a | |
| Total isoflavone | 1.14–1.86 | 0.90–2.90 | a | |
Values represent aglycones and glycosides combined on a molar basis.
Ranges of means are given when similar products with separate means were combined into one entry in the table (e.g., combined entry of two samples of uncooked soybeans with three samples of cooked soybeans).
According to the USDA-Iowa State University report, “Each mean is assigned a Confidence Code (CC) of a, b, or c. The Confidence code is an indicator of relative quality of the data and the reliability of a given mean value. A confidence Code of “a” indicates considerable reliability, due either to a few exemplary studies or to a large number of studies of varying quality.” When multiple letters appear without other explanation, the confidence code varied with method of preparation. [The Expert Panel assumes that “a” means the highest confidence and “c” means the lowest confidence.]
1 mg genistein = 0.0037 mmol.
From USDA-Iowa State University (USDA, 2002).
A literature review (Mazur, 1998) indicated that genistein and its conjugates were found at highest concentrations in legumes, particularly soybeans (26.8–102.5 mg/100 g dry weight). Kudzu root, used as an herbal medication and, to a lesser extent as a food, contained genistein and its glycoside at 12.6 mg/100 g dry weight. Lentils, peas, kidney beans, and chick peas had considerably lower concentrations of genistein (up to about 0.5 mg/100 g dry weight according to this review). Cruciferous vegetables (broccoli, cauliflower) contained genistein and its conjugates at 8–9 μg/100 g dry weight. Barley meal contained genistein and its conjugates at 7.7 μg/100 g dry weight, but other cereals did not contain measurable genistein. Fruits and berries also did not contain measurable genistein. An evaluation of 26 Czech or Slovak beers found genistein+conjugate concentrations of 0.17–6.74 nM [0.05–1.82 μg/L] (Lapcík et al., 1998).
Lampe (2003) and Lampe et al. (1999) examined the cross-sectional association between urinary isoflavonoid and lignan excretion and intakes of vegetables and fruits in a healthy adult population in the US (49 males and 49 females; 18–37 years old, 91% Caucasian). Dietary intakes were assessed using 5-day diet records and a food frequency questionnaire. Vegetable and fruit intake groupings (total vegetable and fruit, total vegetable, total fruit, soy foods, and vegetable and fruit grouped by botanical families) were used to assess the relationship between vegetable and fruit intake and urinary isoflavonoid and lignan excretion. Gas chromatography/mass spectrometry (GC/MS) was used to measure isoflavones in 3-day composite 24-hr urine samples. Intake of soy foods was correlated significantly with urinary genistein (r =0.40, P =0.0001) and the sum of isoflavonoids (r =0.39; P =0.0001). Based on urine isoflavone measurements and food frequency questionnaires in healthy American adults, Lampe (2003) and Lampe et al. (1999) concluded that nearly all genistein exposure in humans occurs from ingestion of soy products.
Among soy foods, the highest quantities of isoflavones and their glycosides are found in soybeans and soy flour, while high levels are also present in miso and tempeh (UK Committee on Toxicity, 2003). Soy sauces contain very low concentrations of isoflavones (ILSI, 1999). Only trace levels of isoflavones are found in soy oil (Setchell, 1998). Second-generation products such as tofu yogurt or tempeh burgers contain 6–20% the levels of isoflavones found in whole soybeans, because other ingredients represent the majority of the product matrix (Kurzer and Xu, 1997).
Setchell et al. (1998) stated that isoflavone levels in soybeans can vary as a result of geographic location, climate, and growing conditions. Isoflavone levels can also vary according to soy crop strain, with 2- to 3-fold differences in isoflavone levels reported in different strains grown under similar conditions (UK Committee on Toxicity, 2003). According to Setchell et al. (1998), commercial processing of soybeans can result in decarboxylation, deacetylation, or deglycosylation of glycosides. For example, high temperatures can lead to decomposition of malonyl compounds to their respective acetylglycoside compounds (Setchell et al., 1998; UK Committee on Toxicity, 2003). While boiling reportedly reduces genistein content, baking and frying do not apparently alter isoflavone levels in foods (UK Committee on Toxicity, 2003). ILSI (1999) stated that excluding alcohol extraction, processing of soybeans does not usually reduce isoflavone content. Fermentation leads to a higher percentage of isoflavones as aglycones rather than glycosides (UK Committee on Toxicity, 2003).
The UK Committee on Toxicity (2003) reported total isoflavone levels in “weaning foods,” which included 22–66 mg/kg in instant weaning foods and 18–78 mg/kg in ready-to-eat weaning foods. [Genistein levels were not quantified separately. Examples of weaning foods examined were not provided, and it is not known if similar weaning foods are available in the US.] In three different infant cereals and two different infant dinners purchased in New Zealand, genistein+glycoside levels were measured at 3–287 mg/kg product and daidzein+glycoside levels at 2–276 mg/kg product (Irvine et al., 1998a). The study authors noted that a single serving of cereal can increase isoflavone intake by more than 25% in a 4-month-old infant.
Total levels of isoflavones in breast milk of mothers on an omnivorous, vegetarian, or vegan diet were reported by the UK Committee on Toxicity (2003) and are summarized in Table 3. No information was provided on the methodology used to measure isoflavone levels in breast milk. As noted in Table 3, the highest concentrations of isoflavones were reported in milk from women eating vegan and vegetarian diets. [Levels of genistein were not reported separately. CERHR was not able to obtain the original report prepared by the UK Ministry of Agriculture, Fisheries, and Food.] Levels of isoflavones in breast milk were orders of magnitude lower than levels in soy formula, which were reported at 18–41 mg aglycone equivalents/L prepared formula in a UK Ministry of Agriculture, Fisheries, and Food survey (MAFF, 1998a). In other studies, mean human milk levels of isoflavones were reported at 5.6 μg/L (analyzed by GC/MS) (Setchell et al., 1998) and <0.05 μg/g genistein and daidzein (method of analysis not specified) (Irvine et al., 1998a).
Table 3.
Isoflavone Levels in Human Milk Based on Diet
| Total Isoflavone Level (μg aglycone/kg milk)
|
||
|---|---|---|
| Mother’s diet | Mean | Range |
| Omnivorous (n 514) | 1 | 0–2 |
| Vegetarian (n 514) | 4 | 1–10 |
| Vegan (n 511) | 11 | 2–32 |
Studies that estimated intake of total genistein and daidzein (aglycones and conjugates) were identified, and those studies are outlined in Table 4. A small number of those studies estimated isoflavone intake in the US. One of the studies reported values for vegetarians residing in the UK. While vegetarians were evaluated separately in two of the studies listed in Table 4, there were no studies that reported levels of genistein intake in vegans. The review by the UK Committee on Toxicity (2003) reported total isoflavone intakes of up to 150 mg/day in vegans, a value that is about an order of magnitude higher than maximum isoflavone intakes listed in Table 4. Several studies reporting genistein and daidzein aglycone+glycoside intakes in Asian populations were also included in Table 4, because the values may compare to intakes by Asian-Americans consuming their traditional diets. Asian-Americans consuming traditional diets are likely to be a subpopulation among the most highly exposed to genistein and its conjugates. Estimates of aglycone+conjugated genistein and isoflavone intake within all population groups are highly variable. [While these estimates cover a wide range, there are clues to suggest that the divergent values are not artifacts of different methodology. For example, two studies of vegetarian intake (Kirk et al., 1999; UK Committee on Toxicity, 2003) yield similar intake estimate despite using different methods to estimate intake: questionnaires and analytical measurement. In one of these papers (Kirk et al., 1999) questionnaires were used to study omnivores, yielding intake estimates 10–100-fold higher than those from two other questionnaire studies (Strom et al., 1999; de Kleijn et al., 2001), which assessed older populations. Higher intake estimates in populations of Asian people may be attributable to diets including more soy products.]
Table 4.
Estimated Isoflavone (Aglycones+Glycosides) Intake in US, UK, and Asian Populations
| Intake, mg aglycone equivalents/day unless otherwise noted
|
|||||
|---|---|---|---|---|---|
| Population | General method of estimate | Genistein/genistin | Daidzein/daidzein | Total isoflavone | Reference |
| 964 Postmenopausal women in US, ages not reported | Women questioned about consumption of foods on the Willett food- frequency questionnaire; information on phytoestrogen levels in foods obtained from literature searches and consultation with experts. | Mean±SD: 0.338±2.119
Median: 0.070 |
Mean±SD: 0.289±2.104
Median: 0.039 |
Mean±SD: 0.760±4.345a
Median: 0.154a |
de Kleijn et al., 2001 |
| 83 Prostate cancer patients in the US, mean±SEM age 61±6.6 years | Men administered a food-frequency questionnaire; data analyzed using the DietSys database. | Median: 0.0198
Range: 0–0.9702 |
Median: 0.0142
Range: 0–4.384 |
Median: [0.0932]a
Range: [0–7.836]a |
Strom et al., 1999 |
| 107 Control men in US prostate cancer study, mean±SEM age 60.6±6.9 | Men administered a food-frequency questionnaire; data analyzed using the DietSys database. | Median: 0.0297
Range: 0–0.9467 |
Median: 0.0228
Range: 0–20.950 |
Median: [0.1161]a
Range: [0.1–23.043]a |
Strom et al., 1999 |
| 29 Omnivores or semi vegetarians (assumed to have some meat in- take) at a US naturopathic university (male and female; volunteers in all diet groups were 20–69 years of age) | Subjects questioned about frequency intake of soy foods; isoflavone levels in the foods estimated based on published data. | Mean: 192 mg/month [6 mg/day] | Mean: 110 mg/month [4 mg/day] | [Mean 10 mg/day]b | Kirk et al., 1999 |
| 22 Vegetarians at a US naturopathic university (male and female; volunteers in all diet groups were 20–69 years of age) | Subjects questioned about frequency intake of soy foods; isoflavone levels in the foods estimated based on published data. | Mean: 297 mg/month [10 mg/day] | Mean: 158 mg/month[5 mg/day] | [Mean: 15 mg/day]b | Kirk et al., 1999 |
| Vegetarians in the UK, numbers and ages of volunteers not specified | Participants collected duplicate of all food consumed over a 7-day period; exposures estimated from isoflavone concentrations in duplicate diet, weights of samples, and weights of study participants. | Mean: 8 mg/day genistein; 0.1 mg/kg bw/day (actual body weights) | Mean: 4 mg/day; 0.1 mg/kg bw/day (actual body weights) | Mean: 12 mg/dayb; 0.2 mg/kg bw/day (actual body weights) | UK Committee on Toxicity, 2003 |
| 102 Hawaiian women of different ethnic backgrounds, ages 36–80 years | Participants questioned about soy product intake during past year; isoflavone intakes estimated from food analysis data. | Not reported | Not reported | Mean±SD: Chinese:11.9±11.0
Filipino: 5.2±7.5 Native Hawaiian: 12.1±12.4 Japanese: 18.9±27.0 Caucasian: 5.2±8.6 Others: 16.8±11.5 |
Maskarinec et al., 1998 |
| Japanese population; no information on study population | No details available. | 5.4–9.3 | Not reported | Not reported | Fukutake et al. (1997) reviewed in Fitzpatrick, 1998 |
| 1232 Japanese people (886 men, 346 women), mean±SD ages were 54.4±7.7 years for men and 57.8±4.8 years for women | Participants described in detail, all foods and beverages consumed during an ordinary day; dietitians estimated sample sizes. | 25th percentile: 9.7
Median: 19.6 75th percentile: 31.9 |
25th percentile: 6.5
Median: 12.1 75th percentile: 19.5 |
[25th percentile: 16.2b] [Median: 31.7b] [75th percentile: 51.4b] | Wakai et al., 1999 |
| 88 members of the Japanese population (46 men, 42 women); mean±SD ages were 52.5±4.5 years for men and 49.8±8.6 years for women | Participants completed four 4-day dietary records from June 1996 to March 1997; food and beverages consumed by participants were weighed. | 25th percentile: 10.0
Median: 14.9 75th percentile: 19.3 |
25th percentile: 6.5
Median: 9.5 75th percentile: 12.3 |
[25th percentile: 16.5b] [Median: 24.4b] [75th percentile: 31.6b] | Wakai et al., 1999 |
| 106 Japanese women, ages 29–78 years | Participants provided 3-day dietary records; isoflavone intake estimated based on estimates of phytochemical levels in Japanese foods.e | [25th percentile: 19.3] [Mean7SD: 30.2714.4] [75th percentile: 37.6] | [25th percentile: 10.4 mg/day] [Mean7SD: 16.477.6] [75th percentile: 20.9] | [25th percentile: 29.7 mg/dayb] [Mean: 46.6b] [75th percentile: 58.5b] | Arai et al., 2000 |
| Korean population, 3224 males and 3475 females; ages not reported | Participants interviewed about food intake and dietary patterns; food eaten during two consecutive weekdays weighed and measured; data on isoflavone content obtained from published Korean studies. | Mean±SD: 7.32±3.24 | Mean±SD: 5.81±2.88 | Mean±SD: 14.88±6.26c | Kim and Kwon, 2001 |
| 60 Chinese women (75% premenopausal; 37–61 years) | Participants interviewed about the intake of certain foods within the past 5 years; isoflavone intake estimated according to published values for the types of foods eaten. | Geometric mean: 15.73
25th percentile: 8.24 Median: 17.92 75th percentile: 31.17 |
Geometric mean: 14.9
25th percentile: 7.80 Median: 17.98 75th percentile: 29.89 |
Geometric mean: 33.42c 25th percentile: 17.40c Median: 39.26c 75th percentile: 65.93c | Chen et al., 1999 |
| 147 Chinese volunteers (76 men and 71 women), middle aged and older (45–74 years) living in Singapore | Participants asked about frequency and amount of consumption of certain foods; isoflavone levels measured in select soy foods.d | [Mean: 2.3] [25th percentile: 1.2] [50th percentile: 2.4] [75th percentile: 4.2] | [Mean: 2.2] [25th percentile: 1.2] [50th percentile: 2.4] [75th percentile: 4.2] | [Mean: 4.7c] [25th percentile: 2.5c] [50th percentile: 5.1c] [75th percentile: 8.8c] | Seow et al., 1998 |
| Adults consuming a soy nutritional supplement, no information on study population | Intake based on label instructions. | Not reported | Not reported | 50 | Reviewed in Holder et al., 1999 |
| Adults consuming a soy cancer supplement; no information on study population | Intake based on label instructions. | Not reported | Not reported | 14,000 | Holder et al., 1999 |
SD, standard deviation; SEM, standard error of the mean.
Total isoflavone intake includes formononetin and biochanin A.
Total isoflavone intake based only on genistein/genistin and daidzein/daidzein levels.
Total isoflavone intake based on genistein/genistin, daidzein/daidzin, and glycitein/glycitin levels.
Intake values were reported in mg/week and converted to mg/day by CERHR.
Values provided in μmol/day and converted to mg/day by CERHR.
Genistein exposures in infants fed soy formula are explained in detail in the CERHR Expert Panel Report on Soy Formula (Rozman et al., 2006). Table 5 includes a summary of estimated genistein+glycoside intake from soy formula. Setchell et al. (1997, 1998) used an enzymatic deconjugation process and a gas chromatography/mass spectrometry (GC-MS) method to measure plasma total isoflavone levels in seven 4-month-old male infants fed soy formula. Mean±SD plasma genistein was 683±442.6 μg/L, and mean±SD plasma daidzein was 295.3±59.9 μg/L. Total isoflavones were reported at 552–1775 μg/L (mean =980 μg/L). [Plasma glycitein levels were not measured.] The study authors noted that they did not attempt to measure the extent of isoflavone conjugation in infant serum. Total plasma isoflavone levels were significantly higher in infants fed soy formula compared to 4-month-old male infants fed breast milk (mean±SD 4.7±1.3 μg/L, n =7) and cow milk formula (mean±SD 9.3±1.2 μg/L, n =7). Plasma isoflavone levels in infants fed soy formula were also higher than for adults ingesting similar levels of isoflavones from soy-based foods (50–200 μg/L) and compared to Japanese adults (40–240 μg/L).
Table 5.
Estimated Intake of Isoflavones (Aglycones+Glycosides) in Infants Fed Soy Formula
| Intake, mg aglycone equivalent/kg bw/day, based on formula ingestion
|
||||
|---|---|---|---|---|
| Country, infant age (Reference) | Total isoflavone | Genistein/genistin | Daidzein/daidzin | Glycitein/glycitin |
| US, 4 months (Setchell et al., 1997) | 4.5–8.0 (6–12a) | 3.0–5.4 (4.0–8.0) | 1.3–2.3 (1.7–3.4) | 0.23–0.4 (0.3–0.6) |
| US, age not stated (Murphy et al., 1997) | 5–12 | 3.0–7.1 | 1.5–3.5 | 0.60–1.4 |
| New Zealand, <1 month–4 months (Irvine et al., 1998a,b) | 2.9–3.8 | 1.9–2.4b | 1.0–1.4b | Not knownb |
| UK, 1–6 months (MAFF, 1998b) | 4.5–5.0 | 2.6–2.9 | 1.6–1.8 | 0.27–0.30 |
| US, 4.5 kg (Franke et al., 1998) | ~1.6 | ~0.9 | ~0.5 | ~0.1 |
| UK, 4–6 months (Hoey et al., 2004) | 1.7–4.4 | 0.99–2.9 | 0.46–1.3 | 0.10–0.70 |
Values reported in a more recent publication by Setchell et al. (1998).
Percentages of isoflavones are based upon levels of genistein/genistin and daidzein/daidzin reported. It is not known if the formulas also contained glycitein/glycitin.
Differences in soy food exposure patterns throughout life were noted for Americans compared to Asians (Badger et al., 2002). In the US, typical diets are low in soy products, and the fetus is thus exposed to low levels of genistein and its conjugates. Significant exposure to genistein and its conjugates occurs in the approximately 25% of infants who are fed soy formula. After those infants are weaned, soy product intake and genistein exposure drop and typically remain low over the lifetime. In Asian cultures consuming soy products, the fetus is exposed to genistein and its conjugates as a result of maternal soy product intake. At birth, most infants are either breast-fed or fed cow milk formula, so exposure to genistein and its conjugates is very low during infancy. Upon weaning, the infants begin receiving soy products and exposure to genistein and its glycosides remains high over the lifetime. Blood levels of genistein and daidzein measured in various populations are outlined in Section 2.
Exposure to genistein and other isoflavones can occur through intake of soy supplements that are marketed for treatment of menopausal symptoms (Setchell et al., 2001). Setchell et al. (2001) analyzed 33 commercially available phytoestrogen supplements to determine the types and levels of compounds present. [Either the information provided by the author or the types of compounds identified in the supplements indicated that 28 of the supplements were derived from soybeans.] The composition of the supplements was highly variable, and many contained unidentified compounds. The soy-based supplements consisted primarily of genistein, daidzein, and glycitein-derived glycosides. Aglycones represented <10% of the formulation for the majority of soy-based supplements (22/28). Five of the soy-based supplements contained 10–26% aglycones, and one of the supplements contained 47.2% aglycones. Total isoflavones per capsule or serving were measured at 2.8–58.0 mg for the soy-based supplements. Isoflavone levels were found to vary by more that 10% of the manufacturers’ reported values for about half of the 33 phytoestrogen supplements analyzed. The UK Committee on Toxicity (2003) reported that four surveys of soy supplements found that actual levels of isoflavones differed from values listed on labels and that, in most cases, actual levels were below those reported by manufacturers.
Doerge et al. (2000) measured isoflavone levels in a soy supplement purchased at a local health food store. The majority of isoflavones were present as acetyl glucosides and malonyl glucosides. Total genistein content (aglycone+conjugates) was 1.4 mg/tablet and total daidzein (aglycone+conjugates) was 8.9 mg/tablet. The values represented 84% of daidzein levels and 48% of genistein levels listed on the product label.
The Third National Report on Human Exposure to Environmental Chemicals (Centers for Disease Control and Prevention, 2005) prepared from the National Health and Nutrition Examination Survey (NHANES) reported urinary genistein concentrations in 2,557 Americans age 6 years and older, who were selected to represent the US population. Samples were collected in 2001–2002. Results are summarized in Table 6. [The Expert Panel noted that genistein was not measured in children younger than 6 years of age, but it is very likely that genistein would be detected in that age group.] A summary of daily urinary excretion rates of genistein reported in different studies for various populations was provided by Valentín-Blasini et al. (2005), and those values are summarized in Table 7. It is noted that a study by Setchell et al. (2003) reported a weak correlation between maximum blood levels of radiolabeled genistein and urinary excretion over 24 hr (r =0.4244; P<0.001). Because the data were considerably scattered, it was concluded that urinary genistein concentrations provide only a crude estimate of intake. [The Expert Panel noted several points regarding the data presented for NHANES 1999–2000 and NHANES 2001–2002. Biomonitoring data have been used to estimate prevalence and magnitude of exposure to isoflavones but not to estimate isoflavone intake. Genistein was not measured in children younger than 6 years of age, but it is very likely that genistein would be detected in that age group. Genistein measurements were not separately reported for Asian-Americans because of the comparatively small group size. It is possible that Asian-Americans consume more genistein-containing products than other races/ethnicities in the US. It is not possible to determine regional/geographic variations from the NHANES data. Total (conjugated+free) concentrations of genistein were measured using high performance liquid chromatography coupled to isotope dilution tandem MS (HPLC-MS/MS).]
Table 6.
Urinary Genistein (After Deconjugation) in the NHANES 2001–2002 Sample
| Geometric mean (95% CI)
|
95th Percentile
|
|||||
|---|---|---|---|---|---|---|
| Group | Total | n | μg/L | μg/g creatinine | μg/L | μg/g creatinine |
| Total sample | 2794 | 2784 | 33.0 (30.1–36.2) | 30.9 (28.5–33.6) | 613 | 427 |
| Age group (years) | ||||||
| 6–11 | 396 | 395 | 39.2 (33.4–46.0) | 44.6 (37.1–53.6) | 502 | 487 |
| 12–19 | 744 | 744 | 34.1 (27.2–42.8) | 26.3 (21.3–32.5) | 467 | 321 |
| 20+ | 1654 | 1645 | 32.1 (28.8–35.8) | 30.4 (27.6–33.4) | 627 | 435 |
| Sex | ||||||
| Male | 1375 | 1371 | 32.2 (27.9–37.2) | 26.2 (23.1–29.8) | 470 | 350 |
| Female | 1419 | 1413 | 33.7 (30.9–36.8) | 36.2 (32.8–39.8) | 666 | 571 |
| Race/ethnicity | ||||||
| Mexican-American | 679 | 676 | 28.3 (22.0–36.4) | 26.6 (21.6–32.7) | 424 | 371 |
| Non-Hispanic black | 706 | 705 | 37.6 (27.4–51.6) | 26.4 (19.3–36.1) | 596 | 384 |
| Non-Hispanic white | 1222 | 1217 | 30.9 (27.8–34.4) | 30.6 (28.3–33.2) | 626 | 426 |
CI, confidence interval.
Table 7.
Daily Urinary Excretion of Genistein
| Country | Study population | No. of subjects | Mean total urinary genistein after deconjugation, nmol/day | Reference |
|---|---|---|---|---|
| US | General population | 199 | 222 | Valentín-Blasini et al., |
| US | Multi-ethnic general population from NHANES 1999–2000 survey | ~2500 | 177d | Valentín-Blasini et al., 2005 |
| US | Multi-ethnic general population from NHANES 2001–2002 survey | ~2794 | 245a | Centers for Disease Control and Prevention, 2005 |
| US | Tofu-dosed volunteers (<1/week) | 16 | 307d | Franke, 1994b |
| US | Tofu-dosed volunteers (>1/week) | 7 | 2515d | Franke, 1994b |
| US | Adult men ingesting self-selected diet | 17 | 154 | Hutchins et al., 1995 |
| US | Adult men ingesting soy diet | 17 | 1658 | Hutchins et al., 1995 |
| US | Adult men ingesting tempeh diet | 17 | 1719 | Hutchins et al., 1995 |
| US | Adults ingesting basal diets | 20 | 100 | Kirkman et al., 1995b |
| US | Adults ingesting soy-rich diet | 20 | 1410 | Kirkman et al., 1995b |
| US | Adults ingesting carotenoid-rich diet | 20 | 110 | Kirkman et al., 1995b |
| US | Adults ingesting cruciferous-rich diet | 20 | 130 | Kirkman et al., 1995b |
| US | Caucasian adult women | 72 | 190 | Horn-Ross et al., 1997b |
| US | African-American adult women | 52 | 60 | Horn-Ross et al., 1997b |
| US | Hispanic adult women | 65 | 580 | Horn-Ross et al., 1997b |
| US | Japanese adult women | 5 | 300 | Horn-Ross et al., 1997b |
| US | Adult women ingesting control diet | 11 | 997c | Xu et al., 1998 |
| US | Adult women ingesting diet with 1.01 mg/kg bw/day isoflavones | 11 | 6529c | Xu et al., 1998 |
| US | Adult women ingesting diet with 2.01 mg/kg bw/day isoflavones | 11 | 14,200c | Xu et al., 1998 |
| US | Adults | 98 | 220 | Lampe et al., 1999 |
| Italy | Postmenopausal women taking soy supplements | 35 | 20,874d,e | Albertazzi, 1999b |
| Italy | Postmenopausal women taking placebo | 29 | 844d,e | Albertazzi, 1999b |
| Netherlands | Postmenopausal women with breast cancer | 100 | 1519f | Den Tonkelaar et al., 2001b |
| Netherlands | Postmenopausal women controls in breast cancer study | 300 | 1746f | Den Tonkelaar et al., 2001b |
| Japan | Adult men | 2 | 1769d | Adlercreutz, 1995ab |
| Japan | Adult women | 4 | 6476 | Adlercreutz, 1995ab |
| Japan | Adult women | 105 | 10,790f | Arai et al., 2000 |
| Japan | Adult women with documented intakes of isoflavones | 111 | 10,000 | Uehar et al., 2000b |
| China | Postmenopausal women | Not reported | 1470 | Roach et al., 1998b |
| China | Adult women with breast cancer | 250 | 14,264d | Dai et al., 2002b |
| China | Adult women controls in breast cancer study | 250 | 17,246d | Dai et al., 2002b |
| Korea | Postmenopausal women | 25 | 358d,f | Kim et al., 2002b |
| Korea | Postmenopausal women with osteopenia | 29 | 225d,f | Kim et al., 2002b |
| Korea | Postmenopausal women with osteoporosis | 21 | 384d | Kim et al., 2002b |
Calculated by CERHR by assuming 2.145 g creatine excreted/day and converting μg to nmol.
See Valentín-Blasini et al. (2005) for complete reference.
The values were obtained from the primary study report because the values provided by Valentín-Blasini et al. (2005) appeared to be in error.
Study authors calculated values by assuming 2.145 g creatinine excreted/day or 2000 mL urine/day.
Study authors assumed that daidzin and genistin measured in urine actually referred to the aglycones.
Median values.
To convert nmol to genistein equivalents in μg, multiply by 0.27.
Adapted from Valentín-Blasini et al. (2005).
1.3 Utility of Data
There is an extensive USDA-Iowa State University database that lists levels of genistein and genistein derivatives in soybeans and various of soy-based and non-soy-based foods (USDA, 2002). For the US population, there are two studies that estimate genistein intake in patients enrolled in clinical studies (Strom et al., 1999; de Kleijn et al., 2001), one study that estimates genistein intake by omnivores and vegetarians (Kirk et al., 1999), and one study that compares total isoflavone intake in Hawaiian populations (Maskarinec et al., 1998). There is no information on genistein intake for infants fed breast milk or for vegans in the US, but limited information on total isoflavone intake is available for the UK population. There are estimates of isoflavone intake by infants fed soy formula in the US and other countries (Rozman et al., 2006). Measurements are available for isoflavone levels in urine (Valentín-Blasini et al., 2005), including some from individuals ≥6 years old (Centers for Disease Control and Prevention, 2005). Genistein blood levels in various populations are discussed in Section 2. The available data provide a good foundation for estimating approximate exposure and dose within broad populations or within individuals.
1.4 Summary of Human Exposure Data
Genistein, which occurs naturally in soybeans, is a phytoestrogen classified as an isoflavone (MAFF, 1998b; Setchell et al., 1998; UK Committee on Toxicity, 2003). In unfermented soy products, small amounts of genistein and other isoflavones (daidzein and to a smaller extent glycitein) are present unconjugated as aglycones. Most genistein and other isoflavones in unfermented soy products are conjugated to a sugar molecule to form glycosides such as genistin, acetylgenistin, and malonylgenistin (Fig. 1) (UK Committee on Toxicity, 2003). As a result of bacterial hydrolysis during fermentation, aglycones represent a large proportion of the isoflavones in miso, tempeh, and soybean paste (ILSI, 1999; UK Committee on Toxicity, 2003). Isoflavone levels in soybeans can vary as a result of crop strain, geographic location, climate, and growing conditions (Setchell et al., 1998; UK Committee on Toxicity, 2003). Heating of soy products can cause decarboxylation, deacetylation, or deglycosylation of glycosides with decomposition of malonyl compounds to their respective acetylglycosides (Setchell et al., 1998; UK Committee on Toxicity, 2003). Except for alcohol extraction, processing soybeans does not usually reduce isoflavone content (ILSI, 1999).
Exposure to genistein occurs through consumption of soy foods such as tofu, soy milk, soy flour, textured soy protein, tempeh, and miso (FDA, 2000). Soy oils or soy sauces contain little-to-no genistein (Setchell, 1998; ILSI, 1999). Soy protein can be used in baked goods, breakfast cereals, pasta, beverages, toppings, meat, poultry, fish products, and dairy-type products including imitation milk and cheese (United Soybean Board, 2004). Soybean derivatives are present in 60% of processed foods available from UK supermarkets (UK Committee on Toxicity, 2003). The percentage of processed foods containing soybeans in the US is not known. Exposure to genistein can also occur through soy supplements marketed for the treatment of menopausal symptoms (Drugstore.com, 2004).
Based on sales of soy products, it appears that exposure to genistein and its conjugates in the US is increasing and will continue to increase. US retail sales of soy products were $852 million in 1992 and were projected to rise to $3.714 billion in 2002 (FDA, 2000). The Soyfoods Association of America reported soybean sales of $3.234 billion in 2000, $3.65 billion in 2002, and $4 billion in 2003 (Soyfoods Association of North America, 2003).
Soy infant formulas are a source of genistein and genistein glycoside exposure in infants (Rozman et al., 2006). Levels of total isoflavone, but not genistein, have been reported for breast milk in women from the U.K. (MAFF, 1998a); therefore, exposure to the neonate can occur through lactation. Levels of isoflavones were higher in breast milk from vegans and vegetarians than omnivores but still orders of magnitude lower than concentrations in soy formula. In addition, fetal exposure to genistein can occur transplacentally.
Because glycosides are deconjugated in the gut to form the active aglycones, exposure to a particular isoflavone (e.g., genistein) is theoretically the sum of the aglycone and respective glycoside compound concentrations converted on the basis of molecular weight (MAFF, 1998b; Setchell et al., 1998; UK Committee on Toxicity, 2003). However, the aglycone is reconjugated in the gut wall leaving approximately 1–2% free aglycone to enter the portal circulation.
Table 4 lists genistein+genistein glycoside intakes reported for various populations. In the US, average intakes of total genistein, i.e. free and conjugated, were reported as <1 mg/day [<0.014 mg/kg bw/day, based on a 70-kg body weight] for patients in clinical studies, ~6 mg/day [0.1 mg/kg bw/day] for omnivores or semi-vegetarians, and ~10 mg/day [0.14 mg/kg bw/day] for vegetarians. Average genistein+genistein glycoside intakes were ~15–30 mg/day [0.21–0.43 mg/kg bw/day] in Japanese populations, ~7 mg/day [0.23 mg/kg bw/day] in Korean populations, and ~2–18 mg/day [0.03–0.26 mg/kg bw/day] in Chinese populations. Genistein intake was not reported separately for vegans, but total isoflavone intake in vegans in the UK was about an order magnitude higher than those reported in Table 4. Genistein intake is highly variable in the adult population; evidence supports the notion that this variability is not due to differences in study methods. Genistein+genistein glycoside intake is estimated at 1–8 mg/kg bw/day in infants fed soy formula (Rozman et al., 2006). Total urinary genistein concentrations were measured by NHANES after deconjugation (Table 6). Total genistein levels indicate generally higher genistein levels in Asian compared to US populations and in volunteers fed soy products (Table 7). Circulating genistein levels in a variety of human populations are presented in Section 2.
2.0 GENERAL TOXICOLOGY AND BIOLOGIC EFFECTS
2.1 Toxicokinetics and Metabolism
The toxicokinetics and metabolism section of CERHR Expert Panel Reports is usually based on secondary sources. However, because the majority of secondary sources focus on genistein exposure through soy product intake, primary studies were used to obtain information on intake of genistein or isoflavone aglycones. Information was obtained from secondary sources as needed.
Toxicokinetic and metabolism data in humans and experimental animals indicate that genistein is absorbed into the systemic circulation of infants and adults. Genistein is absorbed and circulates as its glucuronide conjugate, and a much smaller percentage circulates as the aglycone. Genistein can be glucuronidated in the intestine or liver, but the intestine appears to play the major role in glucuronidation. Genistein glucuronides undergo enterohepatic cycling, and in the process can be deconjugated by intestinal bacteria. The role of gut bacteria in the metabolism of genistein has been clearly established. Genistein can be metabolized through a pathway that ultimately leads to the formation of 6′-hydroxy-O-demethylangolensin. Once absorbed, genistein glucuronide, and to a smaller extent genistein aglycone, are widely distributed to organ systems and the conceptus. The majority of a genistein dose is excreted in urine within 24 hr. Details of the human and experimental animal studies on which these conclusions are based are presented in the sections below.
2.1.1 Humans
Human toxicokinetic data for genistein are summarized in Table 8 and Table 9. The values were obtained from studies in which volunteers were given formulations containing genistein aglycone (Setchell et al., 2001) or isoflavone aglycones (genistein, daidzein, glycitein) (Bloedon et al., 2002; Busby et al., 2002). [Information on non-isoflavone components of the formulations was not provided in any of the studies.] 13C-Genistein was administered to female volunteers in one study (Setchell et al., 2003). Blood or urine samples were collected at multiple time periods for up to 24–72 hours following exposure. Levels of free and conjugated genistein were measured in plasma or urine using GC/MS (Setchell et al., 2001, 2003) or HPLC (Bloedon et al., 2002; Busby et al., 2002; Setchell et al., 2003).
Table 8.
Free Genistein: Toxicokinetic Information Following Intake of a Purified Isoflavone Aglycone Supplement
| Sample and dosing information | Genistein dose, mg/kg bw | Tmax, hr | Cmax, nM [μg/L] | kel | Half-life, hr | Vd, L/kg bw | Clp, L/kg bw-hr | AUC, nM-hr [μg-L/hr] | Reference |
|---|---|---|---|---|---|---|---|---|---|
| Healthy postmenopausal women (3/group) with low soy product intake ingested a formulation containing 100% unconjugated isoflavones (87% genistein). | 2 | 3.33±2.02 | 47.0±18.5 [13±5.0] | 0.345±0.055 | 2.04±0.30 | 145±113 | 47.7±34.0 | 182±116 [49±31] | Bloedon et al., 2002 |
| 4 | 3.50±2.29 | 98.7±78.8 [27±21] | 0.211±0.127 | 4.22±2.46 | 153±95 | 24.5±1.7 | 544±106 [147±29] | ||
| 8 | 8.33±6.35 | 117±36 [32±9.7] | 0.127±0.034 | 5.72±1.34 | 318±292 | 36.9±17.8 | 1028±621 [278±168] | ||
| 16 | 2.52±1.72 | 204±39 [55±11] | 0.299±0.184 | 3.20±2.30 | 205±119 | 47.6±29.4 | 1326±505 [358±136] | ||
| Healthy postmenopausal women (3/group) with low soy product intake ingested a formulation containing 70% unconjugated isoflavones (44% genistein). | 2 | 2.33±1.89 | 126±95 [34±26] | 0.448±0.156 | 1.67±0.54 | 71.3±59.7 | 26.6±15.1 | 327±162 [88±44] | Bloedon et al., 2002 |
| 4 | 2.50±3.04 | 155±109 [42±29] | 0.226 | 3.81 | 66 | 14.4 | 806±616 [218±166] | ||
| 8 | 1.00±0.50 | 134±29 [36±7.8] | 0.105±0.037 | 7.33±3.21 | 441±397 | 36.9±29.9 | 695±371 [188±100] | ||
| 16 | 1.03±0.50 | 360±221 [97±60] | 0.362±0.165 | 2.15±0.78 | 130±91 | 45.9±23.5 | 2229±2252 [602±609] | ||
| Healthy men (3/group) abstained from eating soy products and ingested a formulation containing ≥97% unconjugated isoflavones (90% genistein). | 8 | 6.5±3.8 | 131±21 [35±5.7] | 0.428 | 1.9 | 104 | 38.5 | Busby et al., 2002 | |
| 16 | 2.8±2.8 | 66±31 [18±8.4] | 0.333 | 2.3 | 877 | 258 | |||
| Healthy men (3/group) abstained from eating soy products and ingested a formulation containing ≥70% unconjugated isoflavones (43% genistein). | 1.0 | 6.0 | 74 [20] | 0.443 | 1.6 | 15.9 | 7.0 | Busby et al., 2002 | |
| 2.0 | 5.0±3.1 | 69±33 [19±8.9] | 0.209±0.103 | 4.1±2.5 | 112±50 | 20.7±9.6 | |||
| 4.0 | 2.7±0.6 | 84±14 [23±3.8] | 0.141±0.053 | 5.4±1.8 | 186±64 | 25.8±10.2 | |||
| 8.0 | 3.5±3.5 | 258±134 [70±36] | 0.295±0.011 | 2.4±0.1 | 99.0±44.8 | 29.2±13.5 | |||
| 16.0 | 2.5±1.7 | 363±213 [98±58] | 0.317±0.239 | 3.1±1.9 | 226±211 | 49.4±43.8 |
Cmax, maximum plasma concentration; Tmax, time to Cmax; kel, terminal elimination rate constant; Vd, volume of distribution; Clp, apparent systemic clearance; AUC, area under the time-concentration curve.
Values presented as mean±SD; values without a SD could be measured in fewer than three subjects. AUC values calculated by assigning a value of 0 to values below the limit of quantification. To convert nM to μg/L, multiply by 0.27.
Table 9.
Total Genistein: Toxicokinetic Information Following Intake of a Purified Isoflavone Aglycone Supplement
| Sample and dosing information | Genistein dose, mg/kg bw | Tmax, hr | Cmax, nM [μg/L] | kel | Half-life, hr | Vd, L/kg bw | Clp, L/kg bw-hr | AUC, nM-hr [μg-hr/L] | Reference |
|---|---|---|---|---|---|---|---|---|---|
| Healthy postmenopausal women (3/group) with low soy product intake ingested a formulation containing 100% unconjugated isoflavones (87% genistein). | 2 | 4.50±1.50 | 3440±1425 [930±385] | 0.108±0.017 | 6.50±1.08 | 1.91±0.76 | 0.208±0.097 | 35,394±15,174 [9565±4101] | Bloedon et al., 2002 |
| 4 | 7.50±5.41 | 8545±621 [2309±168] | 0.070±0.035 | 12.4±7.9 | 1.23±0.08 | 0.085±0.038 | 129,072±23,261 [34,880±6286] | ||
| 8 | 9.50±4.33 | 14,172±4492 [3830±121] | 0.066±0.039 | 13.4±7.7 | 1.71±0.68 | 0.108±0.073 | 212,952±102,646 [57548±27,739] | ||
| 16 | 6.50±2.29 | 28,158±15,954 [7609±4311] | 0.078±0.034 | 10.0±3.8 | 1.69±0.64 | 0.147±0.117 | 432,978±254,319 [117,008±68,727] | ||
| Healthy postmenopausal women (3/group) with low soy product intake ingested a formulation containing 70% unconjugated isoflavones (44% genistein). | 2 | 3.00±1.50 | 5638±2369 [1524±640] | 0.070±0.019 | 10.5±3.3 | 1.49±0.61 | 0.107±0.058 | 64,651±29,448 [1.7,471±7958] | Bloedon et al., 2002 |
| 4 | 3.50±2.29 | 8672±1869 [2344±505] | 0.073±0.026 | 10.6±4.7 | 1.57±0.39 | 0.119±0.063 | 115,572±48,857 [31,232±13,203] | ||
| 8 | 4.50±1.50 | 15,235±1665 [4117±450] | 0.092±0.019 | 7.76±1.55 | 1.53±0.43 | 0.135±0.012 | 192,600±25,404 [52,048±6865] | ||
| 16 | 4.52±1.52 | 25,413±8733 [6868±2360] | 0.079±0.009 | 8.91±1.08 | 2.12±0.86 | 0.171±0.082 | 337,949±172,529 [91,327±46,624] | ||
| Healthy men (3/group) abstained from eating soy products and ingested a formulation containing ≥97% unconjugated isoflavones (90% genistein). | 1.0 | 5.5±0.9 | 929±88 [251±24] | 0.091±0.034 | 8.2±2.5 | 3.6±0.4 | 0.326±0.088 | Busby et al., 2002 | |
| 2.0 | 7.5±1.5 | 2095±451 [566±122] | 0.073±0.025 | 10.3±3.8 | 3.7±1.3 | 0.253±0.016 | |||
| 4.0 | 6.5±3.8 | 4418±2502 [1194±676] | 0.103±0.030 | 7.2±2.5 | 3.5±2.9 | 0.381±0.364 | |||
| 8.0 | 8.0±2.3 | 8037±2203 [2172±595] | 0.076±0.019 | 9.5±2.1 | 2.9±0.7 | 0.220±0.075 | |||
| 16.0 | 4.7±2.8 | 7594±1384 [2052±374] | 0.085±0.023 | 8.6±2.5 | 6.4±1.4 | 0.534±0.152 | |||
| Healthy men abstained from eating soy products and ingested a formulation containing ≥70% unconjugated isoflavones (43% genistein).a | 1.0 | 5.7±3.2 | 2729±1710 [737±462] | 0.076±0.025 | 9.9±3.3 | 2.2±1.9 | 0.148±0.093 | Busby et al., 2002 | |
| 2.0 | 3.7±2.1 | 5492±1516 [1484±410] | 0.083±0.020 | 8.7±2.4 | 1.7±1.4 | 0.125±0.066 | |||
| 4.0 | 6.0±0.0 | 9479±2053 [2562±555] | 0.116±0.019 | 6.1±1.0 | 1.1±0.2 | 0.128±0.046 | |||
| 8.0 | 4.5±2.6 | 17,870±2426 [4829±656] | 0.056±0.009 | 12.6±1.8 | 1.8±0.3 | 0.100±0.018 | |||
| 16.0 | 3.5±1.7 | 27,460±15,380 [7406±4156] | 0.067±0.012 | 10.6±2.2 | 3.2±2.6 | 0.218±0.194 | |||
| Healthy premenopausal women (n 53) abstained from eating soy foods and ingested genistein | 50 mg [±0.8 mg/kg bw/day for a 60 kg bw] | 6.6a | 1260±270 [341±73] | 6.78±0.84 | 161.1±44.1 L [2.7±0.74 L/kg for a 60 kg bw] | 4540±1410 mg h/L [16,776±5210 nmol hr/L] | Setchell et al., 2001 | ||
| Healthy premenopausal women (n 58) were given a bolus dose of 13C-genistien on two separate occasions. Data are presented as mean±SEM obtained on the 2 days of testing. | 0.4 | 480±80 [130±22] | 7.68±0.34 | 224.06±40.78/bioavailable fraction (L) | 20.17±3.50/bioavailable fraction (L/hr) | 6330±1260 [1711±340] | Setchell et al., 2003 | ||
| Healthy premenopausal women (n 58) were given a bolus dose of 13C-genistien. Data are presented as mean±SEM. | 0.8 | 870±140 [235±38] | 7.41±0.39 | 243.06±37.97/bioavailable fraction (L) | 22.39±2.56/bioavailable fraction (L/hr) | 9770±1320 [2640±357] | Setchell et al., 2003 | ||
| Healthy premenopausal women (n 58) were given a bolus dose of 13C-genistien after they had ingested 500 mL/day soy milk for 1 week. Data are presented as mean±SEM. | 430±70 [116±19] | 8.31±0.80 | 343.86±150.02/bioavailable fraction (L) | 24.68±6.82/bioavailable fraction (L/hr) | 5350±850 [1446±229] | Setchell et al., 2003 |
Cmax, maximum plasma concentration; Tmax, time to Cmax; kel, terminal elimination rate constant; Vd, volume of distribution; Clp, apparent systemic clearance; AUC, area under the time-concentration curve.
Values presented as mean±SD. AUC values calculated by assigning a value of 0 to values below the limit of quantification. Values presented as mean±SD except for last row where variances were unspecified (Setchell et al., 2001). Conversion of nM to μg/L is for genistein equivalents.
The value was obtained from the abstract, which differed from the value reported in the text. Based on the Figure 2 of the study, the actual value appears to be <6 hr.
2.1.1.1 Absorption
As noted in Table 8 and Table 9, genistein is rapidly absorbed in humans following oral intake. Before absorption into the systemic circulation, most genistein is conjugated with glucuronic acid and excreted in the bile to undergo enterohepatic circulation, as discussed in greater detail in the Section 2.1.1.3. Therefore, genistein bioavailability is very limited. Times to obtain maximum plasma concentrations were reported at 1–6 hr for free genistein (Table 8) and 3–8 hr for total genistein (aglycone+conjugates; Table 9). In one of the studies, the lowest dose used (2 mg/kg bw) was stated to provide more than twice the level of isoflavones ingested in a Japanese daily diet (Bloedon et al., 2002). A study in which menopausal women were given a 50 mg commercial isoflavone extract incorporated into fruit juice, chocolate, or a cookie showed no significant effect of the food matrix on genistein absorption or urinary excretion parameters (de Pascual-Teresa et al., 2005). In a study in which eight women were dosed with 0.4 or 0.8 mg/kg bw 13C-labeled genistein, the area under the curve (AUC) at the higher dose was less than double the AUC at the lower dose, suggesting a decrease in fractional absorption with increasing dose (Setchell et al., 2003) (Table 9).
Blood levels of genistein resulting from typical dietary exposures and soy supplement intakes are summarized in Table 10 and Table 11. Comparisons of bioavailability of genistein when ingested as aglycone or glycoside are also discussed in the CERHR Expert Panel Report on Soy Formula (Rozman et al., 2006).
Table 10.
Blood Levels of Total Isoflavones (Aglycone+Conjugates)
| Plasma or serum levels, nM [μg/L] (mean±SD)a |
||||
|---|---|---|---|---|
| Population and exposure condition | Genistein | Daidzein | Equol | Reference |
| Seven 4-month old infants fed soy formula | 2530±1640 [684±443] | 1160±230 [295±58] | Not detected | Setchell et al., 1997, 1998 |
| Infants fed cow milk formulas | 11.6±2.5 [3.1±0.68] | 8.1±1.1 [2.1±0.28] | 16.9±2.0 [4.1±0.48] | Setchell et al., 1997, 1998 |
| Infants fed breast milk | 10.2±2.7 [2.8±0.76] | 5.86±0.51 [1.5±0.13] | Not reported | Setchell et al. (1997) as cited in Chen and Rogan, 2004 |
| Men consuming traditional Japanese diet | 90–1204 [24–325] | 60–924 [15–235] | 0.54–24.6 [0.13±6.0] | Adlercreutz et al. (1994) as cited in Kurzer and Xu, 1997 |
| Omnivorous Japanese men | 276.0 [75] | 107.0 [27] | 5.5 [1.3] | Adlercreutz et al., 1993b |
| Omnivorous Japanese men | 206.1 [56] | 72.5 [18] | Not reported | Arai et al. (2000) as cited in Whitten and Patisaul, 2001 |
| Japanese mena | 493.3±604.4 [133±163] | 280.7±375.5 [71±95] | Not reported | Pumford et al., 2002 |
| Japanese womena | 501.9±717.6 [136±194] | 246.6±369.4 [63±94] | Not reported | Pumford et al., 2002 |
| Japanese women | 307.5±325.4 [83±88] | 111.7±187.8 [28±48] | Not reported | Arai et al., 2000 |
| Vegetarian Finnish women | 44.8 [12] | 50 [13] | 1.5 [0.36] | Adlercreutz et al., 1993a |
| Vegetarian Finnish women | 17.1 [4.6] | 18.5 [4.7] | 0.7 [0.17] | Adlercreutz et al. (1994) as cited in Whitten and Patisaul, 2001 |
| Lactovegetarian Finnish women | 29.7 [8.0] | 41.5 [11] | 1.0 [0.059] | Adlercreutz et al. (1994) as cited in Whitten and Patisaul, 2001 |
| Omnivorous Finnish women | 7.7 [2.0] | 6.4 [1.6] | 1.6 [0.39] | Adlercreutz et al., 1993a |
| Omnivorous Finnish women | 4.9 [1.3] | 4.2 [1.1] | 0.8 [0.19] | Adlercreutz et al. (1994) as cited in Kurzer and Xu, 1997; Whitten and Patisaul, 2001 |
| Finnish men | 6.3 [1.7] | 6.2 [1.6] | 0.8 [0.19] | Adlercreutz et al., 1993b |
| Omnivorous Finnish men | 0.5 [0.14] | 0.6 [0.15] | 0.1 [0.024] | Adlercreutz et al. (1993) as cited in Whitten and Patisaul, 2001 |
| British men | 34.1±27.2 [9.2±7.4] | 18.2±20.4 [4.6±5.2] | Not reported | Pumford et al., 2002 |
| British women | 30.1±31.2 [8.1±8.4] | 13.5±11.6 [3.4±2.9] | Not reported | Pumford et al., 2002 |
1 nM =270.24 ng/L genistein, 254.24 ng/L daidzein, and 284.16 ng/L glycitein. Conversions in the table refer to aglycone equivalents.
Table 11.
Blood Levels of Total Isoflavones (Aglycones+Conjugates) Following Ingestion of Soy Products
| Plasma or serum levels nM [μg/L] (mean±SD)
|
|||
|---|---|---|---|
| Population and exposure condition | Genistein | Daidzein | Reference |
| Women ingesting 0.7 mg/kg bw isoflavone (44% genistein and 56% daidzein) through soy milk powder | 740±440 [200±119] | 790±40 [201±10] | Xu et al., 1994 |
| Women ingesting 1.3 mg/kg bw isoflavone (44% genistein and 56% daidzein) through soy milk powder | 1070±630 [289±170] | 1220±670 [310±170] | Xu et al., 1994 |
| Women ingesting 2.0 mg/kg bw isoflavone (44% genistein and 56% daidzein) through soy milk powder | 2150±1330 [581±359] | 2240±1180 [570±300] | Xu et al., 1994 |
| Women consuming 4.5 mmol/kg bw isoflavones through soy milk (48.9% genistein, 43.3% daidzein, 7.8% glycitein)a | 1700±1010 [459±273] | 1040±610 [264±155] | Zhang et al., 1999b |
| Women consuming 4.5 mmol/kg bw isoflavones through soy germ (12.6% genistein, 48.5% daidzein, 38.9% glycitein)a | 510±190 [138±51] | 1630±1030 [414±262] | Zhang et al., 1999b |
| Men consuming 4.5 mmol/kg bw isoflavones through soy milk (48.9% genistein, 43.3% daidzein, 7.8% glycitein)a | 1780±830 [481±224] | 1290±500 [328±83] | Zhang et al., 1999b |
| Men consuming 4.5 mmol/kg bw isoflavones through soy germ (12.6% genistein, 48.5% daidzein, 38.9% glycitein)a | 470±290 [127±78] | 1160±440 [295±11] | Zhang et al., 1999b |
| Males ingesting cereal bar containing 8 g defatted soy grit (~20 mg isoflavones) | 468 [126] | 392 [100] | Pumford et al., 2002 |
| Males ingesting cake containing 10.95 mg genistein and 8.54 mg daidzein for 3 days. Day 3 values listed. | 445 [120] | 297 [75.5] | Pumford et al., 2002 |
| Males ingesting 16 mg isoflavone/kg bw | 7700 [2081] (total)
70 [19] (free) |
Not reported | Busby et al. (2002) as cited in UK Committee on Toxicity, 2003 |
| Males consuming soy protein isolate beverage (60 g/day) for 28 days | 907±245 [245±66] | 498±102 [127±26] | Gooderham et al. (1996) as cited in ILSI, 1999 |
| Male ingesting soy supplement at dose of 35.6 mg/day daidzein and 5.6 mg/day genistein for 7 days | 138±13 [37.3±3.5] | 671±46 [171±12] | Doerge et al., 2000 |
| Female ingesting soy supplement at dose of 35.6 mg/day daidzein and 5.6 mg/day genistein for 7 days | 383±16 [104±4.3] | 558±14 [142±3.6] | Doerge et al., 2000 |
| Females ingesting 5 mg genistin or 5 mg daidzin | 1220±470b [330±127] | 1550±240b [394±61] | Setchell et al., 2001 |
| Females ingesting 5 mg genistein or 5 mg daidzein | 1260±270b [341±73] | 760±120b [193±49] | Setchell et al., 2001 |
Equol was not reported in these studies. Conversions in the table refer to aglycone equivalents.
Plasma glycitein values were reported at 200±80 nM [57±23 μg/L] in women consuming soy milk, 730±220 nM [208±63 μg/L] in women consuming soy germ, 220±80 nM [63±23 μg/L] in men consuming soy milk, and 850±250 nM [242±71 μg/L] in men consuming soy germ.
Variance not specified.
2.1.1.2 Distribution
Following intake of genistein or isoflavone aglycone formulations providing genistein doses of about 1–16 mg/kg bw, mean volumes of distribution (Vd) were reported at ~71–441 L/kg bw for free genistein (Table 8) and ~1–6 L/kg bw for total genistein (Table 9). According to Busby et al. (2002), the higher Vd for the free isoflavones suggests that free genistein enters tissues more readily than conjugated genistein and is most likely sequestered in tissues to some extent. [The Busby et al. (2002) suggestion could not be confirmed from their data.] When men with prostate cancer were given a clover phytoestrogen supplement containing isoflavones 240 mg/day for 2 weeks, mean (range) prostate genistein was 1283 (39–5428) nmol/kg [346 (0.011–1.466) mg/kg aglycone equivalents]. Mean (range) serum genistein on the morning of surgery was 656 (84–2092) nM [0.177 (0.023–0.565) mg/L aglycone equivalents] (Rannikko et al., 2006). [The genistein composition of the isoflavone supplement was not given. The methods section did not indicate whether genistein conjugates were hydrolyzed prior to measurement.]
Three papers reported that genistein is distributed to the human conceptus. Adlercreutz et al. (1999) used a GC/MS method to measure maternal plasma, cord plasma, and amniotic fluid phytoestrogen levels in seven healthy omnivorous Japanese women (20–30 years old) who had just given birth. Only the results for genistein are discussed. Total genistein levels in maternal blood and unconjugated and conjugated levels in cord plasma and amniotic fluid are summarized in Table 12. Genistein was detected in cord blood and amniotic fluid, and levels were reported to be variable between subjects. Correlations between maternal blood and cord blood or amniotic fluid genistein levels were not statistically significant. Most of the genistein in amniotic fluid was represented by glucuronide or sulfoglucuronide conjugates. [Unconjugated and sulfate conjugates of genistein represented 10–15% of total genistein in cord blood and amniotic fluid.] The study authors concluded that phytoestrogens cross the placenta. Foster et al. (2002b) measured phytoestrogens in 57 human amniotic fluid samples collected between 15 and 23 weeks of gestation. Samples were collected in Los Angeles [ethnic composition and dietary factors not discussed]. Measurements were made by GC/MS after glucuronidase treatment to hydrolyze the conjugates. Genistein was measurable in 42 of the samples with a mean±SD concentration of 1.08±0.91 ng/mL [4.0±3.4 nM] (range =0.4–4.86 ng/mL [1.5–17.9 nM]). In a different study, Foster et al. (2002a) reported genistein concentrations in 59 amniotic fluid samples obtained from 53 pregnant women at 15–23 weeks of gestation (four sets of twins and one woman who was sampled three times). There were 42 women with measurable amniotic fluid genistein concentrations. The mean±SD genistein concentration was 1.69±1.48 ng/mL [6.25±5.48 nM] (maximum 6.54 ng/mL [24.2 nM]). [In a table, the mean±SD is reported as 1.37±1.00 ng/mL (5.07±3.7 nM) with a median of 0.99 ng/mL (3.7 nM). It is not known whether there are any samples represented in both papers.] Engel et al. (2006) measured genistein in amniotic fluid samples obtained prior to 20 weeks. The samples were collected for the sole indication of “advanced maternal age” (>35 years). The median (range) genistein concentration was 1.38 (0.20–7.88) μg/L.
Table 12.
Levels of Genistein in Maternal Plasma, Cord Plasma, and Amniotic Fluid From Seven Healthy Pregnant Women at Delivery
| Mean concentration (range) nM [μg/L] |
|||
|---|---|---|---|
| Sample | Unconjugated1sulfates | Glucuronides1sulfoglucuronides | Total |
| Maternal plasma | Not reported | Not reported | 83.9 (9.16–303) [23 (2.5–82)] |
| Cord plasma | 15.7 (3.51–37.3) [4.2 (0.95–10)] | 150 (35.6–387) [41 (9.6–105)] | 165 (39.8–417) [45 (11–113)] |
| Amniotic fluid | 10.2 (2.93–24.4) [2.8 (0.79–6.6)] | 53.8 (3.86–198) [15 (1.0–54)] | 64 (11.4–212) [17 (3.1–57)] |
Conversions refer to genistein equivalents.
Studies described in detail in the CERHR Expert Panel Report on Soy Formula indicate that genistein is distributed to breast milk following ingestion of soy foods (Franke and Custer, 1996; Franke et al., 1998).
2.1.1.3 Metabolism
The complete metabolic fate of genistein is not known, but some information is available. Metabolism of genistein is outlined in Figure 2. Because very little information is available on the metabolism of genistein aglycone, information was obtained from reviews based primarily on exposure to genistein+genistein glycosides through soy products. [In accordance with well-understood principles of absorption, genistin in soy products will not be readily absorbed because its high water solubility prevents passage through the lipid bi-layers of enterocytes. Also in agreement with theory is a prolonged tmax (time to Cmax; see Table 8) indicating that the glucoside must first traverse the small intestine and reach the large intestine before bacterial flora deconjugate it to genistein, which is insoluble in water but soluble in lipids. The lipid solubility of genistein facilitates its absorption in the large intestine.]
Fig. 2.
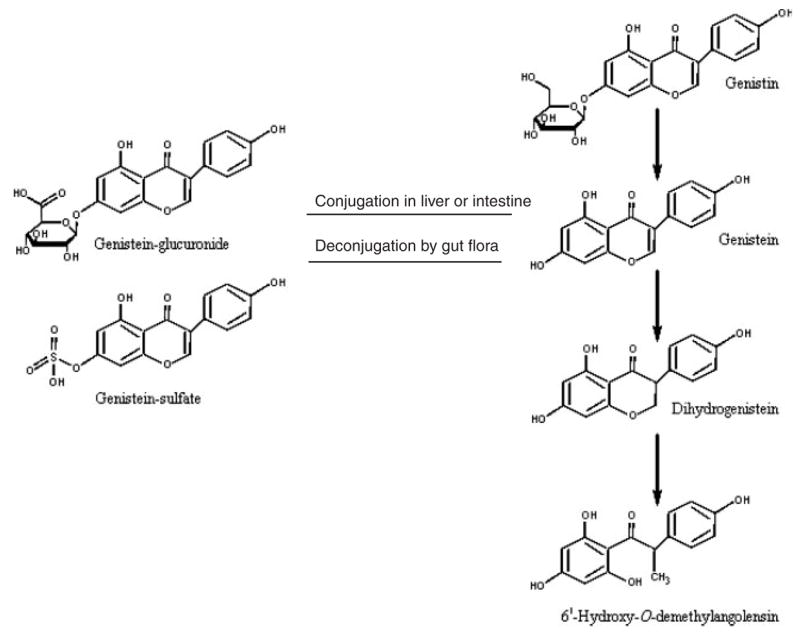
Metabolism of genistin and genistein. Adapted from UK Committee on Toxicity (2003) and Joannou et al. (1995).
Prior to entering the systemic circulation, most genistein is conjugated with glucuronic acid by uridine diphosphate (UDP)-glucuronosyltransferase (UDPGT); a much smaller amount is conjugated to sulfate by sulfotransferase enzymes (Joannou et al., 1995; Kurzer and Xu, 1997; UK Committee on Toxicity, 2003). Conjugation of genistein occurs in the intestine, although it also has been reported to occur in liver. One study demonstrated that the ability to catalyze glucuronidation of genistein was greatest with microsomes from kidney>colon>liver (Doerge et al., 2000). UDPGT isoenzymes including 1A1, 1A4, 1A6, 1A7, 1A9, and 1A10 were observed to catalyze the glucuronidation of genistein. The UGT 1A10 isoform, which is present in colon, gastric, and biliary epithelium but not in liver, was observed to have the highest activity and specificity for genistein. Based on those observations, the study authors concluded that the intestine plays a major role in the glucuronidation of genistein. The glucuronide and sulfate conjugates can enter the systemic circulation, and the majority of isoflavone compounds in the circulation are present in conjugated form. In studies where humans were exposed to genistein alone or in combination with other isoflavone aglycones (calculated as genistein doses of 1–16 mg/kg bw), most of the genistein was present in plasma in conjugated form (Setchell et al., 2001; Bloedon et al., 2002; Busby et al., 2002); free genistein represented 1–3% of total plasma genistein levels. The conjugated isoflavones undergo enterohepatic circulation, and on return to the intestine, they are deconjugated by bacteria possessing β-glucuronidase or arylsulfatase activity. The metabolites may be reabsorbed or further metabolized by gut microflora. One review reported that ~10% of isoflavonoids are circulated in plasma unconjugated (Whitten and Patisaul, 2001).
A study examining the ontogeny of UDPGT in humans (Coughtrie et al., 1988) is presented in Section 2.5.
Setchell (1998) reported that studies conducting detailed qualitative analysis of human urine identified diphenolic metabolites generated in intermediates steps of genistein biotransformation. At the time that the Setchell review was published, the intermediate metabolites had not yet been identified by MS.
In volunteers given an isoflavone aglycone formulation providing genistein doses of 2–16 mg/kg bw, ~8–18% of the genistein dose was excreted in urine as genistein conjugates within 24 hr (Bloedon et al., 2002; Busby et al., 2002), and <0.3% of the dose was excreted as free genistein (Bloedon et al., 2002). Incomplete recovery suggests the formation of additional metabolites (reviewed by Steer et al., 2003).
There is some evidence that cytochrome P450 (CYP) may be involved in the metabolism of isoflavones. Unidentified metabolites considered to be hydrolysis products have been detected following in vitro incubation of genistein with human recombinant CYP1A1, 1A2, 1B1, 2E1, or 3A4 isoforms (reviewed by UK Committee on Toxicity, 2003).
The role of gut microflora in the metabolism of isoflavones was clearly established (reviewed by UK Committee on Toxicity, 2003). Experiments conducted with cultured human fecal bacteria demonstrated the metabolism of genistein to dihydrogenistein. Other experiments with human fecal bacterial cultures demonstrated the conversion of genistein to dihydrogenistein and 6′-hydroxy-O-demethylangolensin and upon further hydrolysis, 4-hydroxyphenol-2-propionic acid. 4-p-Ethyl-phenol was identified as a metabolite in previous experiments.
A review by Munro et al. (2003) reported that variations in metabolic pathways of isoflavones can occur as a result of differences in microflora, intestinal transit time, pH, or redox potential, factors that can be affected by diet, drugs, intestinal disease, surgery, and immune status.
2.1.1.4 Excretion
In volunteers who ingested genistein alone or in combination with other isoflavone aglycones (calculated as genistein doses of 1–16 mg/kg bw), half-lives of elimination were reported at 2–7 hours for free genistein (Table 8) and 6–13 hr for total genistein (Table 9).
In reviews that primarily addressed genistein exposure through soy product intake, it was reported that most ingested genistein is excreted in urine, with very little excreted in feces (reviewed by ILSI, 1999 and UK Committee on Toxicity, 2003). Isoflavone excretion has been reported at ~30% in urine and 1–4% in feces. (Xu et al., 2000; reviewed by ILSI, 1999; UK Committee on Toxicity, 2003). These fecal excretion data are in contrast to experimental animal data (Coldham and Sauer, 2000), which show fecal excretion of 14C-genistein or derivatives at 30–36% of dose. [A strong possibility must be entertained that some of the material escaped detection due to bacterial degradation as suggested by Xu et al. (2000). Therefore, fecal excretion of genistein or derivatives is almost certainly much higher than indicated by the work of Xu et al.] The majority of fecal isoflavones are recovered 2–3 days following ingestion (reviewed by Setchell et al., 2003 and UK Committee on Toxicity, 2003). In subjects ingesting soy milk, urinary excretion peaked at 8–10 hr, and 95% of excretion occurred within 24 hr. Mean in vitro fecal degradation half-lives for 14 volunteers were reported at ~8.9 hr for genistein (Zhang et al., 1999b). It has been reported that urinary levels of genistein are slightly lower in infants than adults fed equivalent amounts of isoflavones, which could possibly indicate slower renal clearance in early life (reviewed by Setchell et al., 1998). A study detailing isoflavone toxicokinetics in infants fed soy formula (Irvine et al., 1998b) is reviewed in detail in the CERHR Expert Panel Report on Soy Formula (Rozman et al., 2006).
2.1.2 Experimental animals
In contrast to humans, who are exposed to genistein primarily through soy product intake, many experimental animal studies involved direct dosing with genistein aglycone. Some experimental animal studies examined the toxicokinetics of genistein following consumption of soybean-based animal feeds. Those studies are described in the CERHR Expert Panel Report on Soy Formula (Rozman et al., 2006). Some secondary review sources were used in preparation of the animal toxicokinetics discussion. Primary studies conducted in pregnant or neonatal animals or that provided information on genistein distribution to reproductive organs were also evaluated.
2.1.2.1 Absorption
As noted in Table 13, genistein is rapidly absorbed in rodents following oral or subcutaneous (s.c.) exposure and circulates largely as glucuronide conjugates. Figure 2 of the report of Coldham and Sauer (2000) demonstrated that, as expected, tmax is very short for genistein, in contrast to the glycoside.
Table 13.
Blood Genistein Levels in Rodents Fed Phytoestrogen-Free Diets and Dosed With Genistein
| Serum genistein, nM [μg/L] |
||||||
|---|---|---|---|---|---|---|
| Gestation or postnatal age, no. of animals | Route, duration | Dose(s) | Total | Aglycone | % Aglycone (serum) | Reference |
| Sprague-Dawley rat | ||||||
| Dams and fetuses on GD 20 or 21, n 51 dam/litter (11–16 fetuses)/dose group | Oral (gavage), single treatment of dam on GD 20 or 21 | 20 mg/kg bw | Dams: 3540 [956]
Fetuses: 270±20 [73±5]a |
Dams: 270 [73]
Fetuses: 80±10 [22±3]a |
Dams: 8
Fetuses: 31 |
Doerge et al., 2001 |
| 34 mg/kg bw | Dams: 5480 [1480]
Fetuses: 190±20 [51±5] |
Dams: 290 [78]
Fetuses: 60±10 [16±3] |
Dams: 5
Fetuses: 34 |
|||
| 75 mg/kg bw | Dams: 4410 [1191]
Fetuses 220±20 [59±5] |
Dams: 780 [211]
Fetuses: 60±10 [16±3] |
Dams: 18
Fetuses: 27 |
|||
| PND 1–2 males and females, n 52–3 pups from two different litter pools | Oral (diet), pups exposed indirectly during gestation and lactation | 500 ppm (50 mg/kg bw/day in dams) | 176±307 [48]d | 47 [13] | 53 [27% by CERHR calculation] | Doerge et al., 2001 |
| Dams and PND 7 and 21 pups, number examined not reported | Oral (diet), dams exposed during gestation and lactation | 0 | Dams: 6±3 [2±0.8]a
PND 7: 9 [2] PND 21: 6±1 [2±0.3]a |
Dams: 6±3 [2±0.8]a
PND 7: 9 [2] PND 21: 6±1 [2±0.3]a |
Dams: 100
PND 7: 100 PND 21: 100 |
Fritz et al., 1998 |
| 25 ppm | Dams: 40±19 [11±5]
PND 7: 86 [23] PND 21: 54±6 [15±2] |
Dams: 9±3 [2±0.8]
PND 7: 16 [4] PND 21: 18±5 [5±1] |
Dams: 23
PND 7: 19 PND 21: 33 |
|||
| 250 ppm | Dams: 418±198 [113±53]
PND 7: 726 [196] PND 21: 1810±135 [489±36] |
Dams: 7±3 [2±0.8]
PND 7: 103 [28] PND 21: 120±14 [32±4] |
Dams: 1.7
PND 7: 14 PND 21: 6.6 |
|||
| PND 21/PND 140 offspring, Males and females (n 55–6/group) | Oral (diet), mothers of offspring exposed through pregnancy and lactation, rats received mother’s diet at weaning | 0 | <10/<10 [<3] | Not reported | 1–5 % in all dose groups of both ages | Chang et al., 2000 |
| 5 ppm [~0.4–0.5 mg/kg bw/day] | PND 21: 22±4 [6±1] (male), 20±3 [5±0.8] (female)c
PND 140: 60±6 [16±2] (male), 100±8c [27±2] (female) |
Not reported | ||||
| 100 ppm [~8–10 mg/kg bw/day] | PND 21: 270±80 [73±22] (male), 520±160 [140±43] (female)
PND 140: 590±30 [159±8] (male), 940±210 [254±57] (female) |
Not reported | ||||
| 500 ppm [~40–50 mg/kg bw/day] | PND 21: 2090±650 [564±176] (male), 1870±300 [505±81] (female)
PND 140: 6000±650 [1620±2144] (male), 7940±2470 [2144±667] (female) |
Not reported | ||||
| PND 91, female, n 54 | Oral (diet), 21 days starting at PND 70 | 750 ppm | 2200±10 [584±3]c | 400±30 [108±81]c | 18.2 | Santell et al., 1997 |
| PND 70, male, n 58/group | Oral (diet), exposed indirectly during gestation and lactation, and then directly until PND 70 | 0 ppm | 18±3 [5±0.8]a | 0 | 0 | Fritz et al., 2002b |
| 25 ppm | 167±31 [14±8] | 6±3 [2±0.8]a | 3.6 | |||
| 250 ppm | 1908±351 [515±95] | 20±6 [5±2] | 1.0 | |||
| PND 70, male, n 58/group | Oral (diet) on PND 57–65 and gavage on PND 66–70 | 0 | 28±8 [8±2]a | 6±0 [2±0]a | 21.4 | Fritz et al., 2002b |
| 250 ppm diet and 22 mg/kg bw/day gavageb | 1785±218 [482±59] | 32±7 [7±2] | 1.8 | |||
| 1000 ppm diet and 88 mg/kg bw/day gavageb | 9640±798 [2602±215] | 41±6 [11±2] | 0.43 | |||
| Adult, female dams, n 54/group | Oral (diet) on GD 7–PND 21 | 250 ppm | 2100 [567] | 30 [8] | 1.4 | Holder et al., 1999 |
| PND 63, female offspring, n 510/group | Oral (diet), exposed indirectly during gestation (from PND 7) through lactation (PND 21) and then directly on PND 21– 63 | 250 ppm | 1310 [354] | 38 [10] | 2.9 | |
| 1250 ppm | 5300 [1431] | 150 [40] | 2.8 | |||
| Adult, male and female, n 510/group; n 57–10/group | Oral (diet), [duration of treatment not clearly reported] | 25 ppm (2 mg/kg bw/day) | ≤250 [≤68]e | Not reported | Not reported | Holder et al., 1999 |
| 250 ppm (20 mg/kg bw/day) | 1500 [405] (male), 2000 [540] (female) | Not reported | Not reported | |||
| 1250 ppm (100 mg/kg bw/day) | 6000 [1620] (male)
9000 [2430] (female) |
Not reported | Not reported | |||
| 11 Weeks, female, n 52–8 | Oral (diet) for 3 weeks, beginning at 8 weeks of age | 0 | 49±23 [13±6]a | Not reported | Not reported | Cotroneo and Lamartiniere, 2001 |
| 250 ppm (estimated 16 mg/kg bw/day) | 1115±552 [301±149] | 138±9 [37±2]a | 12 | |||
| 1000 ppm | 2031±271 [548±73] | 446±35 [120±9] | ||||
| 11 Weeks, female, n 54–5 | s.c. for 3 weeks, beginning at 8 weeks of age, blood was collected 16–18 hr after last injection | 0 | 4±2 [1±0.5]a | Not reported | Not reported
48 44 |
Cotroneo and Lamartiniere, 2001 |
| 5 mg/kg bw/day | 450±180 [122±49] | Not reported | ||||
| 16.6 mg/kg bw/day | 1380±250 [373±68] | 662±94 [179±25]a | ||||
| 50 mg/kg bw/day | 5090±700 [1374±189]a | 2243±477 [606±129]a | ||||
| PND 21, 50, and 100, female, n 56–9 | s.c., single dose given at 21, 50, or 100 days of age; blood was collected 16–18 hr after injection | 500 mg/kg bw | 21 days: 5558±1434 [1501±387]a | 21 days: 1956±114 [528±31]a | 21 days: [35] | Cotroneo et al., 2001 |
| 50 days: 39±12 [11±3] | 50 days: 16±6 [4±2] | 50 days: [41] | ||||
| 100 days: 13±1 [4±0.3] | 100 days: 6±1 [2±0.3] | 100 days: [46] | ||||
| CD-1 mouse | ||||||
| PND 1–5, male/female, n 53–8/sex/time period | s.c., PND 1–5 [It was not stated if the diet fed to mice was phytoestrogen-free.] | 50 mg/kg bw/day, mice were killed between 0.5 and 24 hr following injection. | 38007±100 [1026±2997] (male)
6800±1400 [1836±378] (female)d |
[~1400 [378] (male), ~2300 (female) [621]]e | 31 | Doerge et al., 2002 |
GD, gestational day; PND, postnatal day; s.c., subcutaneous. Conversions to μg/L refer to genistein equivalents.
Values assumed to be expressed in means±variance [undefined].
Dietary and gavage treatment provided equivalent doses. [Gavage doses said to be equivalent to dietary doses, which suggests that feed intake was about 36 g/rat. This estimate appears reasonable to the Expert Panel.]
Expressed as mean±SEM.
Expressed as mean±SD.
Values estimated from a graph by CERHR.
The UK Committee on Toxicity (2003) reviewed studies that provided information on absorption and bioavailability of isoflavones. One study in mice demonstrated that bioavailability of genistein was 12% following oral gavage with 180 mg/kg bw, and that plasma levels following intraperitoneal (i.p.) injection with 185 mg/kg bw genistein were about 5 times higher than levels observed with oral dosing. [The Expert Panel noted that differences in bioavailability with oral versus parenteral exposure suggests implications for the role of metabolism by the gut wall or gut microbes. Similarly, subcutaneous exposure does not reflect oral exposure with respect to kinetics. The Expert Panel also noted that bioavailability is much lower in humans and rats.]
2.1.2.2 Distribution
In a review, Whitten and Patisaul (2001) summarized experimental animal toxicokinetic data on genistein (Table 14). Additional information on genistein toxicokinetics following intake from soy products is included in the CERHR Expert Panel Report on Soy Formula (Rozman et al., 2006).
Table 14.
Experimental Animal Toxicokinetic Data on Genistein
| Route | Species | Dose (mg/kg bw/day)a | Cmax (nM) [μg/L] | Tmax (hr) | Plasma half-life (hr) | Recovery (%) |
|---|---|---|---|---|---|---|
| Oral | Rat | ~8 | 600–900 [162–243] | Not reported | Not reported | Not reported |
| Oral | Rat | 20 | 11,000 [2973] | 2 | 8.8 | 20 |
| Oral | Rat | 45 | 2200 [595] | 2 | Not reported | Not reported |
| Oral | Rat | ~40 | 6000–8000 [1621–2162] | Not reported | 3–4 | Not reported |
| Oral | Mouse | 45 | 2600 (free) [703] | 0.3 | 4.8 | 20 |
| Oral | Mouse | 54–180 | 4100 (free) [1108] | 0.05 | 4.7 | 21 |
| Oral | Mouse | 50 | 1500 (free) [405] | 0.5 | 8 | 11 |
| i.v. | Mouse | 52 | 237,000 [64,047] | Not applicable | Not reported | Not reported |
| Oral | Rhesus macaque | 7 | 55 (free+sulfate) [15] | Not reported | Not reported | Not reported |
i.v., intravenous. To convert nM to genistein equivalents in μg/L, multiply by 0.27.
It is assumed that animals were exposed to the aglycone.
From a review by Whitten and Patisaul (2001).
In a mass-balance study of rats gavaged with 4 mg/kg bw 14C-genistein, Vd was reported at 1.27–1.47 L (Coldham and Sauer, 2000). [This finding suggests that most of the circulating radioactivity was not genistein but the glucuronide. Plasma protein binding ranged from 77.3–97.7%, with males exhibiting much higher binding than females. It is possible that this gender difference was due to much higher levels of 17β-estradiol in females, which would displace genistein from protein binding sites. The shorter half-life in females than in males is compatible with a rough correlation between protein binding and half-life of drugs.] Radioactivity was distributed throughout the body, with levels in reproductive organs (vagina, uterus, ovary, and prostate) higher than levels in other organs (brain, fat, thymus, spleen, skeletal muscle, and bone).
Doerge et al. (2001) evaluated the appearance of maternally administered genistein (>99% purity) in Sprague-Dawley rat pups evaluated shortly after birth. Pregnant animals were exposed either in the diet or by gavage. The basal diet was a soy- and alfalfa-free diet (5K96) in which genistein and daidzein levels were determined using HPLC-MS analysis (after hydrolysis of glucoside conjugates) to be 0.54 μg/g feed (genistein) and 0.48 μg/g feed (daidzein). Animals treated with dietary genistein were given feed with genistein aglycone 500 μg/g feed [500 ppm; 0.05%]. Based on feed consumption of 30 g/day and 300 g rat weight, the authors estimated daily genistein doses of 0.05 and 50 mg/kg bw with control and genistein-supplemented diets, respectively [neither feed intake nor body weight were reported]. Genistein was measured in excess pups that were born in a multigenerational study. [The duration of treatment was not specified in the current paper, but in a preliminary study by these authors (Delclos et al., 2001), genistein-supplemented feed was given from the day a vaginal plug was detected (GD 0).] The pups were killed at the time of litter standardization on PND 1 or 2. Trunk blood was collected by decapitation. Eight dams on the genistein-treated diet contributed 18 individual pups plus an additional two samples that were pooled from two or more pups in the same litter. Total serum genistein levels in pups were measured at a mean±SD of 176±307 nM [corresponding to 48±83 μg/L genistein aglycone equivalents]; genistein aglycone was measured at 47 nM [13 μg/L], or 53% of the total genistein. [CERHR calculated that aglycone represents 27% of total genistein. The Expert Panel noted that the large SDs suggest a skewed distribution for which the mean may not be the best estimate of central tendency. The article noted that the mean±SD serum concentration from the eight litters (presumably unpooled fetuses) born to dams given genistein-supplemented feed was 216±282 nM (genistein aglycone equivalent 58±76 μg/L) with a range of 46–955 nM (corresponding to genistein aglycone 12–258 μg/L).] Four pups were analyzed from two litters exposed to the control diet, giving a mean7SD total genistein level of 371 nM [genistein aglycone equivalent 0.8±0.3 μg/L].
In a separate experiment, female Sprague-Dawley rats were maintained on the soy- and alfalfa-free diet for life. Animals were mated [age not specified], and 20 or 21 days after a vaginal plug, a single gavage dose of genistein was given. Dose levels were 20, 34, and 75 mg/kg bw [n = 1 pregnant animal per dose]. Pregnant rats were killed 2 hr after the gavage treatment, and fetuses were surgically removed. Trunk blood was collected by decapitating fetuses, and maternal blood was collected by cardiac puncture. [It is not indicated whether fetal blood was pooled within litters or analyzed separately for each fetus. Adult concentrations are presented as single values without SD, and offspring values are presented as mean±SD, suggesting that single dams were used for each dose group and that fetuses were analyzed individually. A subsequent comment in the Results section raises the possibility that fetal sera were pooled for analysis, which would make inexplicable the use of mean and SD.] Maternal and fetal brains were frozen for later analysis of tissue genistein. Serum total and aglycone genistein levels are summarized in Table 13. Brain genistein levels are shown in Table 15.
Table 15.
Brain Genistein Concentration After a Single Maternal Gavage Dose of Genistein on GD 20 or 21
| Brain genistein concentration (pmol/mg [μg/kg] tissue)
|
||||
|---|---|---|---|---|
| Adult
|
Fetus
|
|||
| Dose (mg/kg) | Total | Aglycone | Total | Aglycone |
| 20 | 0.25 [68] | 0.22 [59] | 0.21±0.004 [57±1] | 0.19±0.004 [51±1] |
| 34 | Not reported | Not reported | Not reported | Not reported |
| 75 | Not reported | Not reported | 0.23±0.03 [62±8] | 0.21±0.04 [57±11] |
n = 1 dam (litter) per dose group, 3–4 fetuses/litter for brain determinations. Error is SD.
From Doerge et al. (2002).
The authors concluded that placental transfer into fetal blood and brain probably involved the aglycone, perhaps after placental hydrolysis of conjugated forms. The higher proportion of the aglycone in the fetus was considered consistent with limited conjugation ability in the fetal rat.
Soucy et al. (2006), supported by the American Chemistry Council, evaluated genistein distribution and toxicokinetics in Crl:CD(SD) rats treated by gavage on GD 5–19 or just on GD 19 (plug = GD 0). Genistein was administered in sesame oil at 0, 4, or 40 mg/kg bw/day. Genistein, genistein glucuronide, and genistein sulfate were measured in maternal plasma, fetal plasma (pooled by litter), and placentas. Detailed results were given for the 40 mg/kg bw/day dose level (Table 16). Most of the genistein was present in maternal and fetal plasma as the glucuronide at both dose levels. Unconjugated genistein was the most abundant form in placenta. Genistein appeared in amniotic fluid increasingly as the glucuronide during the 24 hr after the last dose on GD 19. Genistein was present in fetal liver largely as the glucuronide, peaking 8 hr after the last dose at about 300 μmol/kg tissue [134 μg/kg tissue, estimated from a graph]. Unconjugated genistein peaked in fetal brain at about 60 μmol/kg tissue [16 μg/kg tissue, estimated from a graph]; conjugates were present at only small amounts in brain. Genistein and its conjugates were below the limits of detection in pooled fetal reproductive organs.
Table 16.
Toxicokinetic Data in Pregnant Rats Treated With Genistein 40 mg/kg bw/day
| Cmax, nM or ng/kg [μg/L or μg/kg] |
Tmax, hr
|
AUC, hr-nM or hr-ng/kg [hr-μg/L or hr-μg/kg] |
Half-life, hr
|
Clobs, L/hr
|
||||||
|---|---|---|---|---|---|---|---|---|---|---|
| Treatment Period
|
||||||||||
| Compartment | GD 19 | GD 5–19 | GD 19 | GD 5–19 | GD 19 | GD 5–19 | GD 19 | GD 5–19 | GD 19 | GD 5–19 |
| Maternal plasma | ||||||||||
| Genistein | 95.6±2.3 [26±0.6] | 137±58.8 [37±16] | 4.8±5.0 | 3.4±3.0 | 536±112 [145±30] | 704±272 [190±73] | 3.6±0.9 | 3.9±0.5 | 77.3±46.7 | 60.5±31.7 |
| Glucuronide | 8566±1334 [3820±595] | 10,438±2002 [4655±893] | 1.9±1.9 | 2.8±2.2 | 42,883±34,505 [19,126±15,389] | 65,521±12,501a [29,222±5575] | 4.3±0.8 | 4.7±1.2a | 0.61±0.27 | 0.41±0.06a |
| Sulfate | 551±181 [193±63] | 557±99.7 [195±35] | 1.5±1.7 | 4.0±2.3 | 3637±2105 [1273±737] | 3557±1574 [1245±551] | 4.3±1.1 | 4.6±1.3 | 13.2±7.70 | 10.8±3.91 |
| Placenta | ||||||||||
| Genistein | 1088±234 [294±63] | 2208±282 [596±76] | 5.2±2.3 | 6.0±2.0 | 14,040±4636 [3791±1252] | 26,332±3952a [7110±1067] | 5.4±1.2 | 3.0±1.3 | 4.05±1.32 | 2.05±0.269a |
| Glucuronide | 238±104 [106±46] | 445±134 [198±60] | 1.5±0.7 | 2.6±1.3 | 2077±471 [926±210] | 4238±582a [1890±260] | 5.3±1.1 | 3.8±1.0 | 14.8±4.0 | 7.28±0.87a |
| Sulfate | 60.9±15.7 [21±5] | 88.6±14.3 [31±5] | 8.4±3.6 | 9.6±3.6 | 700±320 [245±112] | 1211±163a [424±57] | 4.8±1.0 | 5.6±2.3 | 64.2±29.4 | 33.9±3.80a |
| Fetal plasma | ||||||||||
| Genistein | 44.8±5.6 [12±1.5] | 43.6±8.80 [12±1.4] | 5.8±4.6 | 4.8±3.0 | 358±120 [97±32] | 339±40 [92±11] | 5.1±0.9 | 4.2±0.3 | 90.2±1.65 | 64.0±61.3 |
| Glucuronide | 1249±247 [557±110] | 1525±270 [680±120] | 7.5±3.4 | 9.5±3.0 | 14,451±1027 [6445±458] | 20,346±5105 [9074±2277] | 6.9±1.0 | 7.3±0.5 | 1.46±0.06 | 1.76±0.38 |
| Sulfate | 608±254 [213±89] | 745±99.4 [261±35] | 9.5±3.0 | 9.5±3.0 | 6940±945 [2429±331] | 8788±3125 [3076±1094] | 7.1±0.7 | 6.9±0.6 | 4.19±0.58 | 5.92±0.05 |
Data presented as mean±SD; n not given but n = 4/data point for some figures in this study.
Values significantly different from those obtained after single GD 19 dose.
From Soucy et al. (2006).
Fritz et al. (1998), funded by the National Institutes of Health (NIH), treated 7-week-old female Sprague-Dawley rats with dietary genistein (98.5% pure, with 1.5% methanol) at 0, 25, or 250 mg/kg diet [ppm]. The basal diet was AIN-76A, a phytoestrogen-free rodent feed. At 9 weeks of age, females were bred 2:1 with males that had been placed on the same diet as the females at the time of mating. Offspring were sexed at birth. Litters were standardized to 10 pups with 4–6 females. Offspring were weaned on PND 21. Genistein concentrations were determined by GC-MS in maternal serum during the lactation period (day not specified), in milk obtained by milking the dams under anesthesia, in serum from PND 7 pups (pooled by litter), in serum from PND 21 pups, and in milk from the stomach of PND 7 and 21 pups. Pup mammary tissue was also assayed for genistein on PND 7 and 21. Genistein concentrations were measured before and after incubation with β-glucuronidase/sulfatase enzymes to distinguish between free and conjugated genistein. Blood genistein levels are listed in Table 13, and milk and mammary gland levels are listed in Table 17. In serum of dams, free genistein represented 23% of genistein concentration at the low dose and 2% of the total genistein concentration at the high dose. Free genistein represented 7–33% of total genistein concentration in pup serum. [There were no obvious patterns related to dose or age.] The authors noted that a larger proportion of the genistein in milk from the pups’ stomachs was free (78–97%) compared to milk from the dams’ nipples (57%), suggesting that genistein conjugates may be hydrolyzed in the pup stomach. They also noted that the PND 21 pup data on genistein would reflect ingestion of treated maternal feed as well as transfer of genistein in milk.
Table 17.
Genistein Concentrations in Rats Fed AIN-76 Diet Supplemented With Genistein
| Genistein concentration in feed (ppm)
|
|||
|---|---|---|---|
| Source | 0 | 25 | 250 |
| Lactating dam (postpartum day 7 and 21) | |||
| Milk from nipples, nM | |||
| Total | Not determined | 67±10 | 137±34 |
| Free | Not determined | Not determined | 78±13 |
| Offspring, PND 7 | |||
| Milk from stomach, nM | |||
| Total | 9±2 | 490±62 | 4439±1109 |
| Free | Not determined | 473±94 | 3454±298 |
| Mammary gland, nmol/kg tissue | |||
| Total | Not determined | Not determined | 440±129 |
| Free | Not determined | Not determined | 318±56 |
| Offspring, PND 21 | |||
| Mammary gland, nmol/kg tissue | |||
| Total | Not determined | 0 | 370±36 |
| Free | Not determined | Not determined | 304±13 |
Doerge et al. (2000) noted that the Fritz et al. (1998) study reported the proportion of total genistein in aglycone form at 72% in rat mammary gland [82% by CERHR calculation] (Table 17). Based on this observation, Doerge et al. (2000) raised the possibility of accumulation of aglycones in tissues or of hydrolysis of glycosides within tissues. [Most likely the aglycone but not the glucuronide partitions between dam blood fat (0.2%) and milk fat (3%) according to the lipid content of these two compartments, which represents a 15-fold accumulation reflected in the milk from the offspring stomachs.] In their own study of lactational transfer of genistein, Doerge et al. (2006) placed 10 pregnant Sprague-Dawley rats on a soy-free diet (5K96) until delivery, when half the dams were maintained on the basal diet and half were given feed to which genistein 500 ppm was added. Based on actual feed consumption, the genistein-treated group received a mean±SD genistein dose of 51±1.8 mg/kg bw/day. Milk was aspirated from dam nipples after oxytocin administration on PND 7 and blood was collected from dams and pups on PND 10. Conjugated and free genistein were assayed in milk and serum by LC-MS-MS. No genistein was detected in the milk of control rats. Findings in genistein-treated rats are summarized in Table 18. There was no correlation between PND 7 milk genistein concentration and PND 10 maternal serum genistein concentration, and there was no relationship between pup serum total or aglycone genistein concentrations and milk concentrations.
Table 18.
Lactation Transfer of Genistein in Rats Given 500 ppm in Diet
| Genistein concentrations, μM [aglycone equivalent mg/L] |
||||||
|---|---|---|---|---|---|---|
| Dam
|
Pup
|
|||||
| Matrix | Total | Aglycone | % Free | Total | Aglycone | % Free |
| Milk (PND 7) | ||||||
| Mean±SD | 0.47±0.21 [0.127±0.057] | 0.14±0.08 [0.038±0.022] | 30 | |||
| Range | 0.28–0.81 [0.076–0.219] | 0.07–0.24 [0.019–0.065] | 18–52 | |||
| Serum (PND 10) | ||||||
| Mean±SD | 1.22±1.30 [0.329±0.351] | 0.042±0.037 [0.011±0.010] | 2.4a | 0.039±0.011 [0.011±0.003] | 0.001±0.001 [0.0003±0.0003] | 2.6 |
| Range | 0.15–2.99 [0.041–0.807] | 0.003–0.062 [0.001–0.017] | 1.7–17 | 0.022–0.053 [0.006–0.014] | <LOD–0.002 [<LOD–0.0005] | 1.2–4.6 |
n =5 litters; LOD, limit of detection.
Outlier excluded by authors in calculation.
From Doerge et al. (2006).
Higher free genistein levels in rat tissues than rat blood were demonstrated by McClain et al. (2006b). Male and female rats were fed diets providing genistein doses of 0.5–500 mg/kg bw/day for 4 weeks or 5–500 mg/kg bw/day for 13, 26, or 52 weeks. Complete details of the study are included in Section 2.2.1. In plasma, free genistein represented small amounts of the total genistein value [most often ≤3%; one sample had a mean value of 22%]. Percentages of free genistein were higher in liver [33–<100%] and kidney [11–97%] than plasma. The study authors could not provide an explanation for the higher levels of free versus total genistein levels in some liver samples. Total blood genistein levels in males ranged from 504–1,896 nM [136–512 μg/L] at 5 mg/kg bw/day, 3871–16,227 nM [1046–4385 μg/L] at 50 mg/kg bw/day, and 22,560–52,319 nM [6097–14,139 μg/L] at 500 mg/kg bw/day. The equivalent blood concentration in females rats at each dose level were 169–2053 nM [46–555 μg/L], 1947–6192 nM [526–1673 μg/L], and 22,250–90,686 nM [6013–24,507 μg/L].
McClain et al. (2005) reported a limited number of toxicokinetics parameters in three beagle dogs/sex/group administered capsules containing genistein doses of 0, 50, 150, or 500 mg/kg bw/day for 4 weeks. The dogs were fed a diet containing soybean extraction meal that exposed them to an additional 23 mg/day or 2.3 mg/kg bw/day genistein. On the first and last day of treatment, blood samples were drawn over a 24-hr period to determined free and total genistein levels in plasma. Free and total genistein levels were measured in liver following the last day of treatment. HPLC/MS was used to measure genistein levels prior to and following enzymatic hydrolysis. Results are summarized in Table 19. Free unconjugated genistein in plasma represented ~10% of total genistein levels. [Free genistein in liver represented 22–48% of total genistein level.] Genistein levels peaked in plasma at 2–4 hr following treatment and returned to pretreatment values within 24 hr following dosing. The study authors noted non-dose-dependent increases in plasma genistein levels over the dose ranges used in this study.
Table 19.
Toxicokinetic Parameters in Dogs Administered Genistein-Containing Capsules for 4 Weeks
| Day 1
|
Day 28
|
|||||||
|---|---|---|---|---|---|---|---|---|
| Dose, mg/kg bw/day | Sex | Cmax/dose in nM [μg/L] | AUC(0–24), hr-nmol/L [hr-μg/L] | Tmax, hr | Cmax/dose in nmol/L [μg/L] | AUC(0–24), hr-nmol/L [h-μg/L] | Tmax, hr | Day 28 liver concentration in nmol/kg [μg/kg] |
| Free genistein | ||||||||
| 0 | Male | Undetecteda | Undetecteda | Undetecteda | Undetecteda | Undetecteda | ||
| Female | Undetecteda | Undetecteda | Undetecteda | Undetecteda | Undetecteda | |||
| 50 | Male | 401±167 [108±45] | 2331±1125 [630±304] | 1.7 | 155±37 [42±10] | 911±365 [246±99] | 2.3 | 284±69 [77±19] |
| Female | 552±124 [149±34] | 4063±1602 [1098±433] | 4.7 | 217±70 [59±19] | 1460±524 [395±142] | 4.0 | 280±88 [76±24] | |
| 150 | Male | 702±364 [190±51] | 5461±2607 [1476±399] | 2.0 | 284±113 [77±31] | 2364±1211 [639±327] | 9.0 | 799±534 [216±144] |
| Female | 743±176 [201±54] | 6233±917 [1682±248] | 4.0 | 620±226 [168±61] | 5874±714 [1587±193] | 4.0 | 2794±2064 [755±558] | |
| 500 | Male | 870±246 [235±64] | 8212±4211 [2219±1138] | 2.7 | 886±101 [239±27] | 9845±5014 [2661±1355] | 2.7 | 1619±1010 [438±273] |
| Female | 677±129 [183±35] | 6150±571 [1662±154] | 4.0 | 796±136 [215±37] | 7904±3373 [2136±912] | 5.3 | 3873±3448 [1047±932] | |
| Total genistein | ||||||||
| 0 | Male | 163±25 [44±6.8] | 2195±163 [593±44] | 218±63 [59±17] | 2922±577 [790±156] | 187±44 [51±12] | ||
| Female | 278±185 [75±50] | 3260±1992 [881±538] | 502±320 [136±86] | 5889±3389 [1591±916] | 109±55 [29±15] | |||
| 50 | Male | 4586±1094 [1239±296] | 47,616±17,584 [12,868±4752] | 2.0 | 2612±1300 [706±351] | 19,807±9738 [5353±2632] | 2.3 | 1287±450 [348±122] |
| Female | 7998±1182 [2161±319] | 75,185±16,207 [20,318±4380] | 4.7 | 2490±228 [673±62] | 23,659±9455 [6394±2555] | 2.7 | 1008±410 [272±111] | |
| 150 | Male | 7789±2489 [2105±673] | 80,792±24,524 [21,833±6627] | 4.0 | 2220±224 [600±61] | 26,350±224 [7121±61] | 10 | 2245±1369 [607±370] |
| Female | 10,651±666 [2878±180] | 101,635±18,517 [27,466±5004] | 5.3 | 10,021±1516 [2708±410] | 108,459±9203 [29,310±2487] | 6.7 | 5865±3375 [1585±912] | |
| 500 | Male | 11,469±3486 [3099±942] | 116,512±63,104 [31,486±17,053] | 4.0 | 12,870±4501 [3478±1216] | 165,434±86,251 [44,707±23,309] | 3.3 | 4634±2672 [1252±722] |
| Female | 10,256±2983 [2772±806] | 115,284±7136 [31,154±1928] | 4.0 | 14,426±4369 [3898±1181] | 156,050±29,772 [42,171±8046] | 5.3 | 9728±10,411 [2629±2813] | |
Values presented as mean±SD.
Detection limit of 5 ng/mL for plasma and 10 ng/g for liver.
From McClain et al. (2005).
Chang et al. (2000) funded by the National Center for Toxicological Research/Food and Drug Administration (NCTR/FDA), the National Institute of Environmental Health Sciences (NIEHS), and the National Toxicology Program (NTP), measured serum and tissue genistein (after enzymatic deconjugation) in Sprague-Dawley rats exposed to genistein in the diet. The basal diet was an alfalfa- and soy-free diet that contained 0.54 μg/g feed [ppm] genistein and 0.48 μg/g [ppm] daidzein. Treatment groups were born to female rats that (along with sires) had been exposed to genistein [purity not specified] at 0, 5, 100, or 500 μg/g feed (ppm) since weaning. [Feed consumption and weight were not specified; assuming a 300 g female rat eats 30 g feed/day, additional genistein exposures would have been 0, 0.5, 10, or 50 mg/kg bw/day. A 500 g male rat eating 40 g feed/day would have been exposed to additional genistein at 0, 0.4, 8, or 40 mg/kg bw/day.] Six litters per dose group were born to and raised by treated dams [litter size or standardization not specified]. Blood samples were taken from one pup/sex/litter at weaning on PND 21 [plug day not specified], and one pup/sex/litter was continued on its dam’s diet until PND 140. Blood samples were obtained from the tail vein 0, 4, 8, and 12 hr after removal from feed. [It is possible that rats sampled on PND 140 were also sampled at weaning, but the methods are not clear on this issue. The method of sampling weanling rats was not indicated. On the day after tail vein sampling of PND 140 rats, these animals were killed and blood collected by cardiac puncture.] Methanolic extracts of mammary gland, thyroid, liver, brain, and (in males) prostate and testis, or (in females) uterus and ovary were obtained from PND 140 rats and analyzed for genistein. The method of genistein analysis was LC-electrospray/MS or tandem MS.
Serum total genistein values in weanling and PND 140 rats are given in Table 13; values were obtained soon after removing the animals from feed, although the time of last feeding was not reported. Two-way analysis of variance (ANOVA) showed a significant effect of sex and dose on total serum genistein in PND 140 rats and an interaction of sex × dose. There was no effect of sex on serum genistein in weanling rats. The authors noted that exposure of PND 21 animals was likely through milk and through ingestion of the dams’ feed ration. The authors indicate that 1–5% of genistein at both ages was unconjugated.
Genistein serum half-life and AUC for PND 140 rats are shown in Table 20 and contrasted with the data of Coldham and Sauer (2000). There was a statistically significant difference between males and females for both parameters. Tissue concentrations of genistein are given in Table 21. There was a significant treatment effect for total genistein and genistein aglycone for all tissues. Pair-wise comparisons to controls showed elevations of total genistein in all tissues except brain in males and females fed 100 and 500 ppm genistein. Brain genistein was elevated only in the 500 ppm group. In females, ovarian, uterine, and liver total genistein concentrations were increased with 5 ppm dietary genistein compared to the control group. The authors noted that the proportion of total genistein present as the aglycone in these tissues (10–100%) was greater than the proportion in rat serum (1–5%). They also found important the differences between males and females in elimination half-life, AUC, and genistein levels in mammary gland and liver. The authors attributed the increase in genistein in the female mammary gland to the higher lipid content in female than male mammary gland, but could not explain differences in liver genistein concentrations.
Table 20.
Genistein Pharmacokinetic Parameters in PND 140 Rats Exposed to Dietary Genistein at 500 ppma or a Single Oral Dose of 4 mg/kg bwb
| Serum half-life, hr
|
|||
|---|---|---|---|
| Sex | Chang et al.a | Coldham and Sauerb | AUC, μM-hr [μg-hr/L]a |
| Male | 2.97±0.14 | 12.4 | 22.3±1.2 [6000±300] |
| Female | 4.26±0.29 | 8.5 | 45.6±3.1 [12,000±800] |
Chang et al. (2000). Values are mean±SEM. n = 6 or 4–6 [both n designations appear in the paper].
Table 21.
Tissue Genistein Levels in PND 140 Rats Exposed to Dietary Genistein
| Dietary genistein (ppm)
|
||||||||
|---|---|---|---|---|---|---|---|---|
| 0
|
5
|
100
|
500
|
|||||
| pmol/mg tissue [μg/kg tissue genistein equivalent] |
||||||||
| Tissue | Male | Female | Male | Female | Male | Female | Male | Female |
| Mammary: Aglycone | Not done | Not done | Not done | Not done | 0.16±0.04 [44±11] | 0.12±0.02 [32±5] | 0.20±0.04 [54±11] | 1.18±0.22 [319±59] |
| Total | 0.020±0.004 [5±1] | 0.02±0.04 [5±11] | 0.020±0.002 [5±0.5] | 0.030±0.004 [8±1] | 0.33±0.05 [89±14] | 0.29±0.06 [78±16] | 0.83±0.16 [224±43] | 2.39±0.34 [646±92] |
| Thyroid: Aglycone | 0.040±0.01 [11±3] | 0.04±0.014 [11±4] | 0.060±0.07 [16±19] | 0.043±0.020 [12±5] | 0.060±0.01 [16±3] | 0.076±0.008 [21±2] | 0.11±0.03 [30±8] | 0.212±0.04 [57±11] |
| Total | 0.090±0.01 [24±3] | 0.047±0.009 [13±2] | 0.10±0.11 [27±30] | 0.061±0.012 [16±3] | 0.22±0.03 [59±8] | 0.277±0.052 [75±14] | 0.41±0.08 [111±22] | 1.15±0.23 [310±62] |
| Liver: Aglycone | <0.02 [<5] | 0.01 [3] | <0.02 [<5] | 0.06±0.01 [16±3] | 0.02 [5] | 1.07±0.21 [289±57] | 0.23±0.08 [62±22] | 5.66±1.31 [1528±354] |
| Total | <0.02 [<5] | 0.02 [5] | <0.02 [<5] | 0.12±0.01 [32±3] | 0.32±0.10 [86±27] | 1.68±0.39 [454±105] | 0.67±0.14 [181±38] | 7.33±1.62 [1979±437] |
| Brain: Aglycone | <0.02 [<5] | <0.02 [<5] | <0.02 [<5] | Not done | <0.02 [<5] | Not done | 0.04 [11] | 0.03 [8] |
| Total | <0.02 [<5] | <0.02 [<5] | <0.02 [<5] | Not done | <0.02 [<5] | Not done | 0.04 [11] | 0.06 [16] |
| Prostate: Aglycone | 0.020±0.006 [5±2] | Not done | 0.40±0.13 [108±35] | 0.49±0.18 [132±49] | ||||
| Total | 0.020±0.003 [5±0.8] | 0.030±0.003 [8±0.8] | 0.80±0.23 [216±62] | 1.09±0.23 [295±62] | ||||
| Testis: Aglycone | 0.020±0.003 [5±0.8] | Not done | 0.40±0.006 [108±2] | 0.07±0.01 [19±3] | ||||
| Total | 0.030±0.01 [8±3] | 0.040±0.004 [11±1] | 0.42±0.08 [114±22] | 0.63±0.12 [170±32] | ||||
| Ovary: Aglycone | Not done | Not done | 0.40±0.04 [108±11] | 0.85±0.09 [230±24] | ||||
| Total | 0.010±0.002 [3±0.5] | 0.059±0.026 [16±7] | 0.42±0.05 [114±14] | 1.07±0.11 [289±30] | ||||
| Uterus: Aglycone | Not done | Not done | 0.64±0.07 [173±19] | 1.43±0.33 [386±89] | ||||
| Total | 0.010±0.001 [3±0.3] | 0.037±0.006 [10±2] | 0.78±0.11 [211±30] | 1.42±0.27 [384±73] | ||||
Values are mean ± SEM, n = 6/sex/dose group. The number of significant figures is as in the original. The conversion to pg/mg tissue was rounded to the nearest integer if > 1.
From Chang et al. (2000).
[There is an apparent contradiction between the half-life data of Chang et al. (2000) and those of Coldham and Sauer (2000) in Table 20; however, Coldham and Sauer (2000) used a single low dose of 4 mg/kg bw, and Chang et al. (2000) used a high daily dose rate of 50 mg/kg bw. Greatly decreased half-life at high dose rates is probably due at least in part to saturation of glucuronidation and, hence, reduced enterohepatic circulation. At high genistein dose rates, 17β-estradiol cannot displace genistein from plasma protein binding any-more. It can be expected that a much smaller portion of the higher dose would be bound to plasma proteins, contributing to the lower half-life. The reversal of male:female half-life ratios at high daily dose rates is probably due to differential maximum velocity (Vmax) of various intestinal and possible hepatic UDPGTs.]
In a thyroid toxicity study that may have been conducted in these same animals, Chang and Doerge (2000) noted that higher levels of aglycone in thyroid suggested that non-polar aglycones preferentially partition into lipophilic tissues.
Lewis et al. (2003), funded by UK Foods Standards Agency, evaluated milk and serum concentrations of genistein in rats [strain not specified] as part of a study on developmental effects of lactation period exposure (reviewed in Section 3). Genistein (98.3% purity) was given to four lactating rats at a single oral dose of 16 mg/kg bw. Litter size was reduced to six after spontaneous delivery. Milk and plasma samples were taken every 24 hr for 5 days [method of collection not specified]. One pup/litter/day was killed and blood obtained for analysis. The experiment was repeated using 14C-genistein at 50 mg/kg bw. Genistein was quantified by LC with an ultraviolet detection system. Genistein metabolites were characterized by LC-MS following enzymatic digestion with β-glucuronidase/sulfatase. In an additional study, rat pups were dosed directly with either s.c. or oral genistein (either unlabeled or 14C-labeled) on PND 7. Doses were 0, 0.4, 4, or 40 mg/kg, given once, with cohorts of animals killed and blood collected at 0.5, 1, 2, 4, 6, 8, 12, and 24 hr after dosing. Quantification was by LC with ultraviolet detection.
The maximum concentration of genistein in maternal plasma was 180 μg/L [665 nM] without β-glucuronidase/sulfatase pretreatment and 1800 μg/L [6651 nM] after enzyme pretreatment. Time to peak plasma genistein in maternal plasma was 8 hr without enzyme pretreatment and 2 hr with enzyme pretreatment. Milk genistein peaked 1–3 hr after dosing at 40 μg/L [148 nM] for untreated milk and at 170 μg/L [628 nM] for enzyme-pretreated milk. After administration of 50 mg/kg bw radiolabeled genistein, peak plasma, erythrocyte, and milk genistein levels obtained in dams at 8 hr were 7100 μg equivalents [26,235 nmol]/kg in plasma, 800 μg equivalents [2956 nmol]/kg in erythrocytes, and 3700 μg equivalents [13,672 nmol]/kg in milk. Pup genistein peaked 24 hours after maternal dosing at 100 μg equivalent [370 nmol]/kg for both plasma and erythrocytes. The authors interpreted the results as showing that secretion of genistein into milk is approximately 0.04% of the maternal dose at 8 hr. Plasma concentrations after direct administration of genistein to PND 7 pups are shown in Table 22.
Table 22.
Plasma Concentration of Total Radioactivity after Administration of Single Doses of 14C-Genistein to Rat Pups on PND 7
| Dose (mg/kg bw)
|
||||||
|---|---|---|---|---|---|---|
| 0.4 | 4a | 40 | 0.4 | 4a | 40 | |
| Hour after dose | Male | Female | ||||
| Oral administration | ||||||
| 2 | 82±21 [303±78] | 910 [3367] | 19,400±2080 [71,788±7697] | 89±22 [329±81] | 761 [2816] | 9360±2190 [34,636±8104] |
| 4 | 20±5 [74±19] | 230 [851] | 2550±659 [9436±2439] | 24±8 [89±30] | 189 [699] | 5040±1680 [18,650±6217] |
| 8 | 26±1 [96±3.7] | 251 [929] | 1790±102 [6623±377] | 42±21 [155±78] | 272 [1007] | 1650±223 [6106±825] |
|
| ||||||
| AUCb | 460 [1702] | 4580 [16,948] | 56,800 [210,184] | 790 [2923] | 4760 [17,614] | 46,300 [171,329] |
|
| ||||||
| S.C. administration | ||||||
| 2 | 177±24 [655±89] | 834 [3086] | 7630±1580 [28,234±5847] | 163±26 [603±96] | 1140 [4218] | 9070±1130 [33,563±4181] |
| 4 | 86±12 [318±44] | 634 [2346] | 5130±388 [18,983±1436] | 132±9 [488±33] | 1160 [4292] | 7120±696 [26,347±2575] |
| 8 | 63±12 [233±44] | 171 [633] | 2550±1430 [9436±5292] | 90±3 [333±11] | 588 [2176] | 2540±307 [9399±1136] |
| AUCb | 780 [2886] | 5320 [19,686] | 38,300 [141,726] | 970 [3589] | 7520 [27,827] | 48,100 [177,990] |
Data expressed as μg genistein equivalents/L [nM]. Mean±SD, n = 4.
SD not given for 4 mg/kg dose.
AUC expressed in μg equivalents-hr/L [nM equivalents-hr].
From Lewis et al. (2003).
[There is an apparent contradiction between the report of Fritz et al. (1998) and the data provided by Lewis et al. (2003) regarding milk content of genistein or derivatives. Whereas Lewis et al. (2003) reported finding metabolites of genistein only in milk of dams given a single dose of 14C-genistein, Fritz et al. (1998) recovered mainly the parent compound from the stomach milk of pups. Fritz et al. (1998) administered genistein in the diet (500 ppm ≈ 50 mg/kg bw/day) and, therefore, genistein was at steady state, whereas a single genistein dose of 50 mg/kg bw given by Lewis et al. (2003) resulted in undetectable plasma levels after 24 hr. As discussed above, daily dosing with high dose rates of genistein over prolonged periods of time reduced the half-life of genistein dramatically, probably as a result of increased free fraction of the parent compound over the glucuronide. At steady state, equilibration between plasma and milk does occur, but not after a single dose, which is the most likely explanation for the observed discrepancy.] According to data available in abstract form, administration of 40 mg/kg bw genistein on GD 19 to pregnant rats resulted in fetal:maternal plasma ratios of 0.25 for genistein, 0.04 for genistein-7-O-glucuronide, 0.05 for genistein-4-O-glucuronide, and 0.55 for sulfate conjugates at 1 hr following dosing (Borghoff et al., 2003).
2.1.2.3 Metabolism
As in humans, most genistein in rats is conjugated with glucuronic acid by UDPGT prior to entering the systemic circulation. A study examining the ontogeny of UDPGT in rats (Coughtrie et al., 1988) is presented in Section 2.5.
Sfakianos et al. (1997) conducted a series of studies in female Sprague-Dawley rats to determine intestinal uptake and biliary excretion of genistein. The rats were fed soy- and isoflavone-free diets prior to the studies. During the studies, rats were anesthetized and 14C-labeled genistein was infused into the intestine or portal vein. Bile, sera, and serosal fluids were collected over periods of up to 4 hr following infusion. One to three rats were used in analyses to measure genistein and metabolite levels in body fluids or perfusates.
When 14C-genistein was infused into isolated duodenum, radioactivity appeared in bile within 20 min and reached equilibrium within 1 hr; biliary output of genistein metabolites decreased from 9.2% to 7.7% to 6.7% when the infusion rate was increased from 62 nmol/hr to 124 nmol/hr to 247 nmol/hr [17 μg/L/hr to 34 μg/L/hr to 67 μg/L/hr]. When genistein was infused into the duodenum and allowed to proceed down the intestinal tract, radioactivity peaked in bile within 80 min, thus demonstrating efficient intestinal uptake and biliary excretion; a total of 70–75% of the dose was recovered in bile within 4 hr. Analyses using HPLC-MS or HPLC following β-glucuronidase treatment confirmed that the primary metabolite in bile was genistein glucuronide. When collected bile was pooled, diluted, and reinfused into the duodenum or ileum, radioactivity was immediately detected in bile and continued to increase during the remaining 4-hr period (data not shown by study authors). In studies in which 14C-genistein was infused into the portal vein, efficient glucuronidation by liver and biliary excretion was demonstrated. Only genistein glucuronide was detected in peripheral blood when the infusion rate into portal vein was 0.77 nmol/min [0.21 μg/min], while both genistein glucuronide and genistein were detected in peripheral blood at an infusion rate of 8.82 nmol/min [2.4 μg/min]. Although glucuronidation by liver was demonstrated, collection of blood from the portal vein of a rat following a 1-hr duodenal infusion with 14C-genistein revealed that most of the radioactivity was represented by genistein glucuronide, thus indicating that glucuronidation occurs within the intestinal wall. To verify glucuronidation by the intestinal wall, everted intestinal sac preparations were filled with a solution containing 27 μM [7297 μg/L] genistein and incubated for 3 hr; both genistein and genistein glucuronide were detected inside the intestinal sac preparations. Based on the findings of this study, the study authors concluded that genistein undergoes efficient enterohepatic circulation. Glucuronidation within the intestinal wall was also demonstrated.
A study by Coldham and Sauer (2000), supported by the UK Ministry of Agriculture, Fisheries, and Food, reported that in adult rats gavaged with 4 mg/kg bw 14C-genistein, the major metabolites in plasma were genistein glucuronide and 4-hydroxyyphenyl-2-propionic acid, while parent compound was present at trace levels. Major urinary metabolites identified in this and previous studies in rats included genistein glucuronide, dihydrogenistein glucuronide, genistein sulfate, dihydrogenistein, 6′-hydroxy-O-demethylango-lensin, and 4-hydroxyphenyl-2-propionic acid. All metabolites except 4-hydroxyphenyl-2-propionic acid have also been identified in humans, suggesting common pathways in rats and humans. As in humans, genistein glucuronide was the most abundant plasma metabolite in rats. Parent compound was the predominant form of genistein in uterus, while in prostate the most abundant form was the metabolite 4-hydroxyphenyl-2-propionic acid.
Blood profiles of genistein in Sprague-Dawley rats dosed with genistein in diet as part of a dose range-finding study for a two-generation study are summarized in Table 13 (Holder et al., 1999). Most of the genistein in adult rats was present as glucuronide conjugates. A small percentage of total genistein was represented by aglycone [1.4–2.9%] and sulfate conjugates [<1.0–7.3%]. [Glucuronide levels exceeded total genistein levels.] Two different glucuronide conjugate isomers were identified: 4′-glucuronide and 7′-glucuronide.
Doerge et al. (2002), supported by the NCTR/FDA, NIEHS, and NTP, examined the pharmacokinetics of genistein administered by s.c. injection to neonatal mice. Male and female CD-1 mice were injected on PND 1–5 with genistein [purity not given] in corn oil at 0 or 50 mg/kg bw/day. The mice (n =3–8/sex/time period) were killed on PND 5 at time intervals between 0.5 and 24 hr following exposure, and blood was collected for a determination of toxicokinetic parameters. Levels of conjugated and unconjugated isoflavones were measured in serum using LC-electrospray MS. Toxicokinetic parameters are summarized in Table 23, and serum levels of total and aglycone genistein are reported in Table 13. The maximum serum concentration was reached in both sexes at 0.5 hr, the earliest sampling time point. In males and females, ~31% of genistein was present in aglycone form. [Based on Figures 2 and 3 of the study report, it appears that 31% aglycone was the mean value throughout the time period; values ranged from ~20–40%.] In a comparison with data generated in other studies, the percentage of aglycone was higher in neonatal mice than in adult rats (1–3%) and mice (6–16%) fed genistein in aglycone form. Compared to aglycone levels in fetuses or neonates of rats orally dosed with genistein during the gestation or lactation period, neonatal aglycone levels in this study were similar or lower than values reported in one study (31–53%) (Doerge et al., 2001) but higher than values reported in a second study (14–19%) (Fritz et al., 1998). The authors suggested that in addition to exposure route differences, interspecies and developmental factors could be responsible for variations in aglycone levels reported in different studies. The study authors concluded that metabolic differences between perinatal and adult animals have a greater impact on aglycone levels than route of administration.
Table 23.
Toxicokinetic Parameters in Neonatal Mice Given Genistein by s.c. Injection
| Genistein form | Sex | Elimination half-life, hr | AUC, nM-hr [μg-hr/L] | Vd, (L/kg) | Cmax, nM [μg/L] |
|---|---|---|---|---|---|
| Aglycone | Female | 12 | 33 [9] | 99 | 2300 [621] |
| Male | 16 | 38 [10] | 112 | 1400 [378] | |
| Conjugate | Female | 19 | 114 [31] | Not reported | 5000 [1350] |
| Male | 16 | 121 [33] | Not reported | 3000 [810] |
Genistein dose was 50 mg/kg bw/day for 5 days.
From Doerge et al. (2002).
Fig. 3.

Estimated genistein intake in the dietary treatment study of You et al. (2002a).
[Comparisons of serum aglycone levels in adult and fetal or neonatal rodents of the same study can be made from the rat data presented in Table 13. A s.c. dosing study conducted in rats demonstrated similar percentages of serum aglycone (35–46%) at PND 21, 50, or 100. One study with gavage exposure demonstrated higher aglycone percentages in fetuses (27–34%) than dams (5–18%) on GD 20 or 21 (Doerge et al., 2001). A dietary study in which dams were fed 25 or 250 ppm genistein did not consistently demonstrate higher percentages of aglycone in dams (1.7–23%) compared to pups on PND 7 (14–19%) or PND 21 (6.6–33%) (Fritz et al., 1998). In an evaluation of all the data in Table 13, percentages of free genistein following oral exposure of adult rats are usually below 10% but sometimes attain levels of ~20%. Percentages of aglycone following direct or indirect oral exposure to genistein in rat pups ≤21 days old were reported at 1–33%.]
A study of genistein effects on an experimental model of endometriosis (discussed in Section 4.2) compared the bioavailability of genistein administered to 8-week-old ovariectomized Sprague-Dawley rats through diet and s.c. injection (Cotroneo and Lamartiniere, 2001). The study results are summarized in Table 13. Genistein aglycone represented 12–23% of total genistein levels with dietary exposure and 44–48% of total genistein levels at the 2 highest s.c. doses. The study authors noted the higher levels of free genistein with s.c. compared to dietary dosing. [The values presented in this study are consistent with the body of data present in Table 13, although it is noted that studies were conducted using different methods. In general, serum genistein aglycone levels in adult rats were observed at ~ 1–20% following oral exposure and ~ 40–50% following s.c. exposure, which is consistent with the intestinal mucosa being the major site of glucuronidation. Only a small fraction of the dose (<20%) will come in contact with intestinal enzymes as opposed to 100% after oral dosing.]
A km value of 7.7 μM [2081 μg/L] and Vmax value of 1.6 μmol [432 μg]/mg protein-min were reported for formation of genistein glucuronide following in vitro incubation of genistein with rat liver microsomes (Zhang et al., 1999a).
2.1.2.4 Elimination
In a mass-balance study of rats gavaged with 4 mg/kg bw 14C-genistein, ~65% of the dose was excreted in urine and 33% in feces at 166 hr following dosing (Coldham and Sauer, 2000). About 90% of the dose was recovered within 48 hr following dosing. Elimination half-life was 12.4 hr in males and 8.5 hr in females. Total clearance was 1.18 mL/min in males and 2.0 mL/min in females. In pregnant rats treated by gavage with genistein 40 mg/kg bw/day on GD 5–19, mean±SD plasma clearance of unconjugated genistein was 64.0±61.3 L/hr (Table 16) (Soucy et al., 2006).
A study by Cotroneo et al. (2001) demonstrated that s.c. injection of rats with 500 mg/kg bw genistein on PND 21, 50, or 100 resulted in blood genistein levels that were ~2 orders of magnitude higher on PND 21 versus PND 50 or 100 (Table 13). [The Expert Panel noted that the higher blood genistein levels on PND 21 indicate reduced clearance in immature rats].
2.2 General Toxicology
2.2.1 General toxicity studies
McClain et al. (2006b) conducted a series of studies to examine toxicity of genistein in rats. Two acute studies were conducted in male and female 7-week-old Hanlbm Wistar rats and 8-week-old outbred Wistar Crl:(WI)BR rats. The Hanlbm Wistar rats were fed a genistein-free diet and the Wistar Crl:(WI)BR rats were fed standard animal diet. The rats were administered genistein (99.5–99.6% purity) in a single gavage dose of 2000 mg/kg bw and observed for 2 weeks. The rats were then killed and necropsied. Liver and kidney weights were measured in the Hanlmb rats. [The number of rats treated and observed was not stated.] All rats survived, and there were no gross effects at necropsy or changes in organ or body weights. In the Wistar Crl:(WI)BR rats, lethargy was noted in all males and one female on “day 1” and alopecia was observed on “days 14 and 15.” The study authors concluded that genistein has low toxicity.
In subchronic and chronic studies conducted by McClain et al. (2006b) outbred Wistar rats were fed diets containing genistein for 4, 13, or 52 weeks. Assuming exposures started immediately following a 1-week acclimation period, rats were 7 weeks old in the 4- and 13-week studies and 5 weeks old in the 52-week study at the start of dosing. Purity of genistein was reported at 99% for the 4-week study and ≥99.4–99.8% for the 13-and 52-week studies. Dietary genistein concentrations were adjusted weekly to obtain target dose. Diets were assessed for homogeneity and stability of genistein. The 13- and 52-week studies were conducted according to Good Laboratory Practice (GLP). Body weight and feed intake were measured. Ophthalmology, clinical chemistry, hematology, and urinalyses parameters were examined near the end of the exposure period in the 4- and 13-week studies, every 13 weeks in the 52-week study, and following recovery periods. Rats were killed and necropsied following treatment or recovery periods. Organ weights were recorded and histopathologic analyses were conducted at the end of treatment periods and following recovery periods. Levels of free and total genistein were measured in plasma, kidney, and liver in the 4- and 13-week studies and in plasma at 26 and 52 weeks of exposure. According to the study authors, blood levels of total genistein at 5, 50, and 500 mg/kg bw/day at 52 weeks were equivalent to ~4, 22, and 143 times human exposure levels. Percentages of free and total genistein in blood and tissues are reported in Section 2.2.1. Statistical analyses included Dunnett test, Steel test, and Fisher exact test.
In the 4-week dose range-finding study, six rats/sex/group were fed diets providing genistein doses of 0, 0.5, 5, 50, or 500 mg/kg bw/day genistein. No data were presented by study authors for the 4-week study, and thus there is insufficient information for Expert Panel review. Briefly, the study did not detect treatment-related effects on mortality, clinical signs, or ophthalmologic parameters. Body weight gain was reduced in males and females of the 500 mg/kg bw/day group.
Non-dose related decreases in red blood cell counts, slightly decreased hemoglobin and hematocrit values, and slightly increased reticulocyte counts in high-dose females were the only hematologic effects reported. Clinical chemistry findings included increased triglycer-ides, phospholipids, calcium, phosphorus, and chloride in males and decreased uric acid and increased total protein in females. [Doses at which effects occurred were not stated.] Increases in adrenal weight of males and relative liver, kidney, spleen, ovary, and uterus weights of females in the 500 mg/kg bw/day group were the only organ weight effects that authors considered treatment related. Reduced seminal vesicle size was observed at necropsy in three of six males from the 500 mg/kg bw/day group. No treatment-related organ lesions were reported.
In the 13-week study that was conducted according to GLP, 15 rats/sex/group were fed diets containing genistein doses of 0, 5, 50, or 500 mg/kg bw/day. Following treatment, 10 rats/sex/group were killed and five rats/sex/group were allowed to recover for 4 weeks to determine reversibility of treatment-related effects. No treatment-related deaths were observed. Body weights were lower in the 500 mg/kg bw/day group compared to the control group [18% lower for males and 10% lower for females]. Body weights of males increased during the recovery period but were still lower compared to controls at the end of the study. During the first month of treatment, feed intake was reduced in male rats of the 500 mg/kg bw/day group. Hematology, clinical chemistry, and urinalysis parameters were monitored following 11 weeks of treatment [data were not shown]. Red blood cell parameters were reportedly decreased and reticulocyte levels were increased in males and females of the 500 mg/kg bw/day group. Slight changes in clinical chemistry parameters included decreased glucose and increased uric acid, sodium, and chloride in high-dose males and decreased uric acid and increased calcium, total protein, and phospholipid in high-dose females. Uric acid crystals were increased in females of the 500 mg/kg bw/day group. Non-reproductive organ weight changes in high-dose males included slight increases in relative (to body weight) heart, thyroid, kidney, and adrenal weights. Relative to body weight, testis weights was increased [by 19%] in high-dose males [possibly due to decreased body weight]. Relative liver and kidney weights were increased in females of the 500 mg/kg bw/day group. Relative uterine weight of high-dose females was increased [by 41%]. [The study authors did not present data for non-reproductive organ weights.] All animals were necropsied, and histopathologic evaluations were conducted in tissues from control and high-dose animals. There were no treatment-related gross or histopathologic alterations. Ophthalmologic parameters were also unaffected. With the exception of body weight effects in males, none of the treatment-related effects were observed following the 4-week recovery period. [No recovery data were reported by study authors.]
In the 52-week study that was conducted according to GLP, 30 rats/sex/group were fed diets providing genistein doses of 0, 5, 50, or 500 mg/kg bw/day. Five rats/sex/group were killed following 26 weeks of treatment and 20 rats/sex/group were killed following 52 weeks of treatment. Five rats/sex/group were allowed to recover for 8 weeks during which time they received no treatment. There were no treatment-related deaths during the study. A higher rate of alopecia in male and female rats of the high-dose group was the only clinical sign of toxicity reported. No effects were noted for ophthalmologic parameters. Body weight gain was reduced in high-dose male and female rats from the Week 26 of treatment through the Week 1 of recovery. During that time period body weights of high-dose animals compared to control animals were ~30–35% lower for males and ~30% lower for females; P<0.01. Feed intake was reduced by 22% in males and females of the high-dose group but was not statistically different when analyzed on a weekly basis. A number of statistically significant effects on hematology and clinical chemistry parameters were observed. The effects that the authors considered treatment-related in high-dose animals are listed in Table 24, along with magnitudes of change observed and the weeks for which the effects were observed. Other statistically significant effects on hematology and clinical chemistry were observed, but the authors considered the effects to be incidental because there were either no dose–response relationships or values were within normal ranges. Some of the hematologic effects persisted through the recovery period, but all clinical chemistry effects were resolved during recovery. Organ weights were measured at Weeks 26 and 52. The only significant organ weight effects that the authors considered to be treatment-related at 52 weeks were increased relative weights of adrenal and spleen (males and females), prostate [47%], testis [52%], ovary [394%], and uterus [275%] in the 500 mg/kg bw/day group. Increases in adrenal, spleen, and uterus weights were also observed following 26 weeks of treatment. Increased ovary weight was the only organ weight effect that persisted through the recovery period. Other significant organ weight effects occurred, but the study authors concluded that those effects resulted from reduced body weight gain.
Table 24.
Hematologic and Clinical Chemistry Effects Observed in Rats Treated With Genistein 500 mg/kg bw/day
| Males
|
Females
|
|||
|---|---|---|---|---|
| Parameter | Effect | Weeks effect observed | Effect | Weeks effect observed |
| Hematology | ||||
| Red blood cell count | ↓4–6% | 13, 26, recovery | ↓4–5% | 13, 26 |
| Mean corpuscular volume | ↑4–10% | 13, 26, 52, recovery | ↑2% | 13 |
| Mean corpuscular hemoglobin | ↑3–11% | 13, 26, 52, recovery | ↔ | |
| Reticulocyte count | ↑18% | 13 | ↑16–36% | 13, 26, recovery |
| White blood cell count | ↓14% | 13 | ↔ | |
| Hemoglobin | ↔ | ↓4% | 13, 26 | |
| Mean corpuscular hemoglobin concentration | ↔ | ↓1–3% | 13, 52 | |
| Clinical chemistry | ||||
| Bilirubin | ↓22–23% | 13, 26 | ↓18–20% | 13, 26, 52 |
| Creatinine | ↓6% | 13, 26, 52 | ↔ | |
| Cholesterol | ↓3–50% | 13, 26, 52 | ↔ | |
| Glucose | ↓12–29% | 26, 52 | ↔ | |
| Protein | ↓4–5% | 13, 26, 52 | ↔ | |
| γ-Glutamyl transferase | ↑50–53% | 13, 26 | ↑46–61% | 13, 26 |
| Uric acid | ↓58% | 13 | ↑45–55% | 13, 26 |
| Lactate dehydrogenase | ↔ | ↑22–67% | 26, 52 | |
| Alkaline phosphatase | ↔ | ↑19–27% | 13, 26, 52 | |
↓,↑, statistically significant decrease, increase; ↔, no statistically significant or treatment-related effect.
From McClain et al. (2006b).
At the 52-week necropsy, uterine horn dilation was observed in seven females of the 500 mg/kg bw/day group and watery cysts in ovaries were noted in four, three, and 12 females of the low-, mid-, and high-dose group. [It is assumed that ~20 females/dose group were examined.] Genistein-related histopathology was observed at 26 and 52 weeks, and the effects and incidences at 52 weeks are summarized in Table 25 for males and Table 26 for females. In male rats, epididymal vacuolation was observed at 500 mg/kg bw/day and prostate inflammation was observed at ≥50 mg/kg bw/day. In female rats, the study authors reported histopathology alterations in ovaries and uterus/cervix at ≥50 mg/kg bw/day. [Although the authors claimed that squamous metaplasia of the cervix was increased at ≥50 mg/kg bw/day, the tables in the study indicate no such increase until 500 mg/kg bw/day.] Histopathologic changes in vagina and mammary gland were observed at 500 mg/kg bw/day. The types of histopathology findings in female reproductive organs are outlined in Table 26. [The study authors reported an increase in osteopetrosis in males and females at ≥50 mg/kg bw/day; however it appears that the increase at 50 mg/kg bw/day was observed only at 26 weeks in females (2/5 females of the 50 mg/kg bw/day group and 5/5 females of the 500 mg/kg bw/day group affected vs. 0/5 controls affected).] Extramedullary hemopoiesis [incidence and severity not indicated] was reported to occur in the spleen at all doses and was stated to be a compensatory response to decreased bone marrow resulting from bone thickening. Liver histopathology was observed in males and females at 500 mg/kg bw/day. Many of the histopathology observations observed at 52 weeks (i.e., effects in liver, bone, epididymides, prostate, ovaries, uterus, and vagina) were also observed at 26 weeks. Following the 8-week recovery period, osteopetrosis in females and epididymal vacuolation were the only persistent histopathologic effects observed at the high dose.
Table 25.
Treatment-related Histopathological Effects in Male Rats Given Genistein in Diet for 52 Weeks
| Animals affected/animals examined at each genistein dose (mg/kg bw/day)
|
Benchmark dose, mg/kg bw/daya |
|||||
|---|---|---|---|---|---|---|
| Effect | 0 | 5 | 50 | 500 | BMD10 | BMDL10 |
| Epididymal vacuolation | 6/19 | 8/20 | 9/20 | 11/20 | ||
| Prostate inflammation | 6/20 | 2/20 | 14/20b | 18/20b | 48 | 34 |
| Fatty change in liver | 16/20 | 15/20 | 17/20 | 8/20c | 120 | 84 |
| Bile duct proliferation in liver | 3/20 | 3/20 | 2/20 | 6/20 | ||
| Osteopetrosis | 0/20 | 0/20 | 0/20 | 17/20b | 346 | 145 |
The BMD10 is the benchmark dose associated with a 10% effect, estimated from a curve fit to the experimental data. The BMDL10 represents the dose associated with the lower 95% confidence interval around this estimate. Benchmark doses are used commonly in a regulatory setting; however, they are used in this report when the underlying data permit their calculation, and are only supplied to provide one kind of description of the dose-response relationship in the underlying study. Calculation of a benchmark dose in this report does not mean that regulation based on the underlying data is recommended, or even that the underlying data are suitable for regulatory decision-making. Values for this table were calculated using the probit model by CERHR using Environmental Protection Agency (EPA) Benchmark Dose Software version 1.3.2.
Significantly different from control (P<0.05), Fisher exact test by CERHR.
Significant trend across doses, χ2 test by CERHR.
From McClain et al. (2006b).
Table 26.
Treatment-Related Histopathologic Effects in Female Rats Given Genistein in Diet for 52 Weeks
| Animals affected/number examined at each genistein dose (mg/kg bw/day)
|
Benchmark dose mg/kg bw/daya |
|||||
|---|---|---|---|---|---|---|
| Effect | 0 | 5 | 50 | 500 | BMD10 | BMDL10 |
| Fatty change in liver | 6/20 | 13/19 | 17/20b | 1/19 | ||
| Bile duct proliferation in liver | 0/20 | 3/19 | 0/20 | 6/19b | Not meaningful | |
| Hepatocellular hypertrophy | 0/20 | 2/19 | 2/20 | 10/19b | 165 | 119 |
| Osteopetrosis | 3/20 | 0/20 | 3/20 | 18/20b | 198 | 142 |
| Mammary gland secretion | 1/20 | 1/1c | 0/1c | 6/20 | ||
| Mammary gland proliferation | 0/20 | 0/1c | 0/1c | 4/20 | ||
| Ovary bursa dilatation | 0/20 | 2/20 | 1/20 | 9/20b | 182 | 129 |
| Ovarian senile atrophy | 11/20 | 14/20 | 17/20 | 18/20b | 52 | 29 |
| Cornual uterine dilation | 1/20 | 1/20 | 2/20 | 3/20 | ||
| Uterine hydrometra | 0/20 | 0/20 | 0/20 | 7/20b | 424 | 242 |
| Uterine squamous hyperplasia | 1/20 | 4/20 | 1/20 | 13/20b | 125 | 92 |
| Cervical squamous hyperplasia | 1/20 | 0/20 | 1/20 | 5/20 | ||
| Uterine gland squamous metaplasia | 1/20 | 1/20 | 0/20 | 5/20 | ||
| Vaginal mucification | 4/20 | 7/20 | 4/19 | 14/19b | 86 | 61 |
| Vaginal cystic degeneration | 3/20 | 3/20 | 1/19 | 10/19b | 150 | 106 |
| Vaginal epithelial hyperplasia | 1/20 | 1/20 | 1/19 | 5/19 | ||
For an explanation of the use of benchmark dose in this report, see footnote to Table 25.
Significantly different from control (P<0.05), Fisher exact test by CERHR.
[It appears that the authors may have made an error in listing the total numbers of animals examined.]
From McClain et al. (2006b).
Based on mild hepatic effects consisting of minimal bile duct proliferation and increased γ-glutamyl transferase activity, the study authors identified a NOAEL of 50 mg/kg bw/day. [It is noted that study authors indicated an increase in ovarian atrophy and prostate inflammation at 50 mg/kg bw/day; it was not explained why the effects were not considered in the selection of a NOAEL.]
McClain et al. (2005) examined the effects of subchronic and chronic genistein exposure on dogs. In a 4-week and a 52-week study, beagle dogs were orally dosed with capsules containing genistein doses of 0, 50, 150, or 500 mg/kg bw/day. The purity of genistein was reported at 99.4–100%. Three dogs/sex/group were dosed in the 4-week study, and the authors stated that four dogs/sex/group were dosed in the 52-week study. [Based on the number of dogs reportedly killed at different time intervals, it appears that the control and high-dose groups in the 52-week study contained six dogs/sex.] Dogs were 5.5–6.5 months of age in the 4-week study and 5–6 months of age in the 52-week study. The dogs were fed a diet containing soybean meal as a protein source. The diet was analyzed and found to contain 3.6 ppm free genistein and 77.1 ppm total genistein. Based on feed intake, the study authors estimated that dogs would be exposed to an additional 23 mg/day or 2.3 mg/kg bw/day genistein. Body weight and feed intake were measured, and dogs were examined for viability, behavior, and clinical signs of toxicity. Ophthalmoscopic examinations were conducted and hematologic, clinical chemistry, and urinalysis parameters were measured prior to testing, at the end of the 4-week study, and every 13 weeks in the 52-week study. In the 4-week study, all dogs were killed following the dosing periods. In the 52-week study, two dogs/sex/group were killed after 13 weeks of treatment and two dogs/sex/group were killed after 52 weeks of treatment. Two dogs/sex from the control and high-dose group were killed following a 4-week recovery period. At necropsy, organs were weighed and histopathologic examinations were conducted. Toxicokinetic analyses were also conducted in the 4-week study and are discussed in Section 2.1.2.2. Statistical analyses included Dunnett or Steel tests.
In the 4-week study, the only clinical sign was a dose-related increase in pale feces or feces containing white particles. The authors speculated that white particles in feces may have been unabsorbed genistein, but they did not measure genistein levels in feces. Genistein had no effect on survival, body weight gain, feed intake, ophthalmoscopy findings, clinical chemistry measurements, urinalysis endpoints, or gross or histopathologic alterations in organs. The only hematologic finding was a slight decrease in fibrinogen levels in males of the 150 and 500 mg/kg bw/day group, but due to the small magnitude of effect in males and lack of effect in female dogs, the authors did not consider the finding to be treatment-related. Increases in absolute [119%] and relative [133%] uterine weights in high-dose females were the only organ weight effect observed. The uterine weight effects did not attain statistical significance.
In the 52-week study, genistein treatment had no effect on survival, body weight gain, feed intake, or ophthalmoscopy findings. Feces that were pale or contained white specks suspected to be unabsorbed genistein were observed, but no analyses were done to measure genistein levels in feces. Some statistically significant effects were observed for hematology and clinical chemistry parameters, but there were either no dose–response relationships or the findings were noted prior to exposure. Therefore, none of the hematology or clinical chemistry findings were considered treatment-related by study authors. No treatment-related effects were reported for urinalysis parameters [data not shown by study authors]. In male dogs, testis weight were markedly decreased in 2/2 dogs of the 500 mg/kg bw/day group following 13 weeks of treatment [mean 75% decrease in relative weight, not statistically significant] and in 1/4 dogs following 52 weeks of treatment [mean 32% decrease in relative weight, P<0.05]. Uterine weight was increased in the 500 mg/kg bw/day group following 13 weeks of exposure [83% increase in relative weight, not statistically significant] but not following 52 weeks of exposure. A slight reduction in ovary weight was described in the 150 and 500 mg/kg bw/day group following 13 weeks of treatment [14% decrease in relative weight, not statistically significant] and in the 500 mg/kg bw/day group following 52 weeks of treatment [20% decrease in relative weight, not statistically significant]. No other organ weight effects were considered treatment-related by study authors, and none of the organ weight changes persisted through the recovery period. [The Expert Panel noted that changes in testicular, uterine, and ovarian weights at 13 vs. 52 weeks of treatment suggest adaptation.]
Gross organ observations in the 500 mg/kg bw/day group included decreased size of epididymides, testes, or prostate in 2/2 dogs at 13 weeks and in 1/4 dogs at 52 weeks. In the 150 mg/kg bw/day group, reduced size of epididymis, testis, or prostate was observed in 2/2 dogs at 13 weeks but was not observed at 52 weeks. Decreased ovarian sizes were observed in 1/2 animals of each dose group at 13 weeks. At 52 weeks, thickened mammary glands were observed in one control female, two females of the 150 mg/kg bw/day group, and one female in the 500 mg/kg bw/day group. None of the gross findings were observed following the recovery period. The authors noted some histopathologic findings in males that they considered treatment related. No cases of testicular, epididymal, or prostatic atrophy were observed in control dogs or in dogs from the two lower dose groups. In the 500 mg/kg bw/day group, testicular atrophy was observed in 2/2 males at 13 weeks and 1/4 males at 52 weeks; epididymal atrophy was observed in 1/4 dogs at 52 weeks; and prostatic atrophy was observed in 2/4 dogs at 52 weeks. Testicular histopathology was characterized by small tubular diameter, reduced seminiferous epithelial height, occasional tubules containing only Sertoli cells, vacuolation of tubular epithelium, and presence of multinuclear giant cells. In epididymides, the epithelium was low in height and no spermatozoa were present. Prostatic acini were not well developed. No treatment-related histopathology changes were observed in male dogs following the recovery period. There were no treatment-related histopathologic findings in females. [Changes in histopathology at 13 vs. 52 weeks also suggest adaptation.]
The study authors concluded that the transient effects of high genistein doses on the reproductive tract of dogs were functional and not considered to be adverse effects. Therefore the study authors identified a NOAEL of >500 mg/kg bw/day. [Testicular atrophy and increased uterine weights were observed at that dose, but adaptation occurred.]
2.2.1. Thyroid
Concerns about thyroid toxicity of genistein arose in the 1930 s when goiters were observed in rats fed soybeans (reviewed by Fitzpatrick, 2000 and UK Committee on Toxicity, 2003). Studies addressing possible thyroid toxicity resulting from genistein intake in developing humans or animals are discussed in Section 3, while this section focuses on effects in adults. In vitro studies demonstrated that 10 μM [2702 μg/L] genistein in combination with 100 μM hydrogen peroxide inhibited activity of thyroid peroxidase (an enzyme involved in thyroid hormone synthesis) obtained from cows, pigs, rats, and humans (reviewed by Chen and Rogan, 2004). No evidence of thyroid carcinogenicity was observed in a study examining effects of genistein intake (≤250 mg/kg diet) in rodents (reviewed by UK Committee on Toxicity, 2003). Human studies examining the effects of soy formula isoflavones on thyroid toxicity are addressed in the CERHR Expert Panel Report on Soy Formula (Rozman et al., 2006).
2.2.2 Cardiovascular
Because estrogens have hypocholesterolemic properties and mortality rates for cardiovascular diseases are lower in populations consuming larger amounts of soy products, it has been hypothesized that isoflavones such as genistein may protect against cardiovascular disease (UK Committee on Toxicity, 2003). Beneficial cardiac effects have been attributed to soy products by the FDA (1999) and UK Committee on Toxicity (2003), as noted in the CERHR Expert Panel Report on Soy Formula (Rozman et al., 2006). However, human and experimental animal studies examining the effects of soy products extracted with alcohol to remove isoflavones reported conflicting findings. The majority of studies indicated that isoflavone supplementation alone did not reduce cholesterol levels in humans. Both the FDA and UK Committee on Toxicity stated there was no conclusive evidence that the hypocholesterolemic properties of soy products are due to isoflavones.
2.2.3 Menopausal symptoms and bone mass
Some perimenopausal and menopausal women experience hot flashes and vaginal dryness. The frequency of these symptoms can vary by culture (Kurzer and Xu, 1997). One study noted that fewer Japanese than Canadian menopausal women reported hot flashes. It was postulated that weak estrogenic effects associated with a phytoestrogen-rich diet could be the cause of reduced menopausal symptoms in Japanese women. The effects of soy foods in the diet and isoflavone supplements on hot flashes were investigated. Of 12 studies reviewed by the UK Committee on Toxicity (2003), half reported that soy diets or isoflavone supplementation reduced the frequency of hot flashes, and the other half reported no effect on hot flashes.
Experimental animal studies reviewed by the UK Committee on Toxicity (2003) consistently demonstrated that soy isoflavones prevented bone loss in ovariectomized rodents. A review by Whitten and Patisaul (2001) reported equivocal, non-dose-related findings in two studies examining the effects of genistein on bone health parameters in ovariectomized rodents. Epidemiological studies involved dietary isoflavone intake, most likely through soy food consumption, and are addressed in the CERHR Expert Panel Report on Soy Formula (Rozman et al., 2006). [The Expert Panel noted that many studies of bone health and genistein were performed with genistein given immediately following ovariectomy. In contrast, women are often post-menopausal for a period of 2 years prior to genistein intake, which may result in loss of estrogen receptor (ER).]
Reviews examining the effects of genistein or soy supplementation on menopausal symptoms and bone loss were briefly mentioned to provide information on the types of genistein-related issues that have been examined. The Expert Panel is not drawing conclusions regarding these issues because they are beyond the scope of a CERHR evaluation of reproductive and developmental effects.
2.2.4 Effects on hormone metabolism
Studies in humans ingesting soy products report inconsistent changes in hormone levels (Rozman et al., 2006). Several studies have explored mechanisms by which genistein could affect circulating levels of estrogen or androgens.
In vitro studies suggest that genistein can inhibit the enzymes aromatase (involved in estrogen production), 5α-reductase (involved in testosterone metabolism), and 17β-hydroxysteroid dehydrogenase Type I (involved in the biosynthetic pathway from cholesterol to the sex steroids) (reviewed by UK Committee on Toxicity, 2003 and Whitten and Patisaul, 2001). However, the effects were not consistently reproduced in whole-animal studies. Whitten and Patisaul (2001) noted that two studies in male rats fed phytoestrogens found no effect on brain aromatase activity, while one of the studies reported unspecified changes in 5α-reductase activity in the amygdala and preoptic area. It has also been reported that genistein inhibits CYP1A1, an enzyme that degrades 17β-estradiol, in a mouse hepatoma cell culture (Bouker and Hilakivi-Clarke, 2000).
It has been postulated that isoflavones can alter circulating levels of estrogen and testosterone through their actions on sex hormone-binding globulin, a plasma protein that limits the free concentrations available for cell uptake and implementation of biologic effects (UK Committee on Toxicity, 2003). One theory is that isoflavones can inhibit binding of estrogens or androgens to sex hormone-binding globulin, thus increasing circulating levels of free hormones. The other theory is that isoflavones can increase synthesis of sex hormone-binding globulin, thus reducing circulating levels of free estrogens and androgens. Whitten and Patisaul (2001) noted that studies examining binding affinities of phytoestrogens with sex hormone-binding globulin have produced inconsistent results. The UK Committee on Toxicity (2003) noted that genistein binds weakly to sex hormone-binding globulin and concluded that phytoestrogens are unlikely to prevent binding of estrogen or androgens at genistein levels found in blood (<5 μM [<1351 μg/L]). In vitro studies demonstrated that genistein (≥5 μM [<1351 μg/L]) increases synthesis of sex hormone-binding globulin (UK Committee on Toxicity, 2003). However, studies in humans given isoflavones reported inconsistent effects on sex hormone-binding globulin synthesis (Whitten and Patisaul, 2001; UK Committee on Toxicity, 2003). One study reviewed by Kurzer (2002) suggested that effects on estrogens and androgens mediated by sex hormone-binding globulin may be related to the ability to produce the daidzein metabolite equol, which is present in 30–40% of individuals. In that study, reduced androgen and estrogen levels and increased sex hormone-binding globulin concentrations were observed in premenopausal women who excreted equol.
A study released subsequent to the reviews examined the effects of genistein and other isoflavones on in vitro glucuronidation of 17β-estradiol (Pfeiffer et al., 2005). Microsomes were obtained from the liver of a 63-year-old male and incubated with 17β-estradiol alone or together with genistein, daidzein, or glycitein. Formation of estradiol 3-glucuronide (catalyzed by UGT1A1) and estradiol 17-glucuronide (catalyzed by UGT2B7) were measured by HPLC. Genistein inhibited formation of estradiol 3-glucuronide [by ~80%] but had no effect on formation of estradiol 17-glucuronide. In contrast, daidzein stimulated production of estradiol 3-glucuronide by ~50% but inhibited formation of estradiol 17-glucuronide by ~15%. The effects of glycitein were similar to those of daidzein. Results were confirmed using genetically engineered Sf-9 insect cells expressing UGT1A1, which is involved in the formation of the 3-glucuronide. [Concentrations of isoflavones and 17β-estradiol used in the studies were not reported, which makes interpretation of data difficult, as shown by an examination of dose–response relationships for daidzein.] At a concentration of 25 μM 17β-estradiol, maximum stimulation of estradiol 3-glucuronide production was observed with daidzein concentrations of 5–50 μM. Daidzein concentrations exceeding 50 μM inhibited formation of the 3-glucuronide. The study authors concluded that daidzein may lower 17β-estradiol levels in tissues expressing UGT1A1.
2.2.5 Estrogenicity
Estrogenicity is a property that is defined based on a biologic response. The term “estrogen” is derived from a Greek root referring to the induction of sexual behavior. Historically, estrogenicity was defined based on the ability to induce uterine growth in immature or castrated rodents. The uterine hypertrophy assay is still in use, although additional assays have been developed to probe interactions of the test chemical and ERs. In vitro estrogenicity assays may include ER-binding assays, recombinant mammalian and yeast cell transcription assays, or cell proliferation (Whitten and Patisaul, 2001; UK Committee on Toxicity, 2003). ER-binding assays indicate the test compound’s affinity for the receptor compared to a reference compound such as 17β-estradiol but do not demonstrate if the test compound will act as an agonist or antagonist. Agonistic or antagonistic ability of compounds can be assessed through using reporter gene expression or measuring cell proliferation responses, although cell proliferation is not specific to estrogenic effects. Mammalian and yeast cells have been engineered to express an ERα and a reporter gene controlled by an estrogen response element. The reporter gene usually codes for an enzyme that can be measured through quantification of activity or through measurement of transcript or protein levels. In estrogen-dependent cells, phytoestrogens were observed to both stimulate and inhibit proliferation. It has been suggested that proliferation, which was observed at lower concentrations of phytoestrogens (<10 μM [equivalent to ~2700 μg/L using molecular weight of genistein]), was mediated through receptor responses, since proliferation was not stimulated by phytoestrogens in cells lacking ERs (reviewed by UK Committee on Toxicity, 2003).
In vitro estrogenicity assays are not necessarily predictive of in vivo effects (UK Committee on Toxicity, 2003). These assays do not account for in vivo processes such as absorption, distribution, binding to serum proteins, and metabolism. For example, in vivo glucuronidation and sulfation of isoflavones produce structural changes that can lower receptor binding affinity. It has been reported that the conjugated forms of both genistein and daidzein have lower receptor affinity than their parent compounds. Whereas in vivo assays allow for the evaluation of the total response resulting from direct and indirect mechanisms of toxicity, in vitro assays allow for only responses occurring through an individual type of ER system under study. Results in test systems utilizing yeast cells or mammalian cell cultures can be affected by kinetics or membrane transport activities that have no relevancy to in vivo exposures; for example, yeast cells have the ability to eliminate certain types of compounds.
Utility of in vitro assays is also affected by the type of ER expressed. Two main types of ERs identified to date are ERα and ERβ. Compounds differ in their relative binding affinities for the two ER subtypes, and it appears that most phytoestrogens bind preferentially to ERβ. Distribution of the two receptor subtypes varies according to estrogen-responsive tissue and developmental stage. Expression of only the ERα subtype in most assay systems limits usefulness of in vitro assays for predicting in vivo estrogenicity responses (Whitten and Patisaul, 2001). Assays that do not include significant levels of ERβ are likely to underestimate estrogenic response to genistein. In addition, recombinant cells can be more sensitive to estrogenic effects because they often contain multiple copies of estrogen response elements. Thus the assays can underestimate concentrations of compounds required to induce effects in vivo.
The summary of in vitro measurement of estrogenicity (Table 27) is based primarily on reviews by Whitten and Patisaul (2001) and Chen and Rogan (2004), with the inclusion of additional studies that were not addressed in the reviews. The results are expressed as relative potency, most often in comparison to 17β-estradiol. Potency of the compounds was found to vary across assays, possibly as a result of different experimental protocols and variations in ER subtypes (UK Committee on Toxicity, 2003). However, the results consistently demonstrate that genistein, daidzein, and equol weakly induce estrogenic activity, with potencies well below that of 17β-estradiol. Kurzer and Xu (1997) theorized that genistein, daidzein, and equol at high doses could potentially act as anti-estrogens by competitively binding to ERs, thus preventing binding of endogenous estrogens.
Table 27.
In Vitro Estrogenicity of Genistein, Daidzein, and Equol
| Percent 17 β-estradiol potency
|
|||
|---|---|---|---|
| Model | Genistein | Daidzein | Equol |
| ER binding affinity | |||
| Uterine cytosol from Sprague-Dawley rats fed phytoestrogen-free dieta | 1 | ||
| Uterine cytosol from rat or sheepb,c | 0.45–2 | 0.023–0.1 | 0.2–0.4 |
| ERs from mouse uterine cytosold | 0.87 | 0.082 | |
| Liver cytosolb | 0.1 | 0.01 | |
| MCF7 breast cancer cellsb | 0.1–2 | 0.1 | |
| hER-transfected yeastb | 0.05 | ||
| hER-transfected COS7 cellsb | 0.01 | ||
| Synthesized human ERα proteinb,c | 5 | ||
| Synthesized rat ERβ proteinb,c | 36 | ||
| Human ERα-transfected baculovirus–Sf9 insect cell systemc,e | 0.7 | 0.2 | |
| hERβ-transfected baculovirus–Sf9 insect cell systemc,e | 13 | 1 | |
| Estrogen-dependent pituitary tumor cellsf | 0.88 relative to diethylstoilbestrol | ||
| ER-mediated protein induction | |||
| pS2 (estrogen-regulated gene response) in MCF7 breast cancer cellsb,c | 0.001–0.1 | ||
| Exoprotein: MCF7 breast cancer cellsb | 0.01 | 0.002 | |
| Alkaline phosphatase activity in Ishikawa-Var I human endometrial adenocarcinoma cellsg | 0.084 | 0.013 | 0.061 |
| BG1Luc4E2 cell linec | 0.001 | 0.0004 | |
| Human ER-galactosidase reporter-transfected yeastb | 0.01–0.05 | 0.001 | 0.085 |
| hER-Chloramphenicol acetyltransferase reporter-transfected Le42 | 0.04 | 0.003 | |
| TATA-Luciferase-reporter transfected T47D human breast adenocarcinoma cellsh | 0.006 | ||
| Human ERα-TATA-luciferase reporter-transfected human embryonal kidney 293 cellsc | 0.025 | ||
| Human ERβ-TATA- luciferase reporter-transfected human embryonal kidney 293 cellsc | 0.8 | ||
| ERα-luciferase reporter-transfected HepG2 human hepatoma cellsc | 1 | 0.08 | |
| ERβ-luciferase reporter-transfected HepG2 human hepatoma cellsc | 30 | 1.7 | |
| Cell proliferation | |||
| MCF7 breast cancer cellsb | 0.01–0.08 | 0.0007 | |
[The use of 17β-estradiol as a reference compound was not always explicit.]
Reviewed in Whitten and Patisaul (2001).
Reviewed in Chen and Rogan (2004).
One in vitro study examined mouse uterine ER binding of genistein glucuronide in addition to genistein (Zhang et al., 1999a). Genistein exhibited weak ER binding compared to 17β-estradiol (Table 27). With a relative binding affinity of 0.02, genistein glucuronide also displayed a weak affinity for the ER that was less than the affinity of the aglycone (0.87). No hydrolysis by uterine cytosol was observed [data were not shown].
In vivo genistein estrogenicity studies in experimental animals are summarized in Table 28. Oral exposure studies in rats were inconsistent, with one study demonstrating an increase in uterine weight following oral exposure of rats to ≥150 ppm [~14 mg/kg bw/day] genistein through diet, but other studies indicating no effect on uterine weight with genistein doses up to 750 ppm in feed [~124 mg/kg bw/day]. Uterine weight was increased in most studies in which rats were exposed to ≥2 mg/kg bw/day genistein by s.c. or i.p. injection. In oral dosing studies of mice, increases in uterine weight were observed following exposure to [≥200 mg/kg bw/day] genistein through diet or by gavage. Uterine weights of mice were consistently increased following s.c. dosing with ≥5 mg/kg bw/day genistein. Potency of genistein in inducing increases in uterine weight was much lower than that of 17β-estradiol or diethylstilbestrol. Other estrogenicity endpoints observed with genistein exposure included increased epithelial cell height and uterine gland numbers. Genistin (genistein glycoside) also induced increases in uterine weight with potencies less than or equal to those of genistein.
Table 28.
In Vivo Genistein Estrogenicity in Rats and Mice
| Animal model | Design | Endpoint | Results | Reference |
|---|---|---|---|---|
| Sprague-Dawley rat, 60 days old, ovariectomized | Dietary genistein added to modified AIN-76 feed × 5 days at 0, 150, 375, or 750 ppm [~14, 35, 71 mg/kg bw/day based on actual body weights and estimated feed intakea]. Compared to diets containing 17β-estradiol 0.5, 1.0, and 1.5 ppm. | Uterine wet weight | Increased by genistein 375 and 750 ppm; potency about 0.13% that of 17β-estradiol. | Santell et al., 1997 |
| Uterine dry weight | Increased at all genistein exposure levels; potency about 0.13% that of 17β-estradiol. | |||
| Dietary 17β-estradiol 1 ppm was given alone or with genistein at the above levels, × 21 days. | Uterine wet weight, plasma prolactin, mammary growth | There was no antagonism of 17β-estradiol by genistein co-treatment. | ||
| Dietary genistein 750 ppm [~71 mg/kg bw/day], 17β-estradiol 1 ppm, or untreated AIN-76 feed × 21 days. | Northern blot of c-fos from homogenized uteri | Both genistein and 17β-estradiol increased c-fos RNA. | ||
| Sprague-Dawley rat, 30 days old, ovariectomized | Dietary genistein added to AIN-93G feed at 0, 375, or 750 ppm [~62 and 124 mg/kg bw/day based on actual body weights and estimated feed intakesa] × 13 days | Uterine wet weight | No effect of genistein treatment on the immature uterus. | |
| Sprague-Dawley rat, 21-days-old | Mothers of rats were fed AIN-76A (a phytoestrogen-free diet), AIN-76A1genistein 250 mg/kg feed, or 17β-estradiol 250 μg/kg feed from conception through PND 21. [A 350 g female eating 28 mg feed/day would consume 20 mg/kg bw/day genistein.] | Uterine weight and ERα expression | No significant differences. | Cotroneo et al., 2001 |
| Sprague-Dawley rat, lactating, ovariectomized | Dietary genistein added to feed at 0, 0.5, 1.6, or 5 mg/day for 2 weeks. [Phytoestrogen content of feed was not reported. Based on reported body weights (~325 g), genistein intake was estimated at 0, 1.5, 4.9, and 15 mg/kg bw/day.] | Uterine dry weight | No effect of genistein treatment on the mature rat uterus. | Anderson et al., 1998 |
| Sprague-Dawley rat, 16 days old | Rats s.c. injected with 500 mg/kg bw genistein on PND 16, 18, and 20. | Uterine weight | Increased at 22 days of age but not at 33 or 50 days of age. [This finding demonstrates that the effect is highly reversible] | Murrill et al., 1996 |
| Sprague-Dawley rat, 23 days old | Rats s.c. injected with 500 mg/kg bw genistein; 500 μg/kg bw estradiol benzoate was positive control. | Uterine wet and dry weight, epithelial cell height, and PCNA staining | Increased at a dose 1000 times higher than the estradiol benzoate dose producing the same effects. | Cotroneo et al., 2005 |
| Expression of estrogen, progesterone, and EGF receptors | Changes in expression were similar for genistein and estradiol benzoate (e.g., ↓estrogen receptor, ↑progesterone, and EGF but not phosphorylated EGF receptor expression), suggesting a similar mechanism of action. | |||
| Sprague-Dawley rat, 20 days old | Rats s.c. injected with genistein 35 mg/kg bw/day for 3 days. | Uterine wet and blotted weight | Increased to 64–71% of the weight achieved with ethinyl estradiol 0.3 μg/kg/day | Kim et al., 2005 |
| Vaginal weight | Increased to 64% of the weight achieved with ethinyl estradiol 0.3 μg/kg/day | |||
| Crj:CD (DD) rat, 20 days old | Rats s.c. injected with 1, 5, or 20 mg/kg bw/day genistein daily for 3 days on regular or low-phytoestrogen diet. | Uterine weight (absolute and relative, wet and blotted) | Increased at 20 mg/kg bw/day, not affected by diet. | Yamasaki et al., 2002 |
| Wistar rat, ovariectomized | Rats were fed soy-free diets and s.c. injected with genistein 0.0025, 0.025, 0.25, or 2.5 mg/kg bw/day for 7 days. | Uterine weight and estrogen-related morphologic changes in uterus | No dose-related effects; however, the uterine epithelium was slightly taller and retained columnar structures compared to atrophic changes in control animals. | Mäkelä et al., 1999 |
| Wistar rat, 3 months old, ovariectomized | Rats s.c. injected with 0.31, 0.62, 1.25, 2.50, or 5.00 mg [1.5, 3, 6, 12, or 24 mg/kg bw] and evaluated 6 hr later. | Uterine weight | Increased at ≥0.62 mg/rat [3 mg/kg bw]. | Perel and Lindner, 1970 |
| Rats s.c. injected with 0.62, 1.25, or 2.50 mg/day [3, 6, or 12 mg/kg bw/day] for 3.5 days. | Uterine weight | Increased at ≥1.25 mg/rat/day [6 mg/kg bw/day]. | ||
| Holtzman rat, ovariectomized Mouse, 19–21 days old | Rats injected i.p. with 400 μg genistein [2 mg/kg bw based on actual body weight]. | Uterine wet weight and protein and phospholipid synthesis | Increased at 6 hr following treatment. | Noteboom and Gorski, 1963 |
| Mice fed genistein in the diet for 4–6 days. Total genistein doses received were 5–20 mg [~100–400 mg/kg bw/day based on assumed body weight of 0.01 kga]. | Uterine wet weight | Increased by 8 mg genistein; potency about 0.001% that of diethylstilbestrol. | Bickoff et al., 1962 | |
| Swiss CD-1 mouse 21–22 days old | Mice were gavaged with genistein 4 times/day for 4 days for a total dose of 6 or 8 mg/mouse [~150 or 200 mg/kg bw/day]. | Uterine wet weight, uncorrected or corrected for initial body weight | No treatment effect. | Farmakalidis and Murphy, 1984 |
| B6D2F1 mouse [age not specified, but apparently weanlings based on body weight] | Mice were gavaged with a total 8 mg genistein administered in 4 daily doses [200 mg/kg bw/day based on actual body weight]. | Uterine weight | Increased, potency 0.001% that of diethylstilbestrol; genistin administered at equimolar concentration (12 mg) also increased uterine weight with a potency similar to that reported for genistein. | Farmakalidis et al., 1985 |
| B6D2F1 mouse, 22 days old | Mice were gavaged with genistein 4 times/day for 4 days; total genistein dose 12 mg/mouse [~300 mg/kg bw/day]. | Uterine wet weight and ER binding | Uterine weight increased with 0.001% that of diethylstilbestrol. Receptor binding 2–3 orders of magnitude lower than that of 17β-estradiol [estimated from graph]. | Song et al., 1999 |
| Mouse, immature | Genistein administered through diet at 2.5 and 5.0 mg/day for 4 days [250 and 500 mg/kg bw/day, assuming that the mice weighed ~10 g as in a previous study with hay extract]. | Uterine weight | Increased at 2.5 mg/day; genistin at ≥2.5 mg/kg bw in diet also increased uterine weights but was less potent than genistein. | Cheng et al., 1955 |
| Mice were s.c. injected with genistein 1 or 2 mg/day for 4 days [100 or 200 mg/kg bw/day]. | Uterine weight | Increased at 1 mg/day with potency of 0.002% that of diethylstilbestrol; genistin at ≥2.5 mg/kg bw in diet and 2 mg by s.c. injection also increased uterine weights but was less potent than genistein. | ||
| CD-1 mouse, 17 days old | Mice s.c. injected for 3 days with doses ranging from 0.0001 to 1000 mg/kg bw/day. | Relative uterine wet weight, uterine epithelial cell height, gland number, and lactoferrin intensity | Uterine weight increased at >10 mg/kg bw/day, with potency 0.1% that of 17β-estradiol; cell height increased at >10 mg/kg bw/day, with potency 0.02% that of 17β-estradiol; gland number increased with maximum response observed at 50 mg/kg bw/day; potency 0.2% that of 17β-estradiol. Lactoferrin intensity increased at>10 mg/kg bw/day | Jefferson et al., 2002b |
| CD-1 mouse, 5 days old ddy Mouse, 8 weeks old, ovariectomized | Mice s.c. injected on PND 1–5 with 50 mg/kg bw/day. | Relative uterine weight | Increased with potency ~0.002% that of diethylstilbestrol. | Newbold et al., 2001 |
| Mice fed an AIN-93G diet and s.c. injected with 0.7 mg/day genistein for 4 weeks [22 mg/kg bw/day based on actual body weight]. | Histologic evaluation of uterus | Phenotypes of epithelial cells were not affected at 0.7 mg/day | Ishimi et al., 2000 | |
| Mice fed an AIN-93G diet and s.c. injected with 0.7, 2, or 5 mg/day genistein for 2 weeks [22, 63 or 156 mg/kg bw/day]. | Uterine weight | Slight increase at 2 mg/day and marked increase at 5 mg/kg day. | ||
| ddy Mouse, 8 weeks old, intact | Mice fed an AIN-93G diet and s.c. injected 2 or 5 mg/day genistein for 2 weeks [63 or 156 mg/kg bw/day]. | Uterine weight | Increased at 5 mg/day. | |
| BSVS mouse, 3–4 weeks old | Mice injected s.c. twice daily for 3 days with estrone, genistein, or both. Total doses 800 and 1600 μg genistein10.025, 0.1, and 0.4 μg estrone. [Genistein doses estimated at 27 and 53 mg/kg bw/day based on assumed weanling body weight of 0.01 kg]a | Uterine and vaginal wet weight | Increased by estrone or genistein administered alone. At 0.025 μg estrone, genistein did not change or slightly increased estrone response; at ≥0.1 μg estrone, genistein attenuated estrone response.b [Responses are additive at low doses and antagonistic at high doses of estrogens.] | Folman and Pope, 1966 |
| Mice injected s.c. twice daily for 3 days with diethylstilbestrol or genistein or mixture of the two compounds. Total doses were 1600 and 5000 μg genistein10.02 or 0.08 μg diethylstilbestrol. [Genistein doses estimated at 53 and 167 mg/kg bw/day.] | Uterine and vaginal wet weight | Increased by diethylstilbestrol or genistein administered alone. At 0.08 μg diethylstilbestrol, 1600 μg genistein attenuated diethylstilbestrol response; at 0.02 μg diethylstilbestrol, 5000 μg genistein augmented diethylstilbestrol response.b [Responses are additive at low doses and antagonistic at high doses of estrogens.] | ||
| Mice injected s.c. twice daily for 3 days with estriol or genistein or mixture of the two compounds. Total doses were 1600 and 5000 μg genistein12 or 40 μg estriol. [Genistein doses estimated at 53 and 167 mg/kg bw/day.] | Uterine and vaginal wet weight | Increased by estriol or genistein administered alone. Estriol responses at 2 μg were augmented by 5000 μg genistein.b |
EGF, epidermal growth factor; PCNA, proliferating cell nuclear antigen; RNA, ribonucleic acid.
Assumptions used in dose estimates obtained from EPA (1988).
Statistical analysis not clearly indicated; only obvious effects are listed.
One study (Folman and Pope, 1966) reported that genistein (≥800 μg [~27 mg/kg bw/day]) administered by s.c. injection to mice could either attenuate or augment the estrogenic responses of potent estrogens, depending on the doses of both compounds. In contrast, a second study (Santell et al., 1997) demonstrated that genistein did not antagonize 17β-estradiol responses when fed to rats at concentrations up to 750 ppm [~71 mg/kg bw/day] in diet. [This finding is most likely due to the fact that the free fraction of the aglycone is much lower after oral than after s.c. administration in spite of the higher oral dose.]
2.3 Genetic Toxicity
Results of in vitro genetic toxicity testing for genistein are listed in Table 29. With the exception of one weak positive result in one strain of Salmonella following metabolic activation, bacterial tests did not indicate mutagenicity. Positive results were generally observed in mutation, micronuclei, chromosomal aberration, and deoxyribonucleic acid (DNA) strand break tests conducted in mammalian cells; only one of the assays utilized metabolic activation. [The Expert Panel concluded that results of the in vitro tests are irrelevant because they were not conducted with the glucuronidated compound.] Results of in vivo micronuclei tests (four in mice and three in rats) and one chromosomal aberration test in mice are summarized in Table 30. In contrast to the in vitro tests, the in vivo tests did not suggest that genistein induced micronuclei or chromosomal aberrations.
Table 29.
In Vitro Genetic Toxicity Studies of Genistein
| Concentrations tested | Metabolic activation | Species or cell type/strain | Endpoint | Results | Reference |
|---|---|---|---|---|---|
| ≤100 μg [0.37 μmol/plate] | Yes | Salmonella typhimurium strains TA1538, TA98, TA100 | Mutation | ↔ With and without metabolic activation | Reviewed in Munro et al. (2003) |
| Genistein 19.5–1250 μg [0.072–4.6 μmol]/plate in bacteria and 0.3–300 μg/mL [1.1–1110 μM] in lymphoma cells; administered as a purified isoflavone product containing 40–50% genistein, 18–25% daidzein, and 1–4% glycitein | Yes | Salmonella typhimurium strains TA 1535, TA1537, TA98, and TA100; E. coli WP2uvrA | Mutation | Weak ↑ at 39.1–312.5 μg/plate in TA100 with metabolic activation; ↔ in other strains and without metabolic activation | Misra et al., 2002 |
| Mouse lymphoma cells | Mutation | ↑ at ≥12 μg/mL in lymphoma cells without activation; ↑ at ≥1.2 μg/mL in lymphoma cells with activation | |||
| 10–3333 μg/plate [0.12–12.3 μmol/plate] | Yes | Salmonella typhimurium strains TA1535, TA97, TA98, TA100, TA102 | Mutation | ↔ | McClain et al., 2006a |
| 0.813–60 μg/mL [0.003–0.22 μmol/mL] | Yes | Mouse lymphoma cells | Mutation | ↑ at ≥0.813 μg/mL with activation and ≥3.250 μg/mL without activation | |
| 10–80 μM [2700–21,619 μg/L] | No | L5178Y mouse lymphoma cells | Mutation | ↑ at 10–80 μM | Boos and Stopper, 2000 |
| 10–25 μM [2700–6760 μg/L] | No | Chinese hamster V79 cells | Mutation | Marginal ↑ at 25 μM | Kulling and Metzler, 1997 |
| 5–75 μM [1350–20,270 μg/L] | No | V79 cells | Micronuclei | ↑ at 5–25 μM and ↓ at ≥50 μM; ↓ most likely due to cytotoxicity | Di Virgilio et al., 2004 |
| 5–25 μM [1350–6760 μg/L] | No | Chinese hamster V79 cells | Micronuclei | [↑ at ≥5 μM] | Kulling and Metzler, 1997 |
| 12.5–100 μM [3380–27,020 μg/L] | No | L5178Y mouse lymphoma cells | Micronuclei | ↑ 12.5–100 μM | Boos and Stopper, 2000 |
| 25 μM [6760 μg/L] | No | Human lymphocytes | Chromatid breaks, gaps, and interchanges | ↑ | Kulling et al., 1999 |
| 50 μM [13,520 μg/L] | No | MLL gene from human hematopoietic cells | Gene cleavage | ↑ | Strick et al., 2000 |
| 1–200 μM [270–54,050 μg/L] | No | Human sperm and lymphocytes | DNA strand breaks | Variable results with some ↑ in lymphocytes at ≥50 μM; ↓ in sperm | Anderson et al., 1997 |
| 10–500 μM [2700–135,120 μg/L] | No | LNCaP and PC-3 human prostate tumor cells | DNA strand breaks | ↑ at <10–100 μM in LNCaP cells and <10–250 μM in PC-3 cells | Mitchell et al., 2000 |
| 100–500 μM [27,000–135,120 μg/L] | No | V79 cells | DNA strand breaks | ↑ ≥250 μM; 50 μM did not ↓ strand breaks induced by hydrogen peroxide. | Di Virgilio et al., 2004 |
| 7–118 μM [1890–31,890 μg/L] | No | L5178Y mouse lymphoma cells | DNA strand breaks | ↑ at 7–118 μM | Boos and Stopper, 2000 |
↑, ↓, ↔ statistically significant increase, decrease, or no significant effect.
Table 30.
Results of In Vivo Genetic Toxicity Studies of Genistein
| Species | Dose (route) | Cell type | Endpoint | Results | Reference |
|---|---|---|---|---|---|
| Swiss-Webster mouse | 500–2000 mg/kg bw genistein (gavage); administered as a purified isoflavone supplement that also contained daidzein and glycitein | Bone marrow erythrocytes | Micronuclei | Small, non-dose dependent ↑ in males but not females; similar findings reported for historic controls. | Misra et al., 2002 |
| Swiss albino mouse | Mice were administered a single oral dose of 40 mg/kg bw isoflavones obtained from a supplement containing 33 mg genistein and 67 mg daidzein/100 mg product. [Based on percentages of each individual isoflavone, the genistein dose was estimated at 13.2 mg/kg bw.] | Bone marrow | Chromosomal aberrations and micronuclei | ↔ | Khan et al., 2005 |
| C57BL6J mouse | 20 mg/kg bw/day for 5 days (oral) | Splenocytes | Micronuclei | ↔ | Reviewed by Munro et al., 2003 |
| MORO mice | 0.2–20 mg/kg bw/day by gavage for 14 days | Blood | Micronuclei | ↔ | McClain et al., 2006a |
| RAIF rat | 500–2000 mg/kg bw by gavage | Bone marrow | Micronuclei | ↔ | |
| Wistar rat | 2000 mg/kg bw by gavage | Bone marrow | Micronuclei | ↔ | |
| Sprague-Dawley rat | 250 ppm in diet from PND 21–35 | Mammary cells | Micronuclei, hyperdiploidy, and polyploidy | ↔ | Uppala et al., 2005 |
↑, ↓, ↔ statistically significant increase, decrease, or no significant effect.
2.4 Carcinogenicity
A number of studies examined cancer in rodents exposed to genistein during prenatal or postnatal development, and those studies are discussed in Section 3. The majority of studies examining cancer risks in humans involved consumption of soy products and are discussed in the CERHR Expert Panel Report on Soy Formula (Rozman et al., 2006).
Most rodent mammary cancer studies reviewed by the UK Committee on Toxicity (2003) investigated the effects of genistein or isoflavones on chemically induced cancers or implanted tumors. Conflicting results were observed for mammary cancer effects in rodents, with some studies reporting that genistein suppressed or had no effect on tumorigenicity and other studies demonstrating that genistein stimulated tumor cell growth.
One human study reviewed by Adlercreutz (2002) reported a negative association between genistein intake and prostate cancer. A UK Committee on Toxicity (2003) review reported prostatic apoptosis in 3/4 cancer patients given phytoestrogens or isoflavone supplements for 1 week or 1 month prior to surgery. Most experimental animal studies were conducted in rodents with implanted tumors or chemically induced cancers, but a limited number of studies were conducted in genetically susceptible strains (UK Committee on Toxicity, 2003). In most rodent studies, genistein or isoflavones were found to inhibit prostate tumor growth (reviewed by Adlercreutz, 2002 and UK Committee on Toxicity, 2003). However, the UK Committee on Toxicity noted that phytoestrogen concentrations in experimental animal studies were likely to be much higher than dietary exposures received by individuals in the UK.
Investigations of possible links between genistein and colon cancers are limited to experimental animal studies, and these studies reported conflicting findings (reviewed by Adlercreutz, 2002 and UK Committee on Toxicity, 2003). The UK Committee on Toxicity (2003) concluded that experimental animal studies provided some evidence of beneficial effects of phytoestrogens on breast and prostate cancer but were inconclusive for colon cancer. Most of the human studies were conducted with soy products, and the UK Committee on Toxicity noted the possibility that another active component in soybeans contributed to observed effects. The committee conclusions are in contrast to those of Kurzer and Xu (1997), who reported that there is much epidemiologic evidence to support the hypothesis that isoflavones can reduce the risk of breast, colon, and prostate cancer.
Possible mechanisms through which genistein could inhibit carcinogenesis were discussed in several reviews. Genistein stimulates in vitro cell proliferation at concentrations <10 μM [2700 μg/L] [agonist activity] but inhibits proliferation at concentrations >10 μM [2700 μg/L] [antagonist activity] (reviewed in Whitten and Patisaul, 2001). Stimulation of cell proliferation at low doses is thought to result from estrogenic activity. Possible mechanisms for suppressed cell proliferation at higher genistein doses include inhibition of protein tyrosine kinases and DNA topoisomerase (reviewed by Constantinou and Huberman, 1995 and Kurzer and Xu, 1997). Tyrosine kinases are oncogene products thought to induce cell proliferation through phosphorylation of tyrosine residues of growth factors associated with tumor cell signal transduction and proliferation pathways. DNA topoisomerases catalyze configurational changes in DNA. There is evidence that tyrosine kinase or topoisomerase inhibition can result in suppression of angiogenesis (reviewed by Kurzer and Xu, 1997). Studies in three cancer cells lines suggested that genistein stabilizes the normally transient bond between DNA and topoisomerase II, resulting in double strand breaks. The DNA breaks can lead to altered gene expression or terminal cellular differentiation, processes that inhibit cancer cell proliferation (reviewed by Constantinou and Huberman, 1995). Apoptosis is another possible consequence resulting from genistein-induced topoisomerase inhibition and resulting DNA breaks (reviewed by Constantinou and Huberman, 1995 and UK Committee on Toxicity, 2003). Genistein-induced inhibition of protein tyrosine kinase (≥2.6 μM [700 μg/L]) and DNA topoisomerase II activity (≥4 μM [1080 μg/L]) was demonstrated in numerous cancer cell lines (Kurzer and Xu, 1997; Whitten and Patisaul, 2001; UK Committee on Toxicity, 2003).
Reactive oxygen species can damage DNA, cellular proteins, and lipids and may be involved in carcinogenesis (UK Committee on Toxicity, 2003). Antioxidant activity of genistein was demonstrated in in vitro and in vivo studies. In in vitro assays, genistein inhibited the generation of superoxide and hydrogen peroxide radicals at concentrations ≥1 μM [270 μg/L] (Kurzer and Xu, 1997; Whitten and Patisaul, 2001; UK Committee on Toxicity, 2003). Other in vitro assays demonstrated that genistein reduced free-radical-induced DNA damage, lipid peroxidation, and low-density lipoprotein oxidation at concentrations ≥10 μM [2.7 mg/L] (UK Committee on Toxicity, 2003). Antioxidant activity was also observed with daidzein and its metabolites equol and O-demethylangolensin. In experimental animals dosed with genistein or soybean isoflavone extracts, there was an increase in antioxidant enzyme activities, specifically activities of catalase, superoxide dismutase, glutathione peroxidase, and glutathione reductase in skin and small intestine of mice, and activity of cumene hydroperoxidase in rat liver (reviewed by Kurzer and Xu, 1997). [Isoflavones are potent radical scavengers in the absence of antioxidant enzymes as well.] Human studies are based on soy product consumption and are described in the CERHR Expert Panel Report on Soy Formula (Rozman et al., 2006).
2.5 Potentially Sensitive Subpopulations
Studies in humans identified inter-individual differences in toxicokinetics and metabolism of isoflavones, possibly due to variations in gut microflora activity. In a study by Zhang et al. (1999b), fecal microflora degradation was investigated in 25 volunteers. Among those volunteers, the study authors identified seven males and seven females whom they classified as having moderate degradation activity. The authors speculated that less fecal activity would result in reduced degradation of isoflavones, leading to increased blood levels and urinary excretion. In those individuals, mean half-lives for fecal degradation were 8.9 ± 4.3 hr for genistein and 15.7 ± 5.3 hr for daidzein. Half-life ranges in these individuals were 4.0–16.8 hr for genistein and 5.3–23.2 hr for daidzein. [The Expert Panel notes the wide range of activity among volunteers. The study authors admitted that they had to include a few volunteers with relatively long or short half-lives in order to get a sufficient number of subjects for this study.] Despite attempting to select subjects with similar fecal degradation rates, the study authors noted a high rate of variation for urinary excretion, with 8-fold differences noted for genistein, 5-fold differences for daidzein, and 4.5-fold differences for glycitein.
It has been reported that bacterial β-glucosidase activity is lower in infants compared to adults and increases with age (reviewed by Setchell et al., 1998) [indicating that absorption is likely to be lower in infants than adults].
As noted in Section 2.1 on toxicokinetics, most genistein and daidzein is present in the circulation as glucuronide conjugates. Studies in humans suggest that infants may have a decreased ability to glucuronidate isoflavones because UDPGT activity is low in the fetus and neonate but gradually increases to adult levels in months to years (reviewed by Doerge et al., 2002).
Coughtrie et al. (1988) examined the ontogeny of UDPGT in humans. Activity was measured in postmortem liver microsome samples obtained from adults and premature or full-term infants. Results of this analysis are listed in Table 31. Activities for isoenzymes catalyzing glucuronidation of bilirubin, testosterone, and 1-napthol were very low at birth in premature and full-term infants. Activities increased with age for the isoenzymes catalyzing glucuronidation of bilirubin (~80% of adult levels by 8–15 weeks of age) and 1-naphthol (~30% of adult levels at 8–15 weeks of age). During the first 55 weeks of life, no consistent increase in activity was noted for the isoenzyme catalyzing glucuronidation of testosterone. Using an immunoblot technique with antibodies developed toward liver testosterone/4-nitro-phenol and kidney naphthol/bilirubin, one immunoreactive protein was observed in microsomes of 18- and 27-week-old fetuses, three immunoreactive proteins were observed in microsomes of term infants, and most isoenzymes present in adults were observed within 3 months of age at levels ~25% those of adults.
Table 31.
Development of UDPGT Activity in Humans
| UDPGT activity toward each substrate (nmol/min/mg protein)
|
|||
|---|---|---|---|
| Age | Bilirubin | Testosterone | 1-Napthol |
| 30 weeks gestation | 0.05 | 0 | 0.56 |
| 30 weeks gestation with 10 weeks survival | 0.4, 1 | 0.14, 0.85 | 3.0, 1.8 |
| Full-term infants surviving 1–10 days (n = 7) | 0.07 ± 0.04 | 0.10 ± 0.06 | 0.75 ± 0.68 |
| Full-term infants surviving 8–15 weeks (n = 6) | 0.64 ± 0.32 | 0.12 ± 0.05 | 2.4 ± 1.1 |
| Full-term infants surviving 22–55 weeks (n = 5) | 0.99 ± 1.1 | 0.09 ± 0.06 | 3.6 ± 2.1 |
| Adult males (n = 3) | 0.76 ± 0.43 | 0.46 ± 0.61 | 7.2 ± 2.2 |
Data presented as individual values or mean ± SD.
From Coughtrie et al. (1988).
Despite the possibility of lowered UDPGT activity in infants, a letter to the editor providing few details except a reference for the analytical method used reported no detectable levels of unconjugated isoflavones in plasmas from four infants (2.5–5.5 months old) fed exclusively soy formula for at least 2 weeks (Huggett et al., 1997); blood samples had been measured before and after hydrolysis with β-glucuronidase and sulfatase, but the percentages of each conjugate were not specified. [The Panel was not able to verify this information due to lack of experimental details and data. This reference is presented for completeness and will not be considered further.]
Coughtrie et al. (1988) also measured activity and expression of UDPGT in hepatic microsomes of WAG rats from GD 17 to PND 75. Consistent results were obtained using methods to measure enzyme activity and protein levels via immunoreactive probes. Activity of the isoenzyme catalyzing the glucuronidation of testosterone was barely detectable in fetuses, increased to ~20% of adult levels at birth, and continued to increase until reaching adult levels between 26–30 days of age (with the exception of a decrease on PND 40). Activity of the isoenzyme catalyzing glucuronidation of bilirubin was barely detectable in fetuses, increased at birth to reach 75% of adult levels on PND 2–16 (with the exception of a decrease on PND 5), and reached or exceeded adult levels by PND 20 (with the exception of a decrease on PND 40). The isoenzyme catalyzing glucuronidation of 2-aminophenol had ~30–60% of adult activity in fetuses, reached or exceeded adult activity on PND 2–5, had ~30% of adult activity on PND 10–20, and reached or exceeded adult activity by PND 26. [It is difficult, however, to predict liver UDPGT isoenzyme activity from gut, and vice versa. The Expert Panel noted that isoenzyme expression is tissue-specific (Shelby et al., 2003).]
A study by Cotroneo et al. (2001) demonstrated that s.c. injection of rats with 500 mg/kg bw genistein on PND 21, 50, or 100 resulted in blood genistein levels that were ~2 orders of magnitude higher on PND 21 than PND 50 or 100 (Table 13). [The Expert Panel notes that the higher blood genistein levels on PND 21 indicate reduced clearance in immature rats. The finding has possible implications regarding accumulation of genis-tein and potential toxicity in immature rats.]
Some sex-specific differences were observed in a study in which male and female rats were gavaged with 4 mg/kg 14C-genistein (Coldham and Sauer, 2000). Plasma levels of label were higher in males (Cmax = 2250 ng/mL, AUC = 14,147 ng-h/mL) than females (Cmax = 601 ng/mL; AUC = 8353 ng-h/mL), and half-life in males (12.4 hours) was longer than in females (8.5 hr). The major fecal metabolite was 4-hydroxyphenyl-2-propionic acid in males, but dihydrogenistein was the most abundant fecal metabolite in females. Radioactivity was higher in livers of females than males. While sulfated genistein was the most abundant compound in livers of males, parent genistein was the species measured at the highest concentration in livers of females.
A second study in rats also reported sex-related differences in toxicokinetics of genistein (Chang et al., 2000). The rats were given feed containing genistein at 5, 100, or 500 ppm from weaning to PND 140. Compared to males, females had higher levels of total genistein in serum, liver, and mammary gland, a higher AUC, and a longer half-life. Complete details of this study and the apparent discrepancy between these two rat studies are discussed in Section 2.1.
Minimal gender-specific differences in neonatal female compared to male mice treated s.c. with genistein included higher Cmax for total genistein, slower initial conjugation, and a major secondary peak of conjugated genistein in serum, indicative of enterohepatic cycling (Doerge et al., 2002).
2.6 Summary of General Toxicology and Biologic Effects
2.6.1 Toxicokinetics and metabolism
In humans, a limited amount of toxicokinetics information is available for exposure to genistein aglycone. With the possible exception of exposure to genistein through nutritional supplements and fermented soy products, the majority of genistein is consumed in glycosidic form. The toxicokinetics and metabolism section of this report focuses on genistein aglycone, while the Expert Panel Report on Soy Formula focuses on intake of genistein in its glycosidic forms. However, some information on human toxicokinetics and metabolism associated with consumption of genistein through soy products in its glycosidic forms is presented for highly relevant information. In animals, there are toxicokinetic data for exposure to genistein aglycone and for exposure through soy-based feed. This report presents information on animals exposed to genistein aglycone, while information on exposures through soy-based feed are presented in the Expert Panel Report on Soy Formula. In addition, the Expert Panel is fully aware of substantial differences in pharmacokinetics between oral and subcutaneous routes of administration.
2.6.1.1 Humans
In humans orally administered genistein aglycone, absorption was rapid and the majority of genistein was absorbed as a glucuronide conjugate (Setchell et al., 2001, 2003; Bloedon et al., 2002; Busby et al., 2002). Times to obtain maximum plasma concentrations were reported at 1–6 hr for free genistein and 3–8 hr for total genistein. Menopausal women given a 50 mg commercial isoflavone extract incorporated into fruit juice, chocolate, or a cookie showed no significant effect of the food matrix on genistein absorption or urinary excretion parameters (de Pascual-Teresa et al.).
Table 10 reports genistein blood levels in infants and adults resulting from typical dietary exposures. The highest total genistein blood level was reported for infants fed soy formula (~2530 nM [683 μg/L aglycone equivalent]), and that value exceeded blood levels reported for Asian populations (~90–1200 nM [24–324 μg/L aglycone equivalent]). Genistein blood levels in infants fed breast milk or cow milk formula were reported at ~10–12 nM [2.7–3.2 μg/L aglycone equivalent]. In Finland and Canada, genistein blood concentrations were reported at 0.5–8 nM [0.14–2.16 μg/L aglycone equivalent] in omnivores and 17–45 nM [4.6–12 μg/L aglycone equivalent] in vegetarians.
Blood levels of genistein and daidzein and their conjugates did not suggest saturated absorption in 12 women administered up to 2.0 mg/kg bw/day isoflavones through soy milk powder (Table 11). Genistein and its conjugates were reported to peak at ~6–8 hr following ingestion of soy foods (Whitten and Patisaul, 2001; Pumford et al., 2002; reviewed by UK Committee on Toxicity, 2003). Three studies detected genistein and its conjugates in human amniotic fluid at up to 212 nM [0.20–57 μg/L aglycone equivalent], indicating that genistein is distributed to the fetus (Adlercreutz et al., 1999; Foster et al., 2002b; Engel et al., 2006). One of the studies demonstrated that 84% of genistein in amniotic fluid and 91% in cord blood was present as a glucuronide conjugate (Adlercreutz et al., 1999). Studies described in detail in the CERHR Expert Panel Report on Soy Formula indicate that genistein is distributed to human milk following ingestion of soy foods (Franke and Custer, 1996; Franke et al., 1998).
Metabolism of genistein is outlined in Figure 2. Prior to absorption, most genistein is conjugated to glucuronic acid by UDPGT; a much smaller amount is conjugated to sulfate by sulfotransferase enzymes (Joannou et al., 1995; Kurzer and Xu, 1997; UK Committee on Toxicity, 2003). Conjugation of genistein occurs in the intestine but also has been reported to occur in liver. The glucuronide and sulfate conjugates can enter the systemic circulation, and it has been reported that the majority of isoflavone compounds in the circulation are present in conjugated form, thus limiting the bioavailability of genistein. In studies in which humans were exposed to genistein or isoflavone aglycones at genistein doses of 1–16 mg/kg bw, most of the genistein was present in plasma in conjugated form, while free genistein represented 1–3% of total plasma genistein levels in most cases (Setchell et al., 2001; Bloedon et al., 2002; Busby et al., 2002). The conjugated isoflavones undergo enterohepatic circulation, and upon return to the intestine, they can be deconjugated by bacteria possessing β-glucuronidase or arylsulfatase activity. The metabolites may be reabsorbed or further metabolized by gut microflora. Genistein also undergoes a biotransformation process that ultimately leads to the formation of 6′-hydroxy-O-demethylangolensin.
In volunteers given an isoflavone aglycone formulation providing genistein doses of 2–16 mg/kg bw, ~8–18% of the genistein dose was excreted in urine as genistein conjugates within 24 hr (Bloedon et al., 2002; Busby et al., 2002), and < 0.3% of the dose was excreted as free genistein (Bloedon et al., 2002). Half-lives of elimination were reported at 2–7 hr for free genistein and 6–13 hr for total genistein (Setchell et al., 2001; Bloedon et al., 2002; Busby et al., 2002). The majority of ingested genistein is excreted in urine (~30%), with very little excreted in feces (1–4%) (reviewed by ILSI, 1999 and UK Committee on Toxicity, 2003). [The Expert Panel notes that human fecal extraction data differ from experimental animal data demonstrating that 30–36% of the dose is excreted in feces. The Panel noted a possibility that some genistein may not have been detected in human fecal samples due to degradation to unknown products by intestinal flora.] The majority of fecal isoflavones are recovered 2–3 days following ingestion (reviewed by UK Committee on Toxicity, 2003). In subjects ingesting soy milk, urinary excretion peaked at 8–10 hr and 95% of excretion occurred within 24 hr; total urinary excretion consisted of 1% aglycones and 99% glucoronidated metabolites (Lu and Anderson, 1998). It has been reported that urinary levels of genistein are slightly lower in infants compared to adults fed equivalent amounts of isoflavones, which could possibly indicate slower renal clearance in early life (reviewed by Setchell et al., 1998).
2.6.1.2 Experimental animals
As noted from genistein blood levels reported in Table 13, genistein is absorbed in rats and mice following oral or s.c. exposure. According to data in Table 14, maximum genistein levels in blood are obtained within 2 hr of exposure. A mass-balance study of rats gavaged with 14C-genistein 4 mg/kg bw reported Vd at 1.27–1.47 L (Coldham and Sauer, 2000). [The Expert Panel stated that the reported Vd suggests that most of the circulating radioactivity was not genistein but the glucuronide.] Plasma protein binding ranged from ~80–90%. Radioactivity was distributed throughout the body, with levels in reproductive organs (vagina, uterus, ovary, and prostate) higher than levels in other organs (brain, fat, thymus, spleen, skeletal muscle, and bone). Some studies demonstrated higher levels of genistein aglycone versus conjugates within tissues compared to blood, raising the possibility of accumulation or hydrolysis of aglycones within tissues (Fritz et al., 1998; Chang et al., 2000; Doerge et al., 2000). [The Expert Panel noted that differences between free genistein levels in blood and tissues is probably due to differences in how the aglycone and glucuronide compounds partition between fat in blood and tissues.]
Studies demonstrated placental transfer of genistein to the rat fetus (Fritz et al., 1998; Doerge et al., 2001; Soucy et al., 2006) and lactational transfer to the rat pup following dietary administration of genistein to the dam (Chang et al., 2000). A study examining placental transfer reported higher concentrations of aglycone in fetuses compared to dams, leading the authors to conclude that placental transfer probably involves the aglycone; the finding was said to be consistent with limited conjugation ability of the fetal rat (Doerge et al., 2001). One study reported that the percentage of free genistein in milk from the pup stomach (78–97%) was higher than in milk from the dams’ nipples (57%), suggesting that genistein conjugates may be hydrolyzed in the pup stomach (Fritz et al., 1998).
As is the case for humans, genistein glucuronide is the most abundant genistein metabolite in rat blood (Coldham and Sauer, 2000). Genistein is conjugated with glucuronide in the intestine and liver, and a study in rats demonstrated that the majority of glucuronidation most likely occurs in the intestine (Sfakianos et al., 1997). With the exception of 4-hydroxyyphenyl-2-propionic acid, all other urinary genistein metabolites identified in rats were also reported for humans, suggesting pathways common to the two species. Parent compound was the predominant form of genistein in the uterus, while in prostate the most abundant form was the metabolite 4-hydroxyyphenyl-2-propionic acid. One study reported no evidence that genistein aglycone or conjugate levels in blood were saturated following exposure to dietary genistein at up to 1250 ppm.
[The Expert Panel noted that comparisons of serum aglycone levels in adult vs. fetal or neonatal rodents of the same study can be made from the rat data presented in Table 13 and Table 16. A s.c. dosing study conducted in rats demonstrated similar percentages of serum aglycone (35–46%) at PND 21, 50, or 100. One study with gavage exposure demonstrated higher aglycone percentages in fetuses (27–34%) than dams (5–18%) on GD 20 or 21 (Doerge et al., 2001). A dietary study in which dams were fed 25 or 250 ppm genistein did not consistently demonstrate higher percentages of aglycone in dams (1.7–23%) compared to pups on PND 7 (14–19%) or PND 21 (6.6–33%) (Fritz et al., 1998). In an evaluation of all the data in Table 13, it was noted that percentages of free genistein following oral exposure of adult rats were usually below 10% but sometimes attained levels of ~20%; percentages of aglycone following direct or indirect oral exposure to genistein in rat pups ≤21 days old were reported at 1–33%.]
In a mass-balance study of rats gavaged with 4 mg/kg bw 14C-genistein, ~65% of the dose was excreted in urine and 33% in feces at 166 hr following dosing (Coldham and Sauer, 2000). About 90% of the dose was recovered within the first 48 hr following dosing. Total clearance was 1.18 mL/min in males and 2.0 mL/min in females. Genistein elimination half-lives have been reported at 2–9 hr in rats and 5–8 hr in mice (Coldham and Sauer, 2000). [The Expert Panel noted an apparent contradiction between the half-lives reported by Chang et al. (2000) (~3–4 hr) and Coldham and Sauer (2000) (~9–12 hr). The differences in half-lives may have resulted from dosing regimens. Coldham and Sauer (2000) used a single low dose of 4 mg/kg bw and Chang et al. (2000) used a high daily dose rate of 50 mg/kg bw. The greatly decreased half-life at the higher dose may have resulted in part from saturation of glucuronidation and, hence, reduced enterohepatic circulation. Because it is expected that protein binding is saturated at high genistein doses, a much smaller portion of the higher dose would be bound to plasma proteins, contributing to the shorter half-life.] In neonatal mice, elimination half lives were reported at 12–16 hr for genistein aglycone and 16–19 hr for genistein conjugate.
2.6.2 General toxicology
Results of a study in which rats were exposed to 5–500 mg/kg bw/day genistein through diet for 52 weeks suggest that liver, bone, mammary gland, and male and female reproductive systems are targets of toxicity (McClain et al., 2006b). Increased incidence of ovarian atrophy and prostate inflammation were observed at ≥50 mg/kg bw/day. At 500 mg/kg bw/day there were increased incidences of osteopetrosis and liver histopathology (e.g., decreased fatty changes and increased bile duct proliferation) in male and female rats, epididymal vacuolation in males, and mammary gland secretion and proliferation in females. At 500 mg/kg bw/day, the incidence of lesions in female reproductive organs was also increased and included uterine hydrometra, dilation, and squamous hyperplasia; uterine gland squamous metaplasia; cervical squamous hyperplasia; watery ovarian cysts and bursa dilatation; and vaginal mucification, cystic degeneration, and hyperplasia. Following an 8-week recovery period, osteopetrosis in females and epididymal vacuolation were the only persistent histopathologic effects observed in rats. A study conducted in dogs administered 50–500 mg/kg bw/day genistein through capsules also suggested that the male reproductive organ system is a target of toxicity (McClain et al., 2005). In the 500 mg/kg bw/day group, increased incidence of testicular, epididymal, and prostatic atrophy were observed at 500 mg/kg bw/day; none of the histopathologic effects persisted following an 8-week recovery period. Although ovarian weights of female dogs were decreased at 500 mg/kg bw/day, there was no evidence of treatment-related histopathology.
Genistein is speculated to provide beneficial effects on cardiovascular and bone health and to alleviate menopausal symptoms; studies examining such endpoints have been limited in number, provided inconsistent findings, or evaluated soy product consumption instead of exposure to genistein alone. Studies examining the effects of genistein on estrogen- or testosterone-metabolizing enzymes or on sex hormone binding globulin levels or reactions with hormones also reported inconsistent findings.
In vitro estrogenicity assays consistently demonstrated that genistein binds to the ER and induces expression of estrogen-dependent reporter genes or proliferation of estrogen-dependent cells, with potencies well below those of 17β-estradiol. However, the usefulness of in vitro tests for predicting in vivo effects is limited by an inability to account for in vivo toxicokinetic processes, expression of only one ER subtype in most cases, and in vitro kinetic processes that have no relevance to in vivo processes (Whitten and Patisaul, 2001; UK Committee on Toxicity, 2003).
In vivo genistein estrogenicity studies in animals are summarized in Table 28. Genistein induced increases in uterine weight following oral exposure of mice to ≥200 mg/kg bw/day, s.c. dosing of mice with ≥5 mg/kg bw/day, and s.c. or i.p. dosing of rats with ≥2 mg/kg bw/day. Oral exposure studies in rats were inconsistent, with one study demonstrating an increase in uterine weight following oral exposure to ~14 mg/kg bw/day genistein through diet, but other studies indicating no effect on uterine weight at genistein doses up to ~124 mg/kg bw/day. The potency of genistein in inducing increases in uterine weight was much lower than those of 17β-estradiol or diethylstilbestrol. Other estrogenicity endpoints observed with genistein exposure included increases in epithelial cell height and uterine gland number. Genistin (genistein glycoside) also induced increases in uterine weight with potencies less than or equal to those of genistein. Studies examining genistein interactions with potent estrogens reported equivocal findings; one study suggested that attenuation or augmentation of responses depended on the dose of both genistein and the potent estrogens (Folman and Pope, 1966).
2.6.3 Genetic toxicity
Results of in vitro genetic toxicity testing for genistein are listed in Table 29. With the exception of one weak positive result in one strain of Salmonella following metabolic activation, bacterial tests did not indicate mutagenicity. Positive results were generally observed in mutation, micronucleus, chromosomal aberration, and DNA strand break tests conducted in mammalian cells; only one of the assays utilized metabolic activation. Results of in vivo micronuclei tests (four in mice and three in rats) and one chromosomal aberration test in mice are summarized in Table 30. In contrast to the in vitro tests, the in vivo tests did not suggest that genistein induces micronuclei or chromosomal aberrations.
2.6.4 Carcinogenicity
In evaluating possible associations between genistein and cancer, the focus of this CERHR review is on exposures occurring in humans or experimental animals prior to puberty, and studies in those areas are discussed in Section 3. Information on the role that genistein may play in the development of cancer in adults was obtained from reviews. In their review of genistein effects on cancer, the UK Committee on Toxicology (2003) concluded that the experimental animal studies provide some evidence of beneficial effects of phytoestrogens on breast and prostate cancer, but are inconclusive for colon cancer. Most of the human studies were conducted with soy products and the UK Committee on Toxicology noted that a possible role of another active component in soybeans cannot be excluded. Results of in vitro studies suggested that genistein at high doses could act as an antiestrogen and inhibit cancer by disruption of tumor cell signal transduction processes through inhibition of protein tyrosine kinases, induction of double strand DNA breaks through inhibition of DNA topoisomerase, or through antioxidant activities (reviewed by Constantinou and Huberman, 1995; Kurzer and Xu, 1997; and UK Committee on Toxicity, 2003). In vivo studies in experimental animals reported increases in production of antioxidant enzymes following genistein exposure (reviewed by Kurzer and Xu, 1997).
2.6.5 Potentially sensitive sub-populations
Studies in humans identified inter-individual differences in toxicokinetics and metabolism of isoflavones. One study examined the possible role of fecal microflora degradation variations in genistein elimination in humans and found that volunteers classified as having moderate fecal degradation activity had highly variable rates (8-fold differences) of genistein urinary excretion (Zhang et al., 1999b).
As noted in the toxicokinetics section, most genistein is present in the circulation as glucuronide conjugates. Human infants may have decreased ability to glucuronidate isoflavones because UDPGT activity is low in the fetus and neonate but gradually increases to adult levels in the first months of life (reviewed by Doerge et al., 2002).
Gender-specific differences in genistein metabolism were reported for rats, but the differences were not consistent among different studies. One study reported higher blood levels of genistein or metabolites and a longer half-life in males compared to females (Coldham and Sauer, 2000), but opposite effects were reported in a second study (Chang et al., 2000). Minimal gender specific differences in neonatal female compared to male mice treated s.c. with genistein included higher Cmax for total genistein, slower initial conjugation, and a major secondary peak of conjugated genistein in serum, possibly indicative of enterohepatic cycling (Doerge et al., 2002).
3.0 DEVELOPMENTAL TOXICITY DATA
3.1 Human Data
No human data were identified.
3.2 Experimental Animal Data
Summaries of studies describing developmental effects in experimental animals exposed during pre- or postnatal development are subdivided according to the following endpoints: reproductive, mammary development/carcinogenesis, brain structure/behavior, and other endpoints. The route of genistein administration is of particular importance in the evaluation of these studies because of the role of the gastrointestinal tract in conjugation of genistein to the less-active glucuronide and sulfate. Subcutaneous dosing results in more unconjugated genistein in the systemic circulation than does oral dosing. The toxicokinetic characteristics of the route of administration, discussed in Section 2.1.2, must be considered when interpreting experimental animal results in an evaluation of potential human risk.
3.2.1 Reproductive endpoints
In the following section, studies examining endpoints in females are presented prior to studies examining endpoints in males.
3.2.1.1 Mice treated during gestation
Nikaido et al. (2004), in a study supported by the Japanese Ministry of Health, Labor, and Welfare, examined the effects of prenatal genistein exposure on endocrine-sensitive tissues of CD-1 mice. Mice were fed NIH-07 (a low phytoestrogen diet), and beginning on GD 15 (plug day not specified), were s.c. injected with 0 (dimethylsulfoxide [DMSO] vehicle), 0.5, or 10 mg/kg bw/day genistein (≥99% purity) for 4 days. [The control group contained 6 dams/group, but it is not clear if that was the number of dams in treated groups.] Female offspring were weaned at 21 days of age. Onset of vaginal opening was monitored. Vaginal smears were assessed in 12 mice/group from 9–11 weeks of age. Six mice/group were killed and necropsied at 4, 8, 12, and 16 weeks of age, and histopathologic evaluations were conducted on ovaries, uterus, vagina, and mammary glands. Whole-mount preparations of mammary glands were also examined. Data were analyzed by ANOVA, Kruskal-Wallis non-parametric test, or Fisher protected least-significant difference test.
Prenatal genistein exposure accelerated body weight gain. At 16 weeks of age, body weight gain was [~57%] greater in the low-dose group and [~66%] greater in the high dose group compared to controls, as determined from a graph by CERHR. Vaginal opening was significantly accelerated by 1 day in the low-dose group and by 0.5 day in the high-dose group. Genistein exposure significantly increased estrous cycle length by 1.2 days in the low-dose group and 2 days in the high-dose group (P < 0.01 for both dose groups). Changes in estrous cycle length resulted from prolongation of diestrus. The percentage of time (mean ± SEM) the mice spent in diestrus was 24.2 ± 2.1% in the control group, 31 ± 1.7% in the low-dose group, and 34.5 ± 1.8% in the high-dose group (P < 0.01 for both dose groups). At 4 weeks of age, 6/6 control and low-dose mice had corpora lutea, while 2/6 high-dose mice had no corpora lutea. All control and genistein-treated mice had corpora lutea at later time periods. Mammary alveolar differentiation was more advanced in two of three mice with corpora lutea at 4 weeks of age. There were no differences in mammary development at later time periods. The study authors concluded that genistein exposure at doses equivalent to and 20-times higher than human exposure levels resulted in transient changes in the reproductive tract and mammary gland. Transient effects on the reproductive tract and mammary gland were also observed with bisphenol A and diethylstilbestrol, while prolonged effects were induced by zearalenone.
Strengths/Weakness
The use of very pure genistein, low-phytoestrogen chow, and diethylstilbestrol as a positive control are strengths of this study. Weaknesses include the use of only two genistein dose levels, examination of only a small portion of prenatal development (GD 15–18), the lack of clarity on the number of animals treated per group, the lack of use of the litter as the experimental unit, and small number of animals evaluated at each time point.
Utility (Adequacy) for CERHR Evaluative Process
By itself, this study is of low utility in the evaluation process.
Fielden et al. (2003), supported by the EPA, examined the effects of gestational and lactational exposure to genistein on testicular weight and sperm quality in adult mice. Two cohorts of pregnant B6D2F1 mice (n = 10–13 per group) were fed AIN-76A, a feed with undetectable levels of isoflavones, throughout pregnancy and lactation. Mice were gavaged with 0, 0.1, 0.5, 2.5, or 10 mg/kg bw/day genistein (98% purity) in corn oil on GD 12 through PND 20, excluding the day of parturition. The lower two doses represented human dietary exposure levels, while the two highest doses were selected to replicate potential higher human exposures resulting from dietary supplement intake. The study authors noted that serum genistein levels would likely be higher in humans exposed to the same dose levels. [This statement appears to have been based on the observation that genistein blood levels in neonatal mice given genistein 50 mg/kg bw/day in one study (Doerge et al., 2002) were similar to levels measured in another study (Setchell et al., 1997) in human infants with estimated genistein intakes of 4 mg/kg bw/day from soy formula.] Litter size and weight were evaluated, and anogenital distance was measured on PND 7 and 21. Pups were weaned on PND 21 and fed the AIN-76A diet. On PND 21, one male pup per litter was necropsied. The remaining male pups were killed on PND 105 or 315 for an assessment of testis and seminal vesicle weight, sperm count and motility, and in vitro fertilizing ability of sperm. Testicular RNA was isolated from high-dose mice of each age group for an evaluation of gene expression using polymerase chain reaction (PCR). The litter was considered the experimental unit in statistical analyses that included the Shapiro-Wilk test, ANOVA, analysis of covariance (ANCOVA), Kruskal-Wallis test, and Dunnett test.
No significant effects of genistein treatment were detected on dams giving birth to live pups, pup survival to PND 4 or 21, litter size, pup or litter weight, and sex ratio of pups [data were not shown]. A small but significant decrease in anogenital distance ( < 5%) was observed in the 10 mg/kg bw/day group on PND 21 but not on PND 7 [data were not shown]. No significant adverse effects were detected on sperm count or motility or on seminal vesicle, testis, or body weight [data were not shown]. Exposure to 10 mg/kg bw/day significantly increased percent in vitro fertilization of sperm by 17–18% on PND 105 and 315. Percentages of fragmented eggs were significantly reduced in the 0.1 and 2.5 mg/kg bw/day groups on PND 105 but were statistically increased in the 10 mg/kg bw/day group on PND 315. Significant reductions in percentages of 1-cell fertilized eggs were observed in 315-day-old mice exposed to ≥0.5 mg/kg bw/day genistein. [Dose–response relationships were questionable for all in vitro fertilization parameters.] Exposure to 10 mg/kg bw/day genistein was not shown to significantly affect the expression of numerous genes, including estrogen and androgen receptors, which were affected in previous diethylstilbestrol studies. The study authors concluded that developmental genistein exposure did not adversely affect sperm quality. [The Expert Panel noted that the positive effect observed on sperm fertilizing ability is puzzling and could suggest a potential ERβ-mediated role in sperm maturation.]
Strengths/Weakness
Strengths of this study include adequate numbers of animals tested per condition and an adequate dose range (four doses), including some with relevance to human exposure. Exposure by gavage insured reliable dosing. Molecular parameters (ER, androgen receptor, CYP) were examined. Effects of genistein were compared with those of diethylstilbestrol, although the comparison was made in a previous study and not shown here. A limited number of endpoints were examined (in vitro fertility and expression of few genes in testis). The in vitro fertility data did not show a dose–response effect. Only ERα expression and not ERβ expression were examined, despite the fact that ERβ is expressed in testis. Only one dose was used in the gene expression study. No hormonal profiles were mentioned or provided.
Utility (Adequacy) for CERHR Evaluative Process
This study has utility in showing that genistein exposure from gestation to prepuberty has no effect on in vitro fertility parameters in mice (F1); the lack of dose response is troublesome, but the results still indicate a useful trend for consideration.
Wisniewski et al. (2005), in a study supported by NIH, examined the effects of perinatal genistein exposure on reproductive development and behaviors of male mice. A soy- and alfalfa-free diet supplemented with genistein [purity not reported] 0, 5, or 300 mg/kg diet [ppm] was fed to 16 randomly assigned female C57Bl/6 mice/group beginning 2 weeks prior to mating and during gestation and lactation. Genistein intakes in the low- and high-dose group were estimated by study authors at 20 and 1600–1900 mg/kg bw/day during gestation and 50–60 and 4000–4800 mg/kg bw/day during lactation. Developmental parameters examined included litter size, pup sex and body weight, and maternal behavior on PND 2. Anogenital distance was measured in males once/week on PND 2–21. Litters were culled and male offspring were weaned on PND 21. Males were weighed and examined for preputial separation beginning on PND 40. In adulthood, males were observed for sexual behavior with a sexually receptive female and aggressive behavior following introduction of an intruder male. Males were killed following completion of behavioral testing. Reproductive organs were weighed, sperm counts were determined, and plasma testosterone levels were measured by RIA. Experimental groups were comprised on one randomly selected male/litter (7–10/group). Data were analyzed by ANOVA, χ2 test, and computation of z-scores.
The numbers of dams giving birth in the control, low-, and high-dose groups were 10, 7, and 8. Genistein did not affect gestation length, litter size, sex ratio, or pup weight. Maternal behavior was affected at the high dose as noted by significantly increased latency to retrieve the fourth but not the first pup. [Details about maternal behavior testing were not provided.] Mean ± SEM times to retrieve the fourth pup were 82.33 ± 9.9 sec in the high-dose group and 51.00 ± 4.57 sec in the control group. Anogenital distance was significantly reduced compared to the control group on PND 7 in both dose groups [to ~3 mm in treatment groups compared to 4 mm in control group] and on PND 21 in the low-dose group [to~6 mm in low-dose group and 7.5 mm in control]. Body weights of males in the low-dose group were significantly lower than the control group on PND 14 [9%] and PND 21 [17%]. No significant genistein treatment effects were detected on age or body weight at preputial separation, reproductive behavior, reproductive organ weight, plasma testosterone levels, or incidence of reproductive organ masses. In 20-min tests with an intruder male, mice in the low-dose group displayed significantly more defensive behaviors [~4 compared to < 1 in controls], increased duration of defensive behaviors [~17 compared to 1 sec in controls], and a shorter latency to initiating defensive behaviors [~500 vs. 900 sec in controls]. Based on z-scores for behaviors, it was determined that males in the low-dose group were less aggressive than control males. The findings discussed above were statistically significant at the P < 0.05 level. [With the exception of maternal behavior data, all quantitative data discussed above were estimated from graphs by CERHR.] The study authors concluded that non-monotonic responses were observed for phenotypic and behavioral abnormalities induced by genistein in perinatally-exposed male mice.
Strengths/Weaknesses
The use of soy- and alfalfa-free chow is a strength of this study. Genistein was added to the chow and feed consumption was monitored, so the exact exposure to genistein could be determined. Weaknesses include the use of only two dose levels of genistein, examination of only males, and the failure to correct anogenital distance for body weight. In addition, the results did not show dose-dependence.
Utility (Adequacy) for CERHR Evaluation Process
This report is not useful in the evaluation process.
Kyselova et al. (2004), supported by the Czech Republic, reported a multigenerational study in CD-1 mice exposed to genistein or diethylstilbestrol. Genistein dose levels in drinking water were given as 0, 2.5, or 25 “μg per animal’s weight per day.” [According to one of the authors, the doses should have been indicated as μg/animal. The mice weighed 20–25 g; therefore, these doses are equivalent to 0, 0.1–0.125, and 1.0–1.25 mg/kg bw/day (D. Buckiová, personal communication April 27, 2005).] The diethylstilbestrol dose level was “0.5 μg per animal’s weight per day” [0.020–0.025 mg/kg bw/day]. The parental (F0) mice were exposed beginning at 2 months of age, F1 mice were exposed throughout their life, either through their dams or directly, and F2 mice were exposed until termination at 30 days of age. Parental males were killed on PND 90 and females on PND 120. [It is not clear whether the dose was estimated based on water consumption or some other technique was used to ensure complete intake of the daily dose. The age at mating was not given. There are PND 30 data for F1 as well as F2 offspring, so some F1 animals must have been killed at this early time point. The number of animals used in each generation was not entirely clear but may have been 6/sex, at least for the F0 matings. There is no mention of culling or weaning litters.] Statistical analysis was performed with ANOVA and Student-Newman-Keuls test. Only the developmental endpoints (the body and organ weights on PND 30) are discussed here; reproductive endpoints are discussed in Section 4.2.
The high-dose genistein-treated F0 parents showed a 5–9% decrease in body weight. No alteration of body weight on PND 30 was detected in the F1 offspring. The F1 male offspring showed a decrease in absolute organ weight of the testis and accessory sex glands at both genistein dose levels. Relative weights of these organs were affected in the high-dose group. F1 female offspring had a decrease in ovarian weight on PND 30 in the low-dose group only. There appeared to be more profound suppression of testis and accessory sex gland weight in F2 offspring, although the low-dose group did not have significant alterations in absolute or relative testis weight. High-dose F2 females had a significant decrease in ovarian weight. Body weight was suppressed in F2 males and females at the high dose. Diethylstilbestrol produced more pronounced effects in F1 offspring. There were no F2 offspring due to sterility of the F1 animals. [Benchmark dose1 calculations for the endpoints in this study are given in Section 4.]
Strengths/Weaknesses
A strength of this study is the long-term exposure to relatively low levels (0.1–1 mg/kg/day) of genistein, which is relevant to human exposures. Multiple generations and several endpoints were examined. The number of animals per condition (n = 6) was adequate. Results were compared with diethylstilbestrol as a prototype estrogen. A weakness of the study is that administration through drinking water does not permit the calculation of an exact exposure dose. The diethylstilbestrol dose (25 μg/kg/day) was too high; effects observed at such a high dose might be secondary to alterations unrelated to reproductive tissues.
Utility (Adequacy) for CERHR Evaluation Process
This study has utility in showing that relatively long-term exposure to genistein does not affect F0 and F1 mouse fertility; however, the Expert Panel had no confidence in the determination of the dose received by each animal. The effects on organ weight in F2 animals and the note in the discussion about one F2 male (of six) with degenerative testes suggest the possibility of trans-generational imprinting that would deserve more study with a larger sample size and more endpoints. Similarly, the observation of some sperm damage in F1 and recognition that it might be relevant for species with lower sperm production is useful. Data are reassuring but should be considered with caution about possible long-term effects on a small minority of individuals.
Wisniewski et al. (2005), in a study supported by NIH, examined the effects of perinatal genistein exposure on reproductive development and behaviors of male mice. A soy- and alfalfa-free diet supplemented with genistein [purity not reported] 0, 5, or 300 mg/kg diet [ppm] was fed to 16 randomly assigned female C57Bl/6 mice/group beginning 2 weeks prior to mating and during gestation and lactation. Genistein intakes in the low- and high-dose group were estimated by study authors at 20 and 1600–1900 mg/kg bw/day during gestation and 50–60 and 4000–4800 mg/kg bw/day during lactation. Developmental parameters examined included litter size, pup sex and body weight, and maternal behavior on PND 2. Anogenital distance was measured in males once/week on PND 2–21. Litters were culled and male offspring were weaned on PND 21. Males were weighed and examined for preputial separation beginning on PND 40. In adulthood, males were observed for sexual behavior with a sexually receptive female and aggressive behavior following introduction of an intruder male. Males were killed following completion of behavioral testing. Reproductive organs were weighed, sperm counts were determined, and plasma testosterone levels were measured by RIA. Experimental groups were comprised of one randomly selected male/litter (7–10/group). Data were analyzed by ANOVA, χ2 test, and computation of z-scores.
The numbers of dams giving birth in the control, low-, and high-dose groups were 10, 7, and 8. There were no detectable effects of genistein on gestation length, litter size, sex ratio, or pup weight. Maternal behavior was affected at the high dose as noted by significantly increased latency to retrieve the fourth but not the first pup. [Details about maternal behavior testing were not provided.] Mean ± SEM times to retrieve the fourth pup were 82.33 ± 9.9 seconds in the high-dose group and 51.00 ± 4.57 seconds in the control group. Anogenital distance was significantly reduced compared to the control group on PND 7 in both dose groups [to~3 mm in treatment groups compared to 4 mm in control group] and on PND 21 in the low-dose group [to~6 mm in low-dose group and 7.5 mm in control]. Body weights of males in the low-dose group were significantly lower than the control group on PND 14 [9%] and PND 21 [17%]. There were no detectable effects of genistein treatment on age or body weight at preputial separation, reproductive behavior, reproductive organ weight, plasma testosterone levels, or incidence of reproductive organ masses. In 20-min tests with an intruder male, mice in the low-dose group displayed significantly more defensive behaviors [~4 compared to < 1 in controls], increased duration of defensive behaviors [~17 compared to 1 sec in controls], and a shorter latency to initiating defensive behaviors [~500 vs. 900 sec in controls]. Based on z-scores for behaviors, it was determined that males in the low-dose group were less aggressive than control males. The findings discussed above were statistically significant at the P < 0.05 level. [With the exception of maternal behavior data, all quantitative data discussed above were estimated from graphs by CERHR.] The study authors concluded that non-monotonic responses were observed for phenotypic and behavioral abnormalities induced by genistein in perinatally-exposed male mice.
Strengths/Weaknesses
The use of soy- and alfalfa-free chow is a strength of this study. Genistein was added to the chow and feed consumption was monitored, so the exact exposure to genistein could be determined. Weaknesses include the use of only two dose levels of genistein, examination of only males, and the failure to correct anogenital distance for body weight. In addition, the results did not show dose-dependence.
Utility (Adequacy) for CERHR Evaluation Process
This report is not useful in the evaluation process.
3.2.1.2. Mice treated during the lactation period
Studies examining effects in neonatal mice exposed to genistein through injection are presented below. Studies describing reproductive effects in females are followed by studies describing reproductive effects in males, presented in order of publication.
Newbold et al. (2001), from NIEHS, examined the effects of neonatal genistein treatment on the development of uterine adenocarcinoma in mice. Pregnant CD-1 mice were fed an NIH 31 mouse chow containing a low concentration of genistein (46 μg/g feed). At birth, all litters were pooled and standardized to eight female pups/dam. An estrogenicity study was conducted in one group of pups and is described in Table 28 of Section 2. On PND 1–5 [day of birth not specified], 13–17 pups/group were s.c. injected with corn oil or 50 mg/kg bw/day genistein. The dose was said to be less than an order of magnitude higher than genistein exposures in infants receiving soy formula. Diethylstilbestrol 0.001 mg/kg bw/day was used as a positive control. Mice were killed at 18 months for histopathologic examination of reproductive organs. Reproductive lesions observed at a greater incidence in the genistein compared to the control group are summarized Table 32. Genistein treatment increased the incidence of benign and malignant lesions. Adenocarcinoma was the most notable lesion observed in the genistein group and the study authors noted that similar malignant lesions were never observed in control mice in their laboratory. Based on the findings of this study, the study authors expressed concern about use of infant soy formula.
Table 32.
Reproductive Lesions Occurring in Mice Treated With Genistein
| Incidence of lesion (%)
|
|||
|---|---|---|---|
| Lesion | Control | Genistein | Diethylstilbestrol |
| No corpora lutea | 0/13 (0) | 17/17 (100) | 4/12 (33) |
| Abnormal oviduct histology | 0/13 (0) | 14/14 (100) | 5/10 (50) |
| Uterine squamous metaplasia | Not stated | 11/17 (64) | 5/13 (38) |
| Cystic endometrial hyperplasia | 3/16 (19) | 8/17 (47) | 7/13 (54) |
| Uterine adenocarcinoma | 0/16 (0) | 6/17 (35) | 4/13 (31) |
Treatment PND 1–5 with s.c. vehicle, genistein 50 mg/kg bw/day, or diethylstilbesterol 1 μg/kg bw/day.
From Newbold et al. (2001).
Strengths/Weaknesses
Strengths of the study were use of an adequate number of mice/group and comparison with diethylstilbestrol. However, estrogenic activity observed in in vitro transcription/binding studies may not reflect physiologic interactions and effects. A weakness of the study was the use of only one high genistein dose, which exceeded reported exposures in infants fed soy-formula, and the s.c. route of administration.
Utility (Adequacy) for CERHR Evaluation Process
Although the dose used was not relevant for human exposures, the study is useful in unmasking potential effects on the female reproductive system and links to cancer. It may provide useful information for cellular/molecular mechanisms targeted by genistein.
Jefferson et al. (2002a), from NIEHS, examined the effects of neonatal genistein exposure on the mouse ovary. Female mice from different litters were pooled and redistributed to produce litters of eight females. On PND 1–5 (day of birth = PND 1) 16 pups/group were s.c. treated with genistein in corn oil at 0, 1, 10, or 100 μg/day. Study authors estimated the doses at 0, 0.5, 5, or 50 mg/kg bw/day. The genistein treatment protocol was conducted in CD-1 mice, wild-type C57BL/6 mice, and in ERα or ERβ knockout mice. Another group of CD-1 mice was exposed to the tyrosine kinase inhibitor lavendustin A at 1 or 10 μg/day on PND 1–5. CD-1 mice were killed on PND 5, 12, or 19, and knockout mice were killed on PND 19. Ovaries were removed and pooled together by treatment group. Ovaries were pooled from eight mice on PND 5 and 12 and from four mice on PND 19. RNA and protein were extracted from some ovaries for measurement of ER expression by ribonuclease protection assay and Western blot. Additional ovaries were prepared for histologic examination in 8 mice/group and immunohistochemical staining for ERα and ERβ on PND 19. In another part of this study, mice were weaned on PND 21 and were treated on PND 22 with human chorionic gonadotropin hormone to induce superovulation. The numbers of ovulated oocytes within the oviduct were counted. [With the exception of ovulation data, analyzed by Dunnett test, statistical significance was not reported for any endpoint.]
In ovaries from the control CD-1 mice, ERβ RNA was expressed at more than twice the level of ERα RNA and expression increased with age. Expression of ERα decreased with age. A 3-fold increase in ERα RNA expression was observed on PND 5 in the genistein 1 μg/day group, and a < 2-fold increase in ERα RNA expression was noted on PND 12 in the 10 μg/day group. None of the genistein doses increased expression of ERβ by >1.5-fold. Treatment with genistein 100 μg/day reduced expression of ERα and ERβ RNA on PND 5, but the effect became less apparent on PND 12 and 19. [Normalized data were not shown for the 100 μg/day group.] The authors stated that Western blot and immunohistochemical analyses conducted at PND 19 confirmed the increased ovarian expression of ERα. However, in contrast to RNA expression, which peaked on PND = following genistein exposure, ERα immunoreactivity peaked on PND 19. Immunohistochemical analysis revealed that ERα was localized in interstitial and thecal cells in control mice. Genistein treatment induced ERα in granulosa cells, with strongest induction occurring in the 1 and 10 μg/day groups. ERβ was strongly expressed in granulosa cells of controls. Genistein treatment resulted in no obvious changes in the location of ERβ expression.
C57BL/6 and ERβ knockout mice displayed the same patterns of ER expression as CD-1 mice with localization of ERα in interstitial and theca cells and ERβ in granulosa cells on PND 19 [data not shown]. Induction of ERα in granulosa cells occurred following treatment with genistein 10 μg/day in C57BL/6 and ERβ knockout mice but not in ERα knockout mice. Treatment of CD-1 mice with lavendustin A 10 μg/day, which has no known estrogenic activity, increased ERα immunoreactivity in granulosa cells on PND 19, although the effect was less than the effect produced by genistein. No effect of lavendustin A treatment on ERβ immunoreactivity in ovary was detected [data not shown]. The study authors suggested that induction of ERα in granulosa cells is independent of a functional ERβ and may be partially induced by genistein inhibition of tyrosine kinase.
Ovaries from each strain of mice were evaluated for multi-oocyte follicles. As shown in Table 33, genistein treatment resulted in a dose-related increase in multi-oocyte follicles in CD-1, C57BL/6, and ERα knockout mice but not in ERβ knockout mice. Ovaries of mice in the 10 μg/day group had an increased incidence of atretic intermediate and large follicles (4.5 ± 0.4/ovary section in control group, 5.6 ± 0.3 in the genistein 1 μg/day group, and 9.1 ± 1.0 in the genistein 10 μg/day group [variances not specified]). No multi-oocyte follicles were observed in eight CD-1 mice/group treated with 1 or 10 μg/day lavendustin A. The study authors concluded that genistein induction of multi-oocyte follicles appears to occur through an ERβ-related mechanism and not through inhibition of tyrosine-specific kinases.
Table 33.
Multi-Oocyte Follicles in Mice Treated With Genistein as Neonates
| Genistein dose (μg/day)
|
||||||
|---|---|---|---|---|---|---|
| Genotype | 0 | 1 | 10 | 100 | BMD10b | BMDL10 |
| CD-1 | 0/8 (0)a | 1/8 (2) | 2/8 (4) | 6/8 (8) | 20 | 12 |
| C57BL/6 | 1/11 (1) | 1/11 (1) | 9/11 (3) | 11/11 (10) | 2 | 1 |
| ERα knockout | 1/3 (1) | 2/4 (1) | 4/6 (4) | Not determined | 2 | 1 |
| ERβ knockout | 1/2 (1) | 0/4 (0) | 0/5 (0) | 1/3 (2) | 51 | 19 |
Data expressed as number of mice expressing at least one multi-oocyte follicle in any section, (largest number of multi-oocyte follicles observed in a single section).
BMD10 is the benchmark dose associated with a 10% effect, estimated from a curve fit to the experimental data. The BMDL10 represents the dose associated with the lower 95% confidence interval around this estimate. A 10% alteration in a continuously distributed parameter is an arbitrary benchmark that may not be comparable to a similar alteration in any other endpoint. The BMD1 SD, which represents an alteration equivalent to 1 SD of the control distribution, may permit more appropriate comparisons of the responses of continuously distributed parameters. Benchmark doses are used commonly in a regulatory setting; however, they are used in this report when the underlying data permit their calculation, and are only supplied to provide one kind of description of the dose-response relationship in the underlying study. Calculation of a benchmark dose in this report does not mean that regulation based on the underlying data is recommended, or even that the underlying data are suitable for regulatory decision-making. Values were calculated using the power model by CERHR using EPA Benchmark Dose Software version 1.3.2. The program offers models based on homogeneity of variance, and CERHR was guided by the program in this regard. A probit model was used for dichotomous variables. From Jefferson et al. (2002a).
In the test to determine ovulation in 22–23-day-old mice, treatment with genistein 1 μg/day significantly increased numbers of ovulated oocytes (33.9 ± 3.3 compared to 23.2 ± 2.8 oocytes in control. [The indicated variance is SEM (R. Newbold, personal communication August 17, 2005).] There were smaller numbers of oocytes in oviducts of mice treated with genistein 10 and 100 μg/day (17.9 ± 1.4 and 16.5 ± 1.8 oocytes), but the results did not attain statistical significance. The study authors noted that the dose inducing increased ovulation coincided with the dose inducing increased ERα expression.
In summary, the study authors concluded that neonatal genistein exposure resulted in morphologic and functional changes in the mouse ovary. They concluded that the mechanism for induction of ERα expression in granulosa cells appeared to involve tyrosine kinase inhibitory properties, but that indirect effects of genistein on the hypothalamic-pituitary axis could not be ruled out. In contrast, the study authors concluded that increases in multi-oocyte follicle numbers requires a functional ERβ.
Strengths/Weaknesses
Strengths of the study are use of an adequate number of animals/group and multiple dose levels, including some relevant to human exposure; however the s.c. dose route is a weakness. The experimental design was appropriate for determining mechanisms of effect by comparing results of genistein to those of other tyrosine kinase inhibitors and using ERα and ERβ knock-out mice to examine estrogenicity of genistein. A weakness of the study was no examination of animals and tissues after PND 19. Study of adult animals would have been useful.
Utility (Adequacy) for CERHR Evaluation Process
Results of this important paper suggest that neonatal exposure of female mice can trigger deleterious effects in maturing ovaries and pinpoint ERs and tyrosine kinase as molecular targets.
Jefferson et al. (2005b), from NIEHS, examined the effects of neonatal genistein exposure on the reproductive systems of female mice. CD-1 mice used in this study were fed NIH-31 laboratory chow, a feed containing low levels of phytoestrogens (~98 μg/g genistein and daidzein, equivalent to an intake of ~16.7 mg/kg bw/day). Standardized litters of eight female pups were created using randomly assigned pups from at least three litters. On PND 1–5 [day of birth not defined], pups were given genistein 0.5, 5, or 50 mg/kg bw/day [purity not stated] in corn oil by s.c. injection. [Controls were said to be untreated.] Authors stated that the doses represented ranges of exposure in pregnant and lactating vegetarian mothers and in infants fed soy-based formulas. [The Expert Panel noted the study of Doerge et al. (2002), summarized in Table 23, in which mouse neonates given genistein 50 mg/kg bw/day s.c. on PND 1–5 had Cmax blood values for genistein aglycone of 1.4–2.3 μM and Cmax values for conjugated genistein of 3–5 μM. These values correspond to 378–621 μg/L for the aglycone and 810–1350 μg/L genistein equivalents for the conjugates. As noted in Section 1.2.3 and summarized in Table 10, mean ± SD plasma genistein (aglycone+conjugates) in 4-month-old human infants on soy formula was 683 ± 442.6 μg/L (Setchell et al., 1997). As noted in Table 12, pregnant women at term had plasma genistein (aglycone+conjugates) levels up to 303 nM or about 82 μg/L (Adlercreutz et al., 1999). As summarized in Table 8, vegetarian women had plasma genistein (aglycone+conjugates) levels of about 17–502 nM, or 4.6–136 μg/L genistein equivalents.]
Mice were examined for vaginal opening (n = 15 or 16/group) and monitored for estrous cyclicity (n = 8/group) over a 2-week period at 2 and 6 months of age. At 2 months of age in all dose groups, and at 4 and 6 months of age in the lower two dose groups, eight mice/group were mated to untreated males for 2 weeks or until a vaginal plug was detected. The same mice were used for each mating period. Mice were allowed to litter and pups were sexed and counted. Ovaries from 5–8 mice/group were collected, and corpora lutea were examined at 6 weeks and 4 months of age. Ovulatory capacity was examined at 4 months of age in 14–16 mice/group by counting oocytes following treatment with human chorionic gonadotropin. Serum progesterone and 17β-estradiol levels were measured at 19 days of age in 8 mice/group; some pooling of samples was required to obtain enough blood resulting in 2–8 samples/group. Continuous data were analyzed using ANOVA followed by Dunnett test. Categorical data were analyzed using the Fisher exact test; pregnancy rates were also analyzed using the Cochran-Armitage test.
An intense reddening of the vaginal area was observed in mice from the 50 mg/kg bw/day group from weaning through adulthood. Vaginal opening was described as tending to occur earlier in the 0.5 mg/kg bw/day group and later in the 50 mg/kg bw/day group, although mean day of vaginal opening was not significantly affected by treatment. No significant effects on serum progesterone or 17β-estradiol levels on PND 19 were detected. Estrous cyclicity data are summarized in Table 34. Treatment with genistein resulted in significant and dose-related increases in estrous cycle abnormalities at all dose levels. The effects were more severe at 6 than at 2 months of age. There was an increased incidence of persistent estrus in the high-dose group. Fertility parameters for which there was evidence of dose-related effects are summarized in Table 35. No significant effects were observed for number of plug-positive mice at any age. The number of pregnant mice, defined as the number of mice who delivered live pups, was significantly reduced in all dose groups at 2, 4, and 6 months of age. At 2 months, none of the dams in the 50 mg/kg bw/day group gave birth to live pups. A second group treated with 50 mg/kg bw/day on PND 1–5 also failed to deliver live pups; therefore, the 50 mg/kg bw/day dose was not tested at 4 and 6 months of age. In the 0.5 and 5 mg/kg bw/day groups, the reduction in pregnancies was most pronounced at 6 months of age, and the authors stated that the effect was consistent with early reproductive senescence. Number of live pups did not differ significantly when each time period was analyzed separately. However, when all time periods were analyzed together, there was a significant reduction in live pups in the 5 mg/kg bw/day group. Number of corpora lutea was not affected by genistein treatment at 6 weeks of age. At 4 months of age, mice in the 5 mg/kg bw/day group had significantly more corpora lutea, but none were observed in mice of the 50 mg/kg bw/day group. No significant difference was detected in number of ovulated oocytes following treatment of mice with human chorionic gonadotropin at 4 months of age.
Table 34.
Estrous Cyclicity Effects in Mice Treated as Neonates with Genistein
| Genistein, mg/kg bw/day
|
||||||
|---|---|---|---|---|---|---|
| Endpoint | 0 | 0.5 | 5 | 50 | BMD10a | BMDL10 |
| Evaluated at 2 months of age | ||||||
| Extended diestrus | 0 | 2 | 4 | 0 | 2 | 1 |
| Extended estrus | 0 | 1 | 3 | 6 | 9 | 6 |
| Persistent estrus | 0 | 0 | 0 | 1 | 49 | 28 |
| Evaluated at 6 months of age | ||||||
| Extended diestrus | 5 | 5 | 4 | 1 | Not calculated | |
| Extended estrus | 0 | 1 | 2 | 2 | 33 | 14 |
| Persistent estrus | 0 | 0 | 1 | 5 | 17 | 10 |
Data shown as number of mice with the indicated effect of a total of 8/group. [The authors stated “Differences among the doses in the distribution across categories are highly significant at 2 and 6 months using the Fisher exact test (P < 0.01).”]
See the footnote to Table 33 for an explanation of the use of benchmark dose in this report. A probit model was used. The 50 mg/kg bw/day dose was omitted for benchmark dose modeling of extended diestrus at 2 months of age.
From Jefferson et al. (2005b).
Table 35.
Fertility Effects in Mice Treated With Genistein as Neonates
| Genistein, mg/kg bw/day
|
||||||||
|---|---|---|---|---|---|---|---|---|
| Endpoint | 0 | 0.5 | 5 | 50 | BMD10a | BMDL10 | BMD1 SD | BMDL1 SD |
| Evaluated at 2 months of age | ||||||||
| No. pregnant/plug-positive | 6/6 | 6/6 | 6/8b | 0/16b | 4 | 2 | ||
| Live pups/dam, mean ± SEM | 15.2 ± 0.8 | 13.2 ± 0.9 | 11.5 ± 1.6d | 0 | 2 | 1 | 4 | 2 |
| Corpora lutea/dam, mean ± SEM | Not determined | |||||||
| Evaluated at 4 months of age | ||||||||
| No. pregnant/plug-positive | 6/6 | 4/4 | 7/8 | – | 5 | 2 | ||
| Live pups/dam, mean ± SEM | 12.8 ± 1.6 | 12.5 ± 1.6 | 10.0 ± 2.4d | – | 2 | 1 | 8 | 3 |
| Corpora lutea/dam, mean ± SEM | 9.2 ± 1.3 | 13.4 ± 2.0 | 18.0 ± 1.0 | 0 | 44 | 7 | 47 | 21 |
| Evaluated at 6 months of age | ||||||||
| No. pregnant/plug-positive | 7/7c | 3/5c | 2/5c | – | 1 | 0.6 | ||
| Live pups/dam, mean ± SEM | 13.7 ± 1.4 | 9.3 ± 2.2 | 8.5 ± 2.5d | – | 1 | 0.7 | 4 | 2 |
| Corpora lutea/dam, mean ± SEM | Not determined | |||||||
See the footnote to Table 33 for an explanation of the use of benchmark dose in this report. A probit model was used for dichotomous data.
Significantly different from control.
Significant trend.
Significantly different from control when three time points combined.
From Jefferson et al. (2005b).
An additional study was conducted to further assess implantation defects and pregnancy loss in mice treated with 50 mg/kg bw/day genistein. Female mice treated with genistein 0 or 50 mg/kg bw/day (n = 64/group) were mated at 2 months of age to untreated males. Reproductive tracts were collected from half the plug-positive mice on GD 6, 8, or 10 (GD 0 = plug) for an examination of implantation and resorption sites. Blood was collected from the other half of the plug-positive mice on GD 6, 8, or 10 and from non-pregnant mice (n = 3–7 group) to measure serum levels of progesterone, 17β-estradiol, and testosterone. Ovaries were collected at each time point for an examination of corpora lutea in three sections/ovary.
Fertility parameters in mice treated with genistein 50 mg/kg bw/day are summarized in Table 36. No significant treatment effect on the number of plug-positive mice following mating were detected. Genistein treatment resulted in significant reductions in the percentage of pregnant mice, the number of mice with visible implantation sites, and the number of implantation sites. In addition, implantation sites in genistein-treated mice were smaller than in controls. The number of corpora lutea was reduced by genistein treatment in pregnant mice (Table 36) and was even lower in non-pregnant mice (n = ~1–3 on study days 6, 8, and 10). In pregnant mice, no significant overall treatment effects on serum progesterone, 17β-estradiol, or testosterone levels were detected, although genistein treatment was associated with a [~90%] decrease in serum progesterone on Days 6 and 8 and a [~83%] decrease in serum testosterone on Day 8.
Table 36.
Fertility Effects in Mice Treated With Genistein as Neonates (Second Experiment)
| Dose, mg/kg bw/day
|
|||
|---|---|---|---|
| Endpoint | Evaluation day | 0 | 50 |
| No. (%) mice with implantation sites | GD 6
GD 8 GD 10 |
16/18 (89)
18/19 (95) 6/6 (100) |
8/13 (62)a
7/19 (37)a 5/11 (45)a |
| No. implantation sites/mouse, estimated from a graph | GD 6
GD 8 GD 10 |
[14]
[14] [12] |
[8]a
[11]a [5]a |
| % Pregnant mice, estimated from a graph | GD 6
GD 8 GD 10 |
[90]
[95] [100] |
[65]
[35]a [40]a |
| No. corpora lutea, estimated from a graph | GD 6
GD 8 GD 10 |
[23]
[18] [13] |
[6]a
[8]a [9] |
Statistically significant compared to controls.
From Jefferson et al. (2005b).
The study authors concluded that treatment of neonatal mice with environmentally relevant doses of genistein resulted in abnormal estrous cycles, altered ovarian function, early reproductive senescence, and subfertility or infertility.
Strengths/Weaknesses
A strength of this study is an adequate number of animals used/group. Administration of genistein by s.c. injection provided clear information on doses received by animals but is not a route of exposure relevant to humans. A wide range of genistein doses was administered at levels relevant to human exposure. The exposure period (PND 1–5) was well-defined. A variety of endpoints, including hormonal status, was examined.
Utility (Adequacy) for CERHR Evaluation Process
This study is useful for the evaluation process. It is a well-designed and very important study that highlights long-term effects of neonatal exposure to genistein on the female reproductive system, including prolonged estrous cycles, altered ovarian function, subfertility, and early reproductive senescence. It also shows that a relatively low genistein dose of 0.5 mg/kg bw/day has deleterious consequences.
Jefferson et al. (2005a), supported by NIEHS, further evaluated the production of multi-ovarian follicles seen after neonatal genistein treatment in their previous study (Jefferson et al., 2002a). Female CD-1 mouse neonates were pooled and randomly assigned to dams as all-female litters of eight pups. On PND 1–5 [day of birth not indicated], pups were s.c. treated with genistein [purity not given] 50 mg/kg bw/day. Control pups were not treated. Pups were decapitated on PND 2, 3, 4, 5, or 6 (8 mice/treatment group/age) and ovaries were fixed in paraformaldehyde. Whole ovaries were labeled with Stat3, a germ cell marker. The number of individual oocytes relative to the number of oocytes in nests was determined by confocal microscopy of two regions per ovary. Four sections at least 20 μm apart were evaluated for proportion of follicle types (primordial, primary, secondary) based on morphologic criteria. Transmission electron microscopy was used to evaluate ovaries from PND 4 mice for the presence of intracellular bridges connecting oocytes. Immunohistochemistry staining for poly (adenosine diphosphate-ribose) polymerase 1 and terminal deoxynucleotidyl transferase-mediated dUTP nick-end labeling (TUNEL) were used to assess apoptosis. Data were analyzed using 2-way ANOVA with treatment and day as main effects.
The percentage of unassembled follicles, defined as follicles in which the oocytes were not completely surrounded by granulosa cells, was increased in genistein-treated mice (73.4 ± 3.7%, mean ± SEM) on PND 4 compared to untreated controls (56.7 ± 2.9%). The percentages of primordial and primary oocytes were correspondingly decreased by genistein treatment. In control sections, 44% of oocytes were single, compared to 21.2% of oocytes in sections from genistein-treated mice, with large oocyte nests still apparent in the genistein-exposed ovaries. A significant difference in percentage and number of single oocytes between control and genistein-exposed ovaries was identified on PND 4–6. On PND 4, there were no intracellular bridges among 325 oocytes from control animals and there were three intracellular bridges among 633 oocytes from genistein-treated animals. Counts on PND 2, 4, and 6 showed a larger number of oocytes in sections from genistein-exposed ovaries on PND 4 and 6 than in sections from control ovaries. Follicle counts per section on PND 4 were 58 in control ovaries and 79 in genistein-exposed ovaries. Follicle counts per section on PND 6 were 41 in control ovaries and 52 in genistein-exposed ovaries. There were no detected differences in ovary size that would explain the differences in follicle counts per ovarian section. [Follicle counts were estimated from a graph; ovarian size data were not shown.] The ipercentage of cells positive for apoptosis markers was decreased on PND 3 in sections from genistein-treated mice compared to controls. TUNEL staining was increased in genistein-exposed ovaries compared to controls on PND 2, but poly (adenosine diphosphate-ribose) polymerase 1 staining differences by treatment on this day were not detected.
The authors concluded that neonatal genistein treatment in mice resulted in an increase in multi-oocyte follicles and fewer single oocytes as a result of incomplete breakdown of oocyte nests. There were also deficits in programmed cell death, which normally reduces the number of oocytes by two-thirds. The larger number of oocytes in the ovary of genistein-treated mice would provide pre-granulosa cells with a larger number of oocytes to be surrounded, and an increase in unassembled follicles was identified in ovaries from genistein-treated mice. The authors cited other authors’ work using neonatal treatment with diethylstilbestrol and their own previous work with genistein (Jefferson et al., 2002a) as supporting the hypothesis that the interference of genistein with ovarian differentiation was a function of the compound’s estrogenic activity.
Strengths/Weaknesses
Strengths of this study are adequate numbers of animals and the exposure time-frame. Several ovarian parameters were examined. A weakness of this study is that the effects of only one high dose level were examined and that genistein was given s.c.
Utility (Adequacy) for CERHR Evaluation Process
Although only one dose was examined in this study, previous work by the same authors examined dose–response effects in the ovary following neonatal exposure. This study provides additional information by looking more closely at ovarian development and apoptosis and proposes a potential mechanism for multi-oocyte follicles.
Nikaido et al. (2005), in a study supported by the Japanese Ministry of Health, Labor, and Welfare, examined the effects of prepubertal genistein exposure on endocrine-sensitive tissues in mice. At 15 days of age, 17–24 female CD-1 mice were s.c. injected with 0 (DMSO vehicle) or 10 mg/kg bw/day genistein (≥99% purity) for 4 days. Body weights were measured weekly. All mice were monitored for vaginal opening. Vaginal smears were taken for 21 days during three time periods beginning at 5, 9, and 21 weeks of age. Six mice/group were killed and necropsied at 4, 8, 12, and 24 weeks of age. Ovary, uterus, vagina, and mammary gland were examined histologically. Data were analyzed by ANOVA parametric test, Kruskal-Wallis non-parametric test, or Fisher protected least-significant difference test. No genistein effect on body weight was detected. Vaginal opening was accelerated by 3.1 days in the genistein-treated mice. No effect of genistein treatment on estrous cycles was observed. At 4 weeks of age, 2/6 control mice and 3/6 genistein-treated mice had no corpora lutea. No effects on corpora lutea were noted in mice killed at later periods. No polyovular ovarian follicles or morphologic abnormalities in vaginal or uterine epithelium were observed. Genistein treatment was not observed to affect mammary gland development. Other possibly estrogenic substances were also examined, and it was reported that zearalenone, zeranol, and diethylstilbestrol also accelerated vaginal opening in addition to disrupting estrous cycles. The study authors concluded that prepubertal genistein treatment accelerated vaginal opening in mice.
Strengths/Weaknesses
The use of very pure genistein, low-phytoestrogen chow, and diethylstilbestrol as a positive control are strengths of this study. Weaknesses include the use of only one genistein dose level, the s.c. route, and the small number of animals evaluated at each time point.
Utility (Adequacy) for CERHR Evaluation Process
This report is not useful in the evaluation process.
Strauss et al. (1998), supported by the European Community, evaluated neonatal genistein effects on the reproductive tracts of adult male Han-NMRI mice. Mice were “estrogenized” as neonates with s.c. injections of diethylstilbestrol 2 μg/day, genistein [purity not specified] 0.1 or 1 mg/day (~50 or 500 mg/kg bw/day), or corn oil vehicle (controls) on the first 3 days of life (n = 10/dose group). Ventral prostates and coagulating glands were dissected and weighed at 3 months of age. Total RNA was extracted from prostatic urethras, and c-fos messenger RNA (mRNA) was estimated by Northern blot analysis. In five animals/dose group, histologic assessment of urethroprostatic blocks by light microscopy was performed. Statistical analysis was performed using ANOVA followed by Tukey least significant difference test. The study also examined prostatic effects in mice following genistein exposure in adulthood, and that portion of the study is summarized in Section 4.2.2.1.
Genistein treatment did not alter mRNA for c-fos. Ventral prostate relative weight was decreased by both genistein dose levels, and coagulating gland relative weight was decreased by the high genistein dose level. Benchmark dose calculations for reproductive organ weights are summarized in Table 37. The high genistein dose level produced histologic abnormalities in genital tissues characterized as hyperplasia and disorganization of the epithelium of the prostatic collecting ducts, ventral lobes, and seminal vesicles, with increased fibro-muscular stroma and inflammatory cells in the posterior periurethral region. These changes were reported to resemble those produced by diethylstilbestrol treatment. The lower genistein dose level produced hyperplasia in the prostatic collecting ducts in “few animals” [not otherwise quantified].
Table 37.
Benchmark Dose Calculations for Treatment-Related Effects on Relative Reproductive Organ Weights of Adult Mice Treated Neonatally With Genistein
| Benchmark dosea, mg/kg bw/day
|
||||
|---|---|---|---|---|
| Weight | BMD10 | BMDL | BMD1 SD | BMDL1 SD |
| Body | 296 | 174 | 326 | 196 |
| Ventral lobe | 154 | 104 | 418 | 261 |
| Coagulating gland | 112 | 94 | 174 | 132 |
See the footnote to Table 33 for an explanation of the use of benchmark dose in this report. A power model was used.
n = 10 pups per dose group.
From Strauss et al. (1998).
The authors concluded that during prostate development, genistein in sufficiently high doses may induce persistent abnormalities similar to those seen with diethylstilbestrol. They remarked that it was not known whether these effects could be produced using dietary phytoestrogens. Further, they observed that the human prostatic development modeled by the neonatal mouse occurs in utero, making the mouse model more relevant for maternal dietary exposures during pregnancy than for soy infant formula exposures.
Strengths/Weaknesses
A strength of this study is that adequate numbers of animals were used. The exposure time-frame was well-defined and allowed for a comparison of neonatal and adult sensitivity. Mechanism of action was examined. A weakness of the study is that only high doses were used, although the 50 mg/kg bw/day dose was shown to correspond to circulating genistein levels relevant to human exposure, and the s.c. route was used. The study was limited in focus because it only examined prostate and no other reproductive tissue.
Utility (Adequacy) for CERHR Evaluation Process
This study is useful for studying the balance between beneficial and deleterious effects of genistein exposure on the prostate. The study highlighted differences in prostate sensitivity based on time of exposure. As noted by authors, the neonatal developmental events examined here occur in utero in humans; therefore, the neonatal experiments may be more relevant for in utero exposure.
Shibayama et al. (2001), supported by the Japanese government and three private foundation grants, evaluated reproductive parameters in ICR mice after neonatal treatment with genistein. Newborn male mice were given genistein [purity not specified], diethylstilbestrol, or the respective vehicles s.c. each day for 5 days, from the day of birth. There were eight pups in each treatment group. Genistein doses were 10, 100, or 1000 μg/day [assuming a 1.4 g bw for an ICR mouse neonate, these doses are 7, 71, and 714 mg/kg bw/day. There was no information on allocation of treatments by litter, culling, weaning, or other details of rearing.] Animals were killed at 4, 8, or 12 weeks of age. [The number killed at each time point was not given, but a graph for the 12-week data indicates n = 8, suggesting that either there were more than eight pups/group or that n < 8 at 12 weeks.] Measured parameters included testis weight, epididymal sperm count, and sperm motility. Quantitative reverse transcription (RT)-PCR of testicular RNA was performed for ERα and androgen receptor, using mRNA for glycerol-3-phosphate dehydrogenase as an internal control. ERα protein from testes was quantitated using Western blotting. Statistical methods were not given.
No significant effect of neonatal genistein treatment on testis weight, sperm count, or sperm motility at 12 weeks of age was detected. ERα mRNA was described as 20–40% of control levels after neonatal treatment with genistein 1000 μg/day and 40–80% of control levels [estimated from a graph] after the lower doses of genistein. mRNA for androgen receptor [estimated from a graph] was 60–80% of control levels after neonatal treatment with genistein 10 μg/day. After the two higher doses of genistein, androgen receptor mRNA was about 10% of control at 4 weeks of age, recovering to about 50% of control levels by 12 weeks of age. ERα protein was about 60% of control at 12 weeks of age. [Statistical testing was not indicated for these data, which were derived from three animals per dose group per time point.] The authors concluded, “These results suggest that estrogenic compounds, even if their activity is not so strong, have long-term effects on the reproductive system at molecular levels.” [The Expert Panel noted that the lack of effect of high doses on sperm count or motility suggests that genistein neonatal exposure does not have deleterious reproductive effects in male mice.]
Strengths/Weaknesses
A strength of this study is that an adequate number of animals was used. The treatment period (neonatal) was well defined and long-term effects were observed. Results were compared with those of diethylstilbestrol. Long-term effects on ERα and androgen receptor expression in testis (they could not detect ERβ) were examined in an attempt to identify possible mechanisms. A weakness of the study is that 2/3 dose levels were very high, no environmentally relevant doses were tested, and administration was s.c. Testis morphology was not examined, despite the availability of samples. There was no mention of the statistical test used.
Utility (Adequacy) for CERHR Evaluation Process
Although the doses and route were not relevant to human exposure, the data in this study complement other studies by providing evidence of long-term molecular effects (ERα and androgen receptor expression) at the highest dose. The study also provides mechanistic clues.
Adachi et al. (2004), supported by the Japanese Ministry of Education, Culture, Sports, Science, and Technology, the Ministry of the Environment, and the New Energy and Industrial Technology Development Organization, evaluated the effect of neonatal genistein treatment on testicular gene expression in ICR mice. The animals were injected for 5 days beginning on the day after birth [injection route not specified]. Genistein was given in sesame oil at 0 or 1000 μg/mouse/day [~1000 mg/kg bw/day]. Diethylstilbestrol 50 μg/mouse/day was injected as a positive control. Animals received a genistein-free diet at weaning. Testes were removed at 12 weeks of age. Some testes were fixed in paraformaldehyde, and some were frozen. Fixed testes were embedded in paraffin and sectioned. Histologic evaluation was performed by light microscopy on hematoxylin and eosin-stained sections, and apoptosis was assessed using TUNEL analysis. Total RNA was extracted from frozen testes. An in-house complementary DNA micro-array containing 1754 probes was used to assess gene expression. Real-time RT-PCR was used to evaluate the expression of estrogen and androgen receptor and to verify the microarray results for two genes that appeared to be down-regulated by genistein and diethylstilbestrol. Body and testis weight data were analyzed using the Student t-test. Other statistical analyses were not discussed.
No effects of genistein treatment on body weight or on absolute or relative testis weight were detected. Histologic examination and TUNEL staining showed no changes in genistein-exposed animals. The microarray analysis showed little effect on gene expression, except for down-regulation of laminin-γ2 to 57% of control and down-regulation of an expression sequence tag gene to 42% of control. Real-time RT-PCR confirmed these results and showed down-regulation of ERα to 42.1% of control and down-regulation of androgen receptor to 49.8% of control. ERβ expression was 96.5% of control. Diethylstilbestrol down-regulated the same genes as did genistein. Diethylstilbestrol also decreased body and testis weight and increased TUNEL staining in the testis.
The study authors concluded that neonatal genistein exposure caused changes in testicular gene expression at sexual maturity in spite of a lack of morphologic evidence of injury. They further concluded that the genes identified as having been down-regulated may be markers of neonatal estrogen exposure.
Strengths/Weaknesses
Strengths of this study included an adequate number of animals and time-frame of exposure, examination of several parameters (testis morphometry, apoptosis, gene expression), and comparison with diethylstilbestrol. However, the diethylstilbestrol dose was very high. A weakness is that only one dose level was tested, and that level exceeded environmental relevance. The route of administration (injection) was not relevant to human exposure. The study did not examine fertility of the mice.
Utility (Adequacy) for CERHR Evaluation Process
This study is reassuring because it reports no effect on testicular morphology or apoptosis at 12 weeks of age following neonatal exposure to a high genistein dose. Gene expression changes could be helpful in identifying molecular targets activated by genistein. ERα and androgen receptor expression were pinpointed as exposure markers.
3.2.1.3 Mice treated at or after weaning
Carter et al. (1955), supported by the Tennessee Valley Authority, fed female Swiss mice (n = 36/group) a diet containing commercial soybean meal, methanol-extracted soybean meal (controls), or methanol-extracted soybean meal to which genistin [purity not given] was added at 2 g/kg feed [2000 ppm]. The mice were weaned to these diets at weights of 9.4–12.1 g, which was estimated to be at 3 weeks of age. The diets were continued for 4 weeks. Females, housed 3/cage, were observed for vaginal opening. One male was placed in each cage with three females for 21 days during which time treated feed was continued. [Males had been raised on Purina Laboratory Chow. Assuming a mature female mouse eats 0.18 kg feed/kg bw/day (EPA, 1988), genistin intake would have been 360 mg/kg bw/day.] Statistical methods were not discussed. No alterations in feed consumption or body weight gain per cage were detected. Vaginal opening was advanced in the genistin-treated group. Fifty-nine percent of genistin treated females produced litters compared to 82% of control females [P = 0.06, Fisher exact test by CERHR]. No effect of treatment on litter size and weight was detected. The authors concluded that genistin had adverse effects on female reproduction in mice, although they could not exclude an effect on the male during the cohabitation period.
Strengths/Weaknesses
Administration of genistin in the diet is a strength; however, the group housing prevented determination of actual consumption. The lack of information on the age of the females at weaning, the use of a single dose level, failure to evaluate the stability or homogeneity of the dose in feed, exposure of the male during the cohabitation period, and the lack of evaluation of ovarian and uterine histopathology are weaknesses.
Utility (Adequacy) for CERHR Evaluation Process
This study is not useful in the evaluation process.
Matrone et al. (1956), supported by the Tennessee Valley Authority, fed diets containing genistin or diethylstilbestrol to male mice [strain not given] beginning at approximately 3 weeks of age. The full dose of genistin or diethylstilbestrol was given in 1 g of a basal diet each day following which untreated basal diet was given ad lib for the rest of the day. The basal diet contained casein, corn starch, vegetable oil, minerals, cellulose, and cod liver oil. The diet was given for 6 weeks following which the mice were weighed and histologic evaluation performed on testes, adrenal glands, spleen, and kidney. Genistin dose levels (n = 10/group) were 0, 9, 13, 36, and 72 mg/day [0, 439, 833, 3000, and 7200 mg/kg bw/day based on final body weight] and diethylstilbestrol dose levels were 0.04, 0.08, 0.16, 0.32, and 0.64 μg/day [1.7, 3.3, 6.6, 14.2, and 30.5 μg/kg bw/day based on final body weight]. Statistical methods were not discussed. Four mice in the highest-dose genistin group and two mice in the second-highest dose genistin group died. An additional four deaths were scattered among the other groups. There was a decrease in body weight gain with increasing genistin dose, and the highest-dose genistin animals lost body weight. All diethylstilbesterol-treated animals gained weight, although weight gain was reduced at the highest dose level. Testis weight decreased with increasing genistin dose from a control weight of 163.4 mg to a weight in the high-dose group of 16.4 mg. Testis weight decreased to a lesser extent with diethylstilbesterol. Histologic evaluation of the testis showed no spermatozoa at the two highest genistin dose levels. Spermatozoa were reduced in number in the highest-dose diethylstilbesterol group but were still present. The authors concluded that adverse effects of genistin on survival, growth, and spermatogenesis in mice were due to a mechanism other than estrogenicity inasmuch as diethylstilbestrol did not produce a similar degree of toxicity.
Strengths/Weaknesses
Strengths include the administration of genistin in the diet and the method used to ensure complete intake of the dose. The use of multiple dose levels is also a strength, although the highest dose levels were excessively toxic. Weaknesses include the lack of assessment of the stability of genistin in feed, that lack of evaluation of the basal feed for phytoestrogens, the lack of detail on preparation of tissues for histopathology examination, the failure to report feed consumption, and the failure to report details of the testicular examinations or to include interpretable photographs. The authors’ assessment of specific testicular effects of genistin is not reliable given the presence of excessive generalized toxicity.
Utility (Adequacy) for CERHR Evaluation Process
This study is not useful in the evaluation process.
East (1955), from the Australian National Institute for Medical Research, conducted a series of three studies to examined reproductive endpoints in mice consuming synthetic genistein [purity not specified]. The first study examining vaginal opening is discussed in this section. The remaining studies are addressed in Section 4. In the first study, 15 weanling “Fawn Farm” strain mice (18 days old) per group were fed 0 or 2 mg/day genistein through stock diet for 21 days. [Based on EPA (1988) assumptions for female weanling B6C3F1 mouse body weight (0.0110 kg), genistein intake would have been ~180 mg/kg bw/day. The composition of stock diet was not specified. In addition, the author noted that it was difficult to quantitate feed intake.] Following the exposure period, the mice were fed stock diet for 14 days. Inspections for vaginal opening were conducted daily. Vaginal smears were conducted daily following vaginal opening. Data were evaluated by modified t-test. Genistein significantly advanced vaginal opening compared to the control diet; mean ± SD number of days for vaginal opening post weaning were 5.47 ± 1.13 in the genistein group and 10.80 ± 3.61 in the control group. Cornified cells were seen immediately, and leukocyte infiltration was observed sporadically in smears from the genistein group. Mice cycled normally = days after transfer to stock meal [data not shown]. There was no detectable effect of genistein intake on body weight.
Strengths/Weaknesses
A strength of this historical study is that adequate numbers of animals were used. A weakness is that exposure was unclear due to administration of genistein through diet. Because no information was provided on daily intake by mice, exposure doses could only be estimated. The very high genistein dose level (~200 mg/kg bw/day) did not mirror general human exposure levels. No statistical analysis was performed. Endpoints examined were limited to vaginal opening and smears and fertility, discussed in Section 4.
Utility (Adequacy) for CERHR Evaluation Process
This study is of limited utility due to the high genistein dose levels used and the few endpoints examined.
Jung et al. (2004), supported by the Korean Ministry of Health and Welfare, examined reproductive development in mice exposed to genistein following weaning. ICR mice used in this experiment were obtained from dams that were fed a soy-based Purina chow diet during gestation and lactation. [The number of dams and distribution of pups were not specified.] Male mice were weaned and fed AIN-76A, a casein-based diet, beginning on PND 21. The mice were divided into groups of 10 and gavaged for 5 weeks with genistein (>98% purity) in corn oil at 0 or 2.5 mg/kg bw/day or 17β-estradiol 7.5 μg/kg bw/day. Following treatment, animals were killed, and testis, epididymis, and prostate were removed and weighed. Sperm count and motility were determined. Reproductive organs were fixed in Bouin fluid, and histopathologic evaluation was conducted. Total RNA was isolated from the reproductive organs to measure expression of phospholipid hydroxide glutathione peroxidase. Data were evaluated by ANOVA and least significant difference testing.
No significant effect of genistein on body weight gain or relative weights of testis, epididymis, or prostate were detected. [Absolute organ weights were not reported.] A significant decrease in prostate weight was observed in mice treated with 17β-estradiol. There was no detected reduction in testicular sperm count after treatment with genistein or 17β-estradiol, but 17β-estradiol significantly reduced epididymal sperm count. Although no significant effects on sperm motility parameters were detected, the study authors stated that motility was slightly higher in the genistein-treated mice and slightly lower in the 17β-estradiol-treated mice. Expression of phospholipid hydroxide glutathione peroxidase was significantly higher in testis and prostate of mice treated with genistein and 17β-estradiol [~2-fold higher in testis and 1.5-fold higher in prostate of genistein-treated compared to control mice]. No pathologic lesions were observed in the testis, epididymis, or prostate of genistein-treated mice [data were not shown]. In contrast, 17β-estradiol treatment induced lesions in testicular germ cells, epididymis, and prostate. The study authors concluded that these results suggested that genistein intake had no observable adverse effect on the development of the reproductive system in mice.
Strengths/Weakness
A strength of this study is use of an adequate number of animals. Oral administration mimicked human exposure, and gavage treatment permitted determination of doses administered. Other strengths included the long-term exposure (5 weeks), comparison with 17β-estradiol, and examination of multiple endpoints. A weakness of the study is that only one dose level was tested. The broad exposure time-frame extending from prepuberty into beginning of adulthood increased complexity of data interpretation, compared to a more limited exposure time-frame; however, there were not many effects to analyze.
Utility (Adequacy) for CERHR Evaluative Process
This study is reassuring because it shows no apparent effect on the male reproductive system at an environmentally relevant dose. However, there was a slight decrease in prostate weight.
Lee et al. (2004a), supported by the Ministry of Health and Welfare, Republic of Korea, examined the effects of genistein exposure prior to and during puberty on reproductive development in male ICR mice. After being weaned to a casein-based diet (which was used in dams as well) on PND 21, mice were treated orally with genistein (>98% purity) in corn oil at 0, 2.5, or 5.0 mg/kg bw/day for 5 weeks (n = 10/group). A positive control group was given 17β-estradiol. [Gavage and daily treatment are assumed.] At the end of the 5-week treatment period, reproductive organs were removed. Differences in weight and histopathology of reproductive organs, sperm count and motility, and levels of phospholipid hydroxide glutathione peroxidase mRNA expression were evaluated. Sperm count was obtained using a hemocytometer after homogenization of testicular parenchyma and cauda epididymis tissue. Cauda epididymis was placed in modified Tyrode medium supplemented with bovine serum albumin, and the sperm suspension was collected. Computer-assisted sperm analysis (CASA) was performed. Total RNA was extracted from the testis, epididymis, and prostate and evaluated using RT-PCR. Data were analyzed by ANOVA.
No significant differences in body or organ weights between the groups were detected with the exception of lower body and epididymis weight in the 17β-estradiol treatment group. 17β-Estradiol treatment also decreased sperm count and motility. Slight decreases in sperm counts did not achieve statistical significance in the genistein-treated groups. Although differences in sperm motility parameters were not significant, many motility characteristics were said to have been increased by exposure to genistein. The genistein groups were also found to have a dose-dependent increase in the expression of phospholipid hydroxide glutathione peroxidase mRNA in the testis, epididymis, and prostate. The 17β-estradiol group also had significantly greater expression of phospholipid hydroxide glutathione peroxidase mRNA in all three organs. Histopathology exams in both genistein dose groups showed hyperplasia of Leydig cells in the testis and an increase of interstitial fibroblasts and slightly irregular arrangement of the epithelium in the epididymis. The 17β-estradiol group was found to have severe damage of the testis and epididymis.
The study authors concluded that slight decreases in sperm counts and improvement of sperm motion quality following dietary genistein intake by juvenile mice suggest that genistein may affect reproductive development in males.
Strengths/Weaknesses
Strengths of the study include adequate numbers of animals, relevant doses, examination of multiple endpoints, and comparison with 17β-estradiol.
Utility (Adequacy) for CERHR Evaluation Process
This study is useful in the evaluation process. It showed that juvenile exposure to genistein at doses relevant to human exposure did not adversely affect the male reproductive system. However, Leydig cell hyperplasia and a slight decrease in sperm count suggest that genistein may exert some adverse effects on male reproductive development.
3.2.1.4 Rats treated during gestation
The following oral and s.c. exposure studies in rats commenced during prenatal development. Order of presentation is dietary followed by s.c. studies and studies reporting effects in female rats followed by studies reporting effects in male rats.
Awoniyi et al. (1998), supported by NIH and the University of Colorado, gave genistein [purity not given] in an isoflavone-free diet to 12 pregnant Sprague-Dawley rats beginning on GD 17. [A schematic diagram showed treatment beginning on GD 10; however, the text indicated that animals were purchased at GD 10. The plug day was not given.] The concentration of genistein in the diet was 5 mg/kg feed (ppm). A control group (n = 8) was fed the isoflavone-free diet without added genistein. The resultant pups were weaned on PND 21. [Standardization of litters was not mentioned. Feed consumption was said to have been measured, but no data on feed consumption were reported, and genistein intake was not estimated for dams during the gestation or lactation periods. Birth weights and litter size were not reported, although the authors commented that there were no adverse genistein effects on length of gestation, litter size, or offspring survival.] At weaning, the female pups from 4 litters in each group (28 control and 30 genistein-exposed pups) were killed, and serum 17β-estradiol, progesterone, luteinizing hormone (LH), and follicle-stimulating hormone (FSH) were measured by radioimmunoassay (RIA). Reproductive organs were weighed and evaluated by light microscopy with hematoxylin/eosin or hematoxylin/periodic acid-Schiff (PAS).
The pups from four of the remaining genistein-exposed litters were weaned to the same genistein-containing diet that had been fed to their dams. The other genistein-exposed pups were weaned to the control diet. All the remaining pups from the control group were weaned to the control diet. The age at vaginal opening was determined in all pups, and daily vaginal smears were evaluated for estrous stage. All offspring were killed in proestrus at or near PND 70 [called PND 70 for simplicity]. Trunk blood was collected for determination of hormones as for the pups killed on PND 21. Reproductive organs were removed and evaluated in a manner similar to that for rats killed on PND 21. Treatment effects were evaluated with ANOVA with post-hoc Scheffé test.
Average genistein intake ( ± SEM) was 32.8 ± 1.0 μg/rat/day during the first week after weaning and 53.0 ± 3.0 μg/rat/day during the second week. [Given the mean weight of the rats killed at weaning (54 ± 1 g), the mean genistein consumption during the first week after weaning would have been 0.98 mg/kg bw/day. Genistein intake, shown in a graph, was estimated at about 100 μg/rat/day on PND 42 and 49, 70 μg/rat/day on PND 56, 90 μg/rat/day on PND 63, and 80 μg/rat/day on PND 70. Body weight was given only for the weight at termination near PND 70, 215 ± 3 g, giving an estimate of genistein intake of 0.37 mg/kg bw/day at the end of the experiment.] At weaning, rats that had been exposed to genistein weighed less than control rats (mean ± SEM: 54 ± 1 g genistein-exposed and 58 ± 1 g control). The ovaries and uteri of PND 21 females weighed less than the organs in the control group [estimated from a figure as 20 mg (genistein) compared to 25 mg (control) for the ovaries and about 200 mg (genistein) compared to 250 mg (control) for the uteri. Relative organ weight was not reported]. Serum LH appeared to differ markedly on PND 21 (mean ± SEM: genistein group 1990 ± 964 pg/mL compared to control group 270 ± 15 pg/mL), but statistical significance was not achieved due to the large variance [P = 0.127, t-test by CERHR using n = 4 litters per dose group]. Serum FSH was not shown to differ by dose group in PND 21 rats. 17β-Estradiol and progesterone serum concentrations were markedly decreased in the genistein-exposed rats on PND 21 (mean ± SEM: 17β-estradiol 3.9 ± 1.7 pg/mL genistein compared to 36.6 ± 4.1 pg/mL control, progesterone 1.2 ± 0.6 ng/mL genistein compared to 12.8 ± 1.5 ng/mL control). Follicular atresia was described as “conspicuous” in genistein-exposed ovaries assessed on PND 21. Follicular atresia was also present in the control ovaries, but “to a much lesser extent.” [Quantitative methods were not used.]
Compared to body weights of rats never exposed to genistein, PND 70 body weights were significantly lower in rats continually exposed to genistein and significantly higher in rats exposed to genistein prior to PND 21 and the control diet thereafter (mean ± SEM: continuous genistein 215 ± 3 g, control diet only 240 ± 5 g, genistein/control diet 281 ± 6 g). No treatment-group differences on PND 70 in serum LH, FSH, 17β-estradiol, progesterone, or in ovarian or uterine weight were detected. Although quantitative measures were not used, the authors stated that both groups of rats with genistein exposure prior to PND 21 had more frequent follicular atresia than rats never exposed to genistein. Animals exposed to genistein continuously until PND 70 were described as having hyperplastic and hypertrophic epithelia of the rete ovarii in three animals and flattened epithelia (as though by cystic dilatation) in the remaining two animals. [This reference to five animals in this treatment group (which started with four litters) is the only mention of how many individual animals were evaluated at PND 70 or at any other time.] The authors concluded that intrauterine and neonatal exposure to genistein may adversely affect reproductive processes in adult female rats.
Strengths/Weaknesses
A strength of this study is that it used isoflavone-free chow. Weaknesses included use of only one dose level of genistein, unknown purity of genistein, and small numbers of animals/group (n = 4). Data did not appear to have been analyzed on per litter basis. Body weights were decreased, but no data on feed consumption were presented. At weaning, organ weights were not related to body weights. The Expert Panel had little confidence in the reliability of the dose level determination in this study.
Utility (Adequacy) for CERHR Evaluation Process
This study is of limited utility in the evaluation process.
Hughes et al. (2004), supported by EPA, examined the effects of gestational and lactational genistein exposure on uterine organization in adulthood. A similar study was conducted with soy milk and is described in the CERHR Expert Panel Report on Soy Formula (Rozman et al., 2006). This study was conducted in Long-Evans hooded rats that were fed a phytoestrogen-free AIN-93G diet in which the soy oil was replaced with corn oil. Four dams [4 dams/group assumed] were randomly assigned to groups treated with genistein [purity not given] in corn oil at 0 or 15 mg/kg bw. Two positive control diethylstilbestrol groups (0.5 and 5 μg/kg bw) were used, and one group was exposed to genistein 15 mg/kg bw+ diethylstilbestrol 0.5 μg/kg bw. Dams were gavaged with the test compounds from GD 14 [day of vaginal plug not defined] to PND 21 (day of delivery = PND 1). On a mg/kw bw basis, the genistein dose was said to be 10–15 times the dose received through a traditional Asian diet. On a caloric basis, the diet was said to be equivalent to use of soybeans as the exclusive protein source. On PND 60, eight female offspring/group were killed and uteri were fixed in 4% paraformaldehyde for a histomorphometry examination and immunohistochemical analyses for PCNA, ERα, and progesterone receptor. Statistical analyses included ANOVA and Kruskal-Wallis test. The individual pups rather than the litter were considered the statistical unit. The pup-based analysis was said to be used because intrauterine position of pups, which was not considered, was said to have a greater impact on variances of outcomes than differences between dams.
The only effect of genistein compared to controls that was detected was a significant [~20%] increase in progesterone receptor expression in glandular epithelial cells. No effects of genistein treatment on luminal epithelial cell height, uterine proliferation, ERα expression in luminal or glandular epithelial cells, or progesterone expression in luminal epithelial cells were detected. Results observed with administration of genistein in combination with the low dose of diethylstilbestrol were similar to results observed with genistein alone. Significant effects in the high- and low-dose diethylstilbestrol groups compared to the control group included increased proliferation of luminal epithelial cells and increased expression of progesterone receptor in glandular epithelial cells. Additional significant effects in the high diethylstilbestrol group included increased luminal epithelial cell height and increased ERα expression in glandular and luminal epithelial cells. As discussed in the CERHR Expert Panel Report on Soy Formula (Rozman et al., 2006), exposure of dams to soy milk during the lactation period also increased expression of the progesterone receptor in uterine glandular epithelial cells of the offspring. The study authors concluded that exposure of developing rats to isoflavones within human exposure levels induces an effect in an estrogen-responsive uterine marker long after cessation of exposure. Concerns were noted because the progesterone receptor is involved in several reproductive processes.
Strengths/Weaknesses
A strength of this study is the use of phytoestrogen-free chow. Weaknesses include small numbers of litters/group (n = 4), administration of a single dose level of genistein (15 mg/kg bw), and not considering the litter as the experimental unit.
Utility (Adequacy) for CERHR Evaluation Process
This study is of limited utility due to the small numbers of animals and the single dose level used.
Casanova et al. (1999), from the Chemical Industry Institute of Toxicology (CIIT), obtained bred female Sprague-Dawley rats on GD 1 (the day after overnight cohabitation). Six pregnant animals per group were randomized to one of four diets: (1) a soy- and alfalfa-free diet in which casein and corn oil were used instead of soy meal, soy oil, and alfalfa meal; (2) the soy- and alfalfa-free diet with genistein [purity not specified] added at 20 mg/100 g feed (0.02% [20 ppm]); (3) the soy-and alfalfa-free diet with genistein added at 100 mg/100 g feed (0.1% [100 ppm]); and (4) the standard NIH-07 rodent diet, which contains 12% (by weight) soybean meal, 4% alfalfa meal, and 2.5% soy oil. HPLC showed genistein and daidzein to be undetectable in the soy- and alfalfa-free diet. The NIH-07 diet contained genistein 16.0 ± 1.6 mg/100 g feed and daidzein 14.4 ± 2.4 mg/100 g feed (mean ± SEM). [Using the mean feed consumption reported in the paper and an estimated dam weight of 250 g, genistein intakes would have been 20 mg/kg bw/day for the 0.02% diet, 87 mg/kg bw/day for the 0.1% diet, and 16 mg/kg bw/day for the NIH-07 diet.] Dams were permitted to litter and nurse their own young. Pups were sexed by anogenital distance and weighed as same-sex groups within litters within 24 hr of birth. Litter weights were monitored every 3 days. After weaning on PND 21, dams were killed and uteri inspected for implantation sites using 0.5% ammonium sulfide. Two or three pups of each sex per litter were killed at weaning for determination of gonad weight in both sexes and uterine weight in females. The remaining offspring were group housed by sex and maintained on the same diet as their dams. Individual offspring weight was determined on PND 21 and every 3 days thereafter. On PND 13, males were evaluated for thoracic nipple retention. Puberty was determined by vaginal opening or preputial separation. Females were killed at vaginal opening, and males were killed on PND 56. Ovaries, uteri, testes, and ventral prostates were weighed. Comparisons were made between groups using ANOVA with post-hoc Dunnett test. Both the litter and the pup were evaluated as the statistical unit.
Significant differences in females identified by the authors are shown in Table 38. No differences among treatment groups were detected in implantation sites per dam, live pups per litter, or litter weight at birth. Feed intake per dam and dam weight gain were decreased in the group fed the soy- and alfalfa-free diet supplemented with 0.1% genistein. Male offspring weight gain on PND 22–56 was also reduced significantly on this diet. [Trend testing by CERHR showed a significant decrease in weight associated with the amount of genistein added to the soy- and alfalfa-free diet.] No relationship was detected between treatment group and female offspring weight gain on PND 22–34. Anogenital distance in males was not affected by treatment group, but in females, anogenital distance was increased with the NIH-07 diet [and arguably with the addition of 0.1% genistein to the soy- and alfalfa-free diet, see Table 38]. Relative anogenital distance also was increased in females with the addition of genistein to the soy- and alfalfa-free diet. Age and weight at vaginal opening were advanced and uterine weight on PND 21 was increased with the addition of genistein 0.1% to the soy- and alfalfa-free diet.
Table 38.
Significant Findings in Female Offspring of Rats Given Genistein Through Diet
| Soy- and alfalfa-free diet+genistein concentration
|
||||
|---|---|---|---|---|
| Parameter | 0% | 0.02% | 0.1% | NIH-07 rodent diet |
| Dam weight gain GD 1–21, g | 183 ± 8 | 187 ± 12 (n = 4) | 158 ± 5a | 182 ± 6 |
| Feed intake/dam, GD 1–21, g/day | 25.4 ± 0.93 | 25.1 ± 0.9 | 21.7 ± 1.0* | 26.6 ± 1.2 |
| Anogenital distance in females, mm | 1.07 ± 0.03 | 1.05 ± 0.03 | 1.20 ± 0.04c | 1.21 ± 0.05* |
| Relative anogenital distance, mm/g × 103 | 153 ± 8b | 160 ± 5 | 180 ± 7* | 168 ± 7 |
| Age at vaginal opening, days | 32.0 ± 0.3 | 32.1 ± 0.8 | 29.6 ± 0.7 | 31.6 ± 0.5 |
| Weight at vaginal opening, g | 113.9 ± 3.8 | 105.9 ± 7.9 | 93.3 ± 2.8* | 114.5 ± 3.4 |
| Uterine weight PND 21, mg | 26.9 ± 1.3 | 24.2 ± 1.3 (n = 5) | 60.6 ± 5.2* | 27.4 ± 0.7 |
| Relative uterine weight PND 21, mg/g | 0.513 ± 0.0222 | 0.484 ± 0.020 (n = 5) | 1.248 ± 0.137* | 0.493 ± 0.012 |
Data expressed as mean ± SEM, n = 6/group except where indicated.
P < 0.05, ANOVA with post-hoc Dunnett test according to the authors.
According to the authors, the P value by Dunnett test was ≈ 0.05. [ANOVA by CERHR shows an overall P value < 0.05 but no significant differences of any treatment compared to the soy- and alfalfa-free diet with the Dunnett post-hoc test. Post-hoc t-test, however, gives P = 0.024 for the comparison of the third and first columns.]
[Test for linear trend by CERHR significant at P < 0.05 for the first three columns.]
The authors did not identify this anogenital distance as significantly increased, although the similarity to the anogenital distance in the NIH-07 group is evident. The lack of significance appears attributed to the use of the post-hoc Dunnett test. The use of either post-hoc Bonferroni or Newman-Keuls tests shows a significant increase in anogenital distance in this group.
From Casanova et al. (1999).
No differences by treatment were detected in the proportion of males with retained nipples, in age or weight at preputial separation, or in the weight (absolute or relative) of the testis (PND 21 or 56) or ventral prostate (PND 56) when the litter was considered the experimental unit. When the individual offspring was the experimental unit, relative testis weight was reported to be increased with the addition of genistein 0.1% to the soy- and alfalfa-free diet [per offspring data not shown, litter data are included in Table 39]. Absolute weight of the ventral prostate was reported also to have been reduced in this group when data were analyzed on a per offspring basis [per offspring data not shown, see Table 39]. Benchmark dose calculations are listed in Table 40.
Table 39.
Body, Testis, and Prostate Weight in Male Offspring of Rats Given Genistein Through Diet
| Soy- and alfalfa-free diet+genistein concentration
|
||||
|---|---|---|---|---|
| Parameter | 0% | 0.02% | 0.1% | NIH-07 rodent diet |
| Body weight gain PND 22–56, g | 288.7 ± 3.5a | 278.8 ± 6.3 | 265.7 ± 9.1b | 301.5 ± 3.7 |
| Testis weight PND 21, mg | 235 ± 6 | 236 ± 3 | 219 ± 6 | 253 ± 10 |
| Relative testis weight PND 21, mg/g | 4.25 ± 0.10 | 4.43 ± 0.07 | 4.53 ± 0.05 | 4.31 ± 0.05 |
| Testis weight PND 56, g | 2.88 ± 0.06 | 2.93 ± 0.07 | 2.81 ± 0.06 | 2.90 ± 0.12 |
| Relative testis weight PND 56, g/kg | 8.28 ± 0.14 | 8.76 ± 0.26 | 8.85 ± 0.28c | 8.01 ± 0.38 |
| Ventral prostate weight PND 56, g | 0.289 ± 0.010 | 0.318 ± 0.021 | 0.249 ± 0.009c | 0.320 ± 0.018 |
| Relative prostate weight PND 56, g/kg | 0.830 ± 0.028 | 0.950 ± 0.067 | 0.794 ± 0.040c | 0.875 ± 0.043 |
Data expressed as mean ± SEM, n = 6/group.
[Test for linear trend by CERHR significant at P < 0.05 for the first three columns.]
P < 0.05, ANOVA with post-hoc Dunnett test according to the authors.
[These values were said to be different from the values in the first column when the individual offspring was taken as the experimental unit. Per offspring data were not shown. The number of offspring per treatment group was not given.]
From Casanova et al. (1999).
Table 40.
Benchmark Dose Calculations for Rats Exposed to Genistein During Gestation, Lactation, and Following Weaning
| Genistein in diet, % [mg/kg bw/day] |
||||
|---|---|---|---|---|
| BMD10a | BMDL | BMD1 SD | BMDL1 SD | |
| Feed intake/dam, GD 1–21 | 0.0786 [74] | 0.0457 [43] | 0.0695 [65] | 0.0353 [33] |
| Male pup weight gain, PND 2–17 | 0.0879 [82] | 0.0515 [48] | 0.0819 [77] | 0.0459 [43] |
| Female pup weight gain, PND 2–17 | 0.0874 [82] | 0.0447 [42] | 0.112 [105] | 0.0548 [51] |
| Male pup weight gain, PND 22–56 | 0.136 [127] | 0.0827 [77] | 0.0719 [67] | 0.0422 [39] |
| Female pup weight gain, PND 22–34 | 0.0775 [73] | 0.0407 [38] | 0.0638 [60] | 0.0322 [30] |
| Male relative anogenital distance | 0.125 [117] | 0.0475 [44] | 0.156 [146] | 0.0667 [62] |
| Female relative anogenital distance | 0.0582 [54] | 0.0364 [34] | 0.0574 [54] | 0.0362 [34] |
| Relative testis weight, PND 21 | 0.183 [171] | 0.110 [103] | 0.0687 [64] | 0.0410 [38] |
| Relative testis weight, PND 56 | 0.192 [180] | 0.0864 [81] | 0.126 [118] | 0.0581 [54] |
| Relative uterus weight, PND 21b | 0.00554 [5] | 0.00345 [3] | 0.0254 [24] | 0.0185 [17] |
| Weight at vaginal opening | 0.0583 [55] | 0.0382 [36] | 0.0626 [59] | 0.0385 [36] |
See the footnote to Table 33 for an explanation of the use of benchmark dose in this report.
Linear model was used. [Genistein intake was estimated assuming a mean feed intake of 23.4 g/day (the mean of the two groups given treated feed) and a dam weight of 250 g.]
From Casanova et al. (1999).
The authors concluded that the soy- and alfalfa-free diet was capable of supporting normal pregnancy and offspring development, and that dietary levels of genistein comparable to the levels in the NIH-07 diet had “minimal effects, with the possible exception of a slight increase in the female [anogenital distance], on the parameters that we used to assess rat reproductive development during the perinatal period.” They contrasted the lack of a uterotrophic effect with the NIH-07 diet with the findings of Boettger-Tong et al. (1998) that a diet containing 21 mg genistein and 14 mg daidzein per 100 g of rat feed produced a uterotrophic response in immature ovariectomized rats, indicating that the effects of genistein on uterine growth in the intact animal may be more complex than simple additivity with the effects of native estrogens.
Strengths/Weaknesses
A strength of the study is the measurement of genistein and daidzein in the soy- and alfalfa-free and the NIH-07 diets. Feed consumption and genistein intake were determined. Anogenital distance measurements were corrected for body weight. Weaknesses of the study include the fairly small number of animals/group (n = 6) and the use of only two genistein dose levels.
Utility (Adequacy) for CERHR Evaluation Process
This study alone is of limited utility because only two dose levels were used, but data may be helpful when considering other studies.
Delclos et al. (2001), supported by NIEHS and FDA, conducted a preliminary study designed to identify dose ranges for a larger NTP study. Female Sprague-Dawley rats were given a soy- and alfalfa-free diet beginning 1 week before breeding. The day a vaginal plug was detected was GD 0. On GD 7, females were randomized to receive genistein (>99% purity) added to the soy- and alfalfa-free diet at 0, 5, 25, 100, 250, 625, and 1250 ppm [mg/kg feed]. The dosed feed was administered until weaning of pups on PND 21 (day of birth = PND 1). Five litters per dose group were retained for evaluation. On PND 2, litters were standardized to four males and four females where possible. Fostering within dose groups was used where necessary but was uncommon (five males ended up being fostered within dose groups). After weaning, offspring were kept on the same dietary treatment as their dam until the offspring were killed on PND 50. Dams were killed at weaning and serum genistein determined (reported in Holder et al., 1999; see Table 13 in Section 2.1.2.1). In-life evaluations included body weight, feed consumption, number of live and dead pups, live litter weight, sex ratio, gross malformations, anogenital distance on PND 2, and developmental landmarks, including vaginal opening and preputial separation. At necropsy on PND 50, selected organ weights were obtained. Uteri, ovaries, oviducts, and vaginas were fixed in Bouin fluid, embedded in paraffin, sectioned, and stained with hematoxylin and eosin. The right testis and epididymis were used for determination of homogenization-resistant testicular spermatids and epididymal sperm analysis. The left testis and epididymis were fixed in Bouin fluid, embedded in paraffin, sectioned, and stained with hematoxylin/PAS. Seminal vesicles, coagulating glands, preputial glands, and prostates were fixed in neutral buffered formalin, embedded in paraffin, sectioned, and stained with hematoxylin and eosin. Clinical chemistry and hematology tests were evaluated in blood in 2 rats/sex/litter. [No differences by treatment in clinical chemistry and hematology parameters were detected according to the authors; data were not shown.] Comparisons among groups were made with ANOVA and ANCOVA with post-hoc Dunnett test. Incidence and severity of lesions on histopathology evaluation were analyzed using the Jonckheere-Terpstra test with the Williams modification of the Shirley test for comparisons of genistein-dosed groups to the control.
Evaluation of the soy- and alfalfa-free diet by LC-electrospray MS showed a mean ± SD genistein concentration of 0.54 ± 0.31 ppm and a daidzein concentration of 0.48 ± 0.31 ppm. Genistein intakes of dams and offspring exposed to treated diets were estimated based on feed consumption (Table 41). Feed consumption and body weight were decreased in the pregnant dams at the highest genistein dose level (1250 ppm) based on pairwise comparisons on GD 20 and 21 and based on a significant trend from GD 12 onward. A significant trend with dose for gestational feed consumption and body weight gain was also identified. [Using a power function to model the dose–response relationship for dam body weight effect yielded a BMD102 of 380 ppm and a corresponding BMDL of 242 ppm; the BMD1 SD was 606 ppm, and the BMDL1 SD was 403 ppm. When feed consumption was modeled in a similar manner, the BMD10 was 540 ppm and the corresponding BMDL was 384 ppm, the BMD1 SD was 742 ppm, and the BMDL1 SD was 510 ppm. The data were modeled assuming that the total number of dams evaluated were the ones delivering a litter as indicated in Table 3 of the study.] There was no effect of genistein dose on body weight of the dam during the lactation period.
Table 41.
Genistein Intake Ranges (mg/kg bw/day) of Rats
| Pups after weaning (PND 21–50)
|
||||
|---|---|---|---|---|
| Dietary genistein (ppm) | Pregnant dams (GD 7–parturition) | Lactating dams (PND 1–14) | Male | Female |
| 5 | 0.23–0.38 | 0.21–0.90 | 0.48–0.66 | 0.50–0.68 |
| 25 | 1.39–1.97 | 1.29–4.33 | 2.56–3.53 | 2.44–3.43 |
| 100 | 3.58–7.72 | 3.26–17.76 | 8.16–13.12 | 9.60–13.96 |
| 250 | 10.86–18.65 | 10.81–48.73 | 24.19–35.45 | 26.04–36.56 |
| 625 | 27.75–39.31 | 29.59–116.53 | 57.84–82.02 | 62.29–85.47 |
| 1250 | 69.96–96.75 | 73.10–202.75 | 124.76–238.25 | 141.17–213.73 |
From Delclos et al. (2001).
The 1250 ppm genistein diet was associated with a decrease in the proportion of plug-positive dams that delivered litters (5/10, compared to 9/10 or 10/10 in the other groups). No effects of genistein treatment on the length of gestation, litter size, proportion of live pups, or sex ratio were detected. Mean live pup weight/litter was decreased (non-significantly) by treatment with 1250 ppm genistein. [The BMD10 using a linear model was 1848 ppm, the BMDL10 was 471 ppm, the BMD1 SD was 6704 ppm, and the BMDL1 SD was 1634 ppm; however, because there were no differences by pairwise analysis, the benchmark dose analysis may not be appropriate.] Significant main effects of dose or significant linear dose trends were identified in males for delays in righting reflex, eye opening, ear unfolding, and incisor eruption and in females for righting reflect, eye opening, and ear unfolding. [The BMD10 and BMDL values for these endpoints are shown in Table 42.] In addition, eye opening and ear unfolding were significantly delayed on pair-wise comparison in the 1250 ppm dose group. Anogenital distance on PND 2 was not affected by treatment in either sex. Preputial separation was not affected by genistein treatment; vaginal opening showed a significant linear dose trend for advancement. [Benchmark dose values for vaginal opening are given in Table 42.]
Table 42.
Benchmark Doses Using Developmental Landmarks for Which a Main Effect of Dose or Linear Trend Was Shown
| Dietary Genistein (ppm)
|
||||||||
|---|---|---|---|---|---|---|---|---|
| Male
|
Female
|
|||||||
| Landmark | BMD10 | BMDL10 | BMD1 SD | BMDL1 SD | BMD10 | BMDL | BMD1 SD | BMDL1 SD |
| Eye opening | 1085 | 927 | 614 | 409 | 1008 | 821 | 439 | 272 |
| Ear unfolding | 1216 | 1005 | 476 | 282 | 1353 | 812 | 974 | 587 |
| Righting reflex | 227 | 127 | 912 | 562 | 309 | 163 | 1118 | 640 |
| Incisor eruption | 1560 | 1074 | 668 | 453 | Trend not identified | |||
| Vaginal opening | N/A | 1277 | 1252 | 1205 | 494 | |||
See the footnote to Table 33 for an explanation of the use of benchmark dose in this report. A power model was used; n = 5 litters per dose group.
From Delclos et al. (2001).
Offspring body weight gain on pair-wise comparison was depressed in the 1250 ppm genistein group beginning on PND 14. Benchmark dose values for terminal body weight are shown in Table 43 for male and female offspring. There were apparent treatment-related effects on the absolute or relative weights of some organs, based on significant main effects of dose or significant linear or quadratic trends. These effects [and associated benchmark doses] are summarized in Table 43. There were no detected effects on absolute or relative weights of the testis, epididymis, dorsolateral prostate, or seminal vesicle/coagulating gland. Absolute and relative prostate weight decreased with increasing genistein exposure with a 28% decrement in ventral prostate weight in the group exposed to 1250 ppm genistein in the diet. There were no detected alterations in ovarian weight with treatment. Absolute and relative uterine weight showed a significant quadratic dose-trend with an inverted U-shaped dose–response curve. [The Expert Panel noted that the inverted U is due entirely to the response at 625 ppm dietary genistein, for which the variance was very large.]
Table 43.
Benchmark Dose Calculations Using Body and Organ Weights for Which a Main Effect of Dose or Linear Trend Was Shown
| Dietary genistein (ppm)
|
||||||||||
|---|---|---|---|---|---|---|---|---|---|---|
| Male
|
Female
|
|||||||||
| Body or organ | BMD10 | BMDL10 | BMD1 SD | BMDL1 SD | BMD10 | BMDL10 | BMD1 SD | BMDL1 SD | ||
| Body | ↓ | 1247 | 1062 | 1148 | 789 | ↓ | 1113 | 876 | 507 | 312 |
| Liver, absolute | ↓ | 1682 | 1189 | 1421 | 889 | Trend not identified | ||||
| Liver, relative | ↑a | 1288 | 1253 | 1237 | 1038 | ↑ | 1941 | 1240 | 836 | 531 |
| Thymus, absolute | ↓a | 633 | 456 | 632 | 435 | ↓ | 907 | 620 | 739 | 487 |
| Pituitary, absolute | ↑ | 952 | 572 | 954 | 579 | No adequate model | ||||
| Pituitary, relative | ↑a | 521 | 399b | 430b | 321b | Trend not identified | ||||
| Preputial gland, relative | ↑ | 425 | 267 | 791 | 511 | |||||
| Ventral prostate, absolute | ↓a | 447 | 340b | 519b | 373b | |||||
| Ventral prostate, relative | ↓a | 580 | 411 | 674 | 456 | |||||
| Uterus, absolute | No adequate model | |||||||||
| Uterus, relative | No adequate model | |||||||||
| Vagina, relative | ↑ | 114 | 609 | 1196 | 666 | |||||
See the footnote to Table 33 for an explanation of the use of benchmark dose in this report. A power model was used except where noted; n = 5 litters per dose group.
↓,↑ Direction of trend.
Statistically significant change in animals at the high dose (1250 ppm dietary genistein) compared to the control animals by Dunnett test, P < 0.05.
Linear model was selected.
From Delclos et al. (2001).
Histopathologic abnormalities were seen in the ovaries of the 1250 ppm group; abnormalities consisted of more numerous antral follicles in various stages of degeneration compared to the control ovaries. Corpora lutea were smaller and fewer in number in the 1250 ppm group and appeared not to regress at the normal rate. When follicle counts were performed in five sections from each ovary in 12–15 animals from each dose group, no differences by treatment in number of primordial, growing, and antral follicles were detected. Only normal follicles were counted, so the apparent increase in degenerating antral follicles in the high-dose group would not have been identified by this method. Uterine and vaginal histopathology in the high-dose group showed inappropriate combinations of changes reflecting estrus, metestrus, and diestrus. In the vagina, abnormal cellular maturation labeled as dyssynchronous was seen in 9/15 animals in the 1250 ppm group and 4/15 animals in the 625 ppm group. The authors felt these changes were consistent with increased progesterone effect, consistent with failure of the corpora lutea to involute appropriately. Mammary glands showed proliferation of alveolar complexes in the 250, 625, and 1250 ppm groups. There were elements of alveolar hyperplasia in all dose groups, but the severity of the hyperplastic process was increased in the 1250 ppm group.
In males, there was significant hypertrophy of mammary alveoli and ducts at 25 ppm and higher, with an increase in hyperplasia at 250 ppm and higher. [It is not clear that mammary gland hypertrophy is an adverse effect.] Abnormalities of spermatogenesis were seen in animals from all dose groups, consistent with the peripubertal status of these animals, but the severity of the abnormalities was increased in the 1250 ppm group. No difference by treatment group in testicular sperm head counts or epididymal sperm counts were detected. An increase in chronic inflammation of the dorsolateral prostate was seen in the 1250 ppm group.
The authors concluded that the 1250 ppm dietary level was clearly toxic and that most of the linear trends identified in the study were due to the effects at this high-dose level. They indicated that a dose of 500 ppm would be selected as the high dose for a planned multigenerational study to further characterize the effects of dietary genistein on the reproductive system.
Strengths/Weaknesses
Strengths of this study include six genistein dose levels in chow, the use of soy- and alfalfa-free chow, measurement of genistein and daidzein concentrations in chow, determination of feed consumption and genistein intake, and measurement of serum genistein concentration on PND 50. Except for histopathology data, the litter was used as the experimental unit. Many appropriate endpoints were examined. Weaknesses of the study include the use of only five litters/group in the follow-up evaluation and the lack of assessment of reproductive capability.
Utility (Adequacy) for CERHR Evaluation Process
This study is of moderate-to-strong utility based on the large number of dose levels used. The study was well-designed and executed with appropriate statistical analyses and endpoints.
NCTR (2005) conducted a multigenerational reproductive toxicity study in Sprague-Dawley rats, which is discussed in detail in Section 4.2.3. Results relevant to development are briefly summarized here. Rats were fed a soy- and alfalfa-free diet supplemented with 0, 5, 100, or 500 ppm genistein. Genistein doses in males were estimated by study authors at 0, 0.3, 7, and 35 mg/kg bw/day, and genistein doses in females were estimated at 0, 0.4, 9, and 44 mg/kg bw/day during periods when they were not lactating and at 0.7, 15, and 78 mg/kg bw/day during lactation periods. F0 rats were exposed from6 weeks of age through gestation and lactation periods and up to 140 days of age. F1 and F2 generations were exposed from weaning at 3 weeks of age through 140days of age, including gestation and lactation periods. F3 rats were exposed indirectly during prenatal development and during the lactation period but were not exposed following weaning at 21 days of age. F4 and F5 rats were not exposed to genistein at any point in their lives.
Developmental effects observed in the multigenerational study included decreased live litter sizes in F1, F2, and F3 generations of the high dose group. Body weights of pups were lower compared to controls during lactation in F1, F2, F3, and F4 females of the high-dose group, F1 and F3 males of the mid- and high-dose group, and in F2 and F4 males of the high-dose group. Body weight gain of pups during lactation was reduced in F1 males of the mid- and high-dose groups, F1, F3, and F4 females of the high-dose group, and F2, F3, and F4 males of the high-dose group. Dose-related reductions in anogenital distance were observed in F1 males and F1 and F2 females of the high dose group. Vaginal opening was accelerated and body weight at vaginal opening was lower in F1 and F2 females of the high dose group. Testicular descent was delayed in F3 rats of the high-dose group. In the 2 weeks following vaginal opening, extended estrous and diestrous phases of the estrous cycle were observed in F1 rats of the high-dose group and increased estrous cycle length was observed in F1 and F2 rats of the high dose group. Necropsy observations in adult males exposed during gestation and lactation included increased mammary gland hyperplasia in F1, F2, and F3 generations of the mid- and high-dose groups and renal lesions in F1 and F2 males of the mid- and high-dose groups.
A separate report (Hotchkiss et al., 2005) described a substudy in which bone parameters were evaluated in F1 and F3 animals. Three substudy groups (n = 12–43/sex/dose) consisted of F1 rats continued on the test diet to age 2 years, F1 rats continued on the test diet through PND 140 followed by control diet to age 2 years, and F3 rats weaned to control diet and followed to age 2 years. At 2 years, blood was collected for measurement of alkaline phosphatase and serum pyridinoline. The lumbar spine, removed from the carcass, and the caudal vertebrae were evaluated by dual photon x-ray absorptiometry for bone mineral density, bone mineral content, and bone area. The right femur was removed, decalcified, cross-sectioned at mid-shaft, and stained with hematoxylin and eosin for evaluation of cross sectional area and marrow area using a digital imaging system. No effects of genistein on bone mineral density were detected in any group. Bone mineral content and bone area were decreased in females in the 500-ppm groups, consistent with the smaller size of these animals compared to controls.
Strengths/Weaknesses
The experimental protocol for a multigenerational reproductive study conducted under the auspices of the NCTR was thorough and undertaken using GLP guidelines. Because of the expense, logistics, and record-keeping requirements, few laboratories can efficiently complete these types of studies.
Utility (Adequacy) for CERHR Evaluation Process
This study is useful in the evaluation process, showing that the highest dose of genistein, 500 ppm (about 35 mg/kg bw/day), was associated with adverse effects on development.
Kang et al. (2002), supported by the Brain Korea 21 project and the Korean FDA, examined the effects of maternal genistein exposure on development of reproductive organs in offspring. Pregnant Sprague-Dawley rats were fed AIN-76A, a casein-based soy-free diet. The rats were randomly assigned to groups of 9–12 and were gavaged with genistein (>98% purity) in corn oil at 0, 0.4, or 4 mg/kg bw/day from GD 6 (day following mating = GD 1) to PND 20 (day of parturition = PND 1); the dams were not dosed on PND 1–2. Genistein doses were based on intake in Asian populations. A positive control group was treated with 10 μg/kg bw/day 17β-estradiol. Upon weaning of litters, dams were killed and examined for implantation sites and organ weights. At birth, pups were sexed by measuring anogenital distance, weighed, and examined for toxicity, mortality, and gross abnormalities. During the postnatal period, pups were weighed and monitored for eye and vaginal opening. Offspring (n = 5–7/group/sex/time period) were killed on PND 21, 33, 49, 70, or 100. Body and reproductive organ weights (testis, seminal vesicle, prostate, uterus, and ovary) were measured; reproductive organs were examined histologically on PND 100. Testes were fixed in Bouin fluid, and all other tissues were fixed in 10% neutral buffered formalin. Sperm count and motility were assessed. Differential follicle counts were conducted on ovaries. Data were analyzed by 2-way ANOVA. [It was not stated if the litter was considered in statistical analyses.]
No effects of genistein treatment on dam body or organ weights, number of implantation sites, live pups, pups survival to weaning, sex ratio, anogenital distance, eye opening, or vaginal opening were detected. There were no observed effects of genistein exposure on postnatal weight gain in male or female offspring. Relative (to brain weight) organ weight effects included increased testis and seminal vesicle weight in the low-dose group on PND 33 and increased prostate weight in the high-dose group on PND 70. [Absolute organ weights were not reported.] Organ weight changes were transient, and no histopathologic effects were observed in testis, seminal vesicle, or prostate [data not shown]. On PND 100, genistein had no observed effect on sperm count or motility or on the cell types at stage VII of the spermatogenic cycle. Relative uterine weight was significantly increased in the low-dose genistein group on PND 33. [Absolute organ weights were not reported.] Organ weight changes were transient, and no abnormal histopathologic findings were observed in ovary or uterus [data not shown]. On PND 100, numbers of primordial follicles were slightly reduced in the high-dose group, but no significant alterations in follicle development were detected. Significant effects observed with 17β-estradiol included reduced relative seminal vesicle weight from PND 21–70, decreased numbers of elongated spermatids on PND 100, decreased relative uterus and ovary weights on PND 21, and increased relative ovary weight on PND 33. It does not appear that histopathologic examination was conducted in rats from the 17β-estradiol group. The study authors concluded that gestational and lactational exposure of rats to genistein at levels within the range of human intake appears to have no adverse effects on reproductive organs.
Strengths/Weaknesses
Strengths of this study include use of soy-free chow, random assignment of animals to treatment groups (9–12/group), and use of 17β-estradiol as a positive control. Because genistein was administered by gavage, the exact dose was known. Weaknesses of the study included use of only two genistein dose levels (0.4, 4 mg/kg bw), no treatment during parturition, no indication if the litter was used as the experimental unit, and no assessment of reproductive capability.
Utility (Adequacy) for CERHR Evaluation Process
This study is not useful in the evaluation process.
Takagi et al. (2004), supported by the Japanese Ministry of Health, Labor, and Welfare, evaluated the effects of dietary genistein on ethinyl estradiol developmental toxicity in CD®(SD) IGS rats. Pregnant rats were obtained on GD 3 (plug = GD 0) and fed a soy-free diet. Beginning on GD 15, rats were divided into 5 treatment groups (n = 6/group) and given: (1) soy-free diet; (2) dietary ethinyl estradiol 0.5 ppm alone; (3) dietary ethinyl estradiol 0.5 ppm with genistein (>97% pure) 100 ppm; (4) dietary ethinyl estradiol 0.5 ppm with genistein 1250 ppm; or (5) dietary genistein 1250 ppm alone. Dams were allowed to litter, and litters were standardized to eight (4/sex where possible) on PND 3. Culled pups were used to provide trunk blood for determination of testosterone and 17β-estradiol. Treatments were stopped on PND 11, and all dams were switched to a standard laboratory chow derived in part from soybeans. According to the supplier, the genistein content was 102 mg/kg feed [ppm], and the daidzein content was 87 mg/kg feed. Pups were weaned to this standard chow on PND 22 and housed with same-sex littermates up to 4/cage. Pups were observed for onset of puberty (preputial separation or vaginal opening), and during postnatal weeks 8–11 and 17–20, estrous cyclicity was monitored in 12 females/group (usually 2/litter). At least eight offspring/group were killed during postnatal week 11 for evaluation of weight and histopathology of pituitary, adrenal, mammary gland, ovary, uterus, vagina, testis, epididymis, and ventral prostate. Males were killed on the first day of postnatal week 11, and females were killed on the next diestrus after the first day of postnatal week 11, or on the first day if they entered postnatal week 11 in persistent estrus. An additional 8–13 females and an unspecified number of males were killed for similar evaluations at postnatal week 20. Comparisons were made by ANOVA with post-hoc Dunnett test or by Kruskal-Wallis H-test with post-hoc Dunnett rank-sum test. Proportions were compared with Fisher exact test and the severity of pathologic lesions with Mann-Whitney U-test [histologic change scored as −, ±, +, + +, or + + +].
No influence of the co-administration of genistein was detected on the effects of ethinyl estradiol. [Only the results of genistein alone in the diet will be given here.] Genistein 1250 ppm in the diet had no detected effect on dam feed consumption or body weight. Calculated mean ± SD genistein intake was 96.1 ± 8.3 mg/kg bw/day on GD 15–20 and 196.5 ± 12.7 mg/kg bw/day on PND 3–11. Litter size was significantly decreased to 12.2 ± 1.33 in the genistein group compared to a control value of 14.1 ± 1.17. There were no observed genistein-associated alterations in pup body weight on PND 3, pup body weight gain during the lactation period, or pup survival to weaning. No significant genistein-associated alterations in serum testosterone or 17β-estradiol on PND 3 were detected. [The authors described 17β-estradiol in males in the genistein group as “slightly increased without statistical significance.” The concentrations estimated from a graph were about 220 ± 80 pg/mL in the genistein-exposed group and 80 ± 20 pg/mL in the control group. Errors were not specified in the graph but were SD elsewhere in the paper. The number of animals in each group was not specified except as “5 blood samples/group” in the Methods.]
Age at puberty was said not to have been altered by genistein in either sex, although weight at preputial separation was greater in genistein-exposed males than in the control group (205.4 ± 17.6 g compared to 187.6 ± 13.5 g). [Age at preputial separation was 41.0 ± 2.0 days in the genistein exposed group compared to 39.4 ± 1.3 days in the control group, P = 0.0005, Student t-test by CERHR using the number of offspring indicated in the data table (22 control, 23 genistein). Using n = 6 litters, P = 0.08 for a comparison of age at preputial separation.] Monitoring of estrous cycles during post-natal weeks 8–11 showed prolonged diestrus in 7/12 genistein-exposed animals compared to 2/12 control animals. At postnatal weeks 17–20, the genistein-exposed group included 6/11 females with abnormal estrous cycles (two with prolonged estrus and four with prolonged diestrus) compared to 1/12 animals in the control group with prolonged estrus. At both time points, the proportion of animals with abnormal estrous cycles was statistically increased in the genistein-exposed group. There were no histologic alterations in any male organs and no alterations in body or organ weights in either sex at either termination time. There was an increased incidence of endometrial and mammary hyperplasia in females exposed to genistein when evaluated at 11 weeks of age; mammary hyperplasia was also increased at 20 weeks of age. The study authors indicated that glandular hyperplasia and mucinous changes in the vaginal epithelium occurred in those animals showing prolonged diestrus, and in 20-week-old animals, cystically enlarged atretic ovarian follicles were seen in animals with prolonged estrus. The authors concluded that “[the effect of genistein] at 1250 ppm during GD 15–PND 11 is irreversible to the female endocrine/reproductive system even by maternal exposure, despite the effects bring rather weak as compared with those of [ethinyl estradiol].”
Strengths/Weaknesses
Strengths of this study include use of soy-free chow, measurement of 17β-estradiol, estrone, and phytoestrogen levels in chow, determination of feed consumption and genistein intake, standardization of litters to eight pups on PND 3, and use of the litter as the experimental unit. A weakness of the study was use of only one genistein dose level (1250 mg/kg); all other doses were administered in combination with ethinyl estradiol. Other weaknesses are that treatment was stopped on PND 11 and reproductive capability of animals was not examined.
Utility (Adequacy) for CERHR Evaluation Process
This study alone is of low utility due to the single genistein dose level, but the data can be used to confirm/refute findings from other studies.
Roberts et al. (2000), supported by the University of Colorado and Colorado State University, evaluated the effects of dietary genistein during pregnancy on reproductive outcomes in male offspring. Pregnant Sprague-Dawley rats were obtained on PND 10 [plug day not specified]. Dams were maintained on a isoflavonoid-free diet (AIN) with the addition of genistein [purity not specified] at 0 (n = 8) or 5 (n = 16) mg/kg feed [ppm]. The genistein exposure level was calculated to ensure ingestion of genistein at a level of at least 50 μg/kg bw/day, which the authors interpreted as equivalent to human intake. [The authors cite Barnes et al. (1995) for this estimate of human intake. The Barnes et al. (1995) citation is a review article that gives genistein intakes in humans as 20–80 mg/day in Asia and 1–3 mg/day in the US. For a 60 kg woman, these intakes are 333–1333 μg/kg bw/day in Asia and 17–50 μg/kg bw/day in the US (mostly consumed as genistein glycoside). Roberts et al. (2000), in the study under discussion, assume a 300 kg bw rat needs to consume a diet with a genistein level of 2.5 mg/kg feed to ingest genistein 50 μg/kg bw/day. They doubled this feed level to ensure that the target genistein intake would be reached. Actual feed consumption was recorded, according to the methods section, but was not reported in the paper. The EPA Biologic Reference Value for a mature female rat is 0.08 kg feed consumed/kg bw/day (EPA, 1988); therefore, a 300-kg rat would consume 0.024 kg feed/day. The use of genistein 5 mg/kg feed would, under these circumstances, result in a daily genistein intake of 120 μg/kg bw (all aglycone).]
The treated or control diets were given to dams from GD 17 until weaning on PND 21 at which time eight of the genistein-exposed litters were given control diets, and the other eight litters were given the genistein diet. [Only male offspring were studied; no mention is made of whether litters were adjusted to include a uniform number of males prior to weaning.] Pups from four litters in each treatment group were killed for evaluation on PND 70, and the pups from the remaining four litters were killed on PND 130. Testes were obtained for histologic examination and spermatid counting, serum was obtained for radioimmunoassay of LH and FSH, and pituitaries were obtained for quantification of RNA for the β-subunit of FSH and LH. Statistical analysis was by one-way ANOVA with post-hoc Scheffé test. [There was no comment on whether litter of origin was considered in the analysis.]
No treatment-related differences in offspring body weight were detected on PND 21 or 70. On PND 130, both groups of genistein-exposed offspring weighed 11–15% less than the control offspring. Testis weight on PND 130 was 14% lower in animals exposed to genistein only prenatally and during lactation compared to control animals; animals exposed to genistein during prenatal life, lactation, and after weaning did not demonstrate a statistically significant reduction in testis weight on PND 130 (mean ± SEM: control 1.83 ± 0.06 g, exposure prena-tally, during lactation, and after lactation 1.72 ± 0.04 g, exposure prenatally and during lactation 1.58 ± 0.05 g). Epididymal weight was decreased in both genistein groups compared to control at PND 130. No treatment-related differences in testicular spermatid count were detected at either evaluation point. At the end of the lactation period (PND 21), genistein-exposed offspring compared to control offspring had a decrease in serum LH (mean ± SEM 174 ± 15.7 pg/mL compared to control value of 531 ± 72.8 pg/mL) and testosterone (0.88 ± 0.11 ng/mL compared to control value of 1.47 ± 0.23 ng/mL). No difference in serum FSH was detected. No significant differences between groups in hormonal measures on PND 70 were detected. On PND 130, both genistein-exposed groups had a mean 6–14% decrease in serum LH compared to controls without a significant difference in serum testosterone concentrations. Pituitaries from genistein-exposed PND 21 offspring contained less RNA for the β-subunit of LH than did control pituitaries. No treatment-related differences were detected in pituitary RNA for the β-subunit of FSH at any age or for the β-subunit of LH at the older ages. The authors concluded that “in utero and lactational exposure of male rats to dietary genistein did not have any negative impact on the pituitary gonadotropin gene expression, serum FSH and testosterone levels, and spermatogenesis at adulthood…although there was a significant reduction in serum LH levels.” They also indicated in the discussion that both groups of genistein-exposed offspring reproduced normally; this information was presented as an “unpublished observation.”
Strengths/Weaknesses
Strengths of this study include use of a semi-purified chow and the dietary cross-over design used at PND 21. Weaknesses include use of only one dose level of genistein (5 mg/kg feed), small numbers of animals/group (n = 4), and no examination of organ weights relative to body weight. It was not clear if the litter was considered the experimental unit in data analyses. The Expert Panel has little confidence in the dose level determinations for this study.
Utility (Adequacy) for CERHR Evaluation Process
This study is of low utility due to the single dose level.
Dalu et al. (2002), supported by NIEHS, FDA, and the Department of Energy, reported the effects of developmental exposures to dietary genistein on adult male Sprague-Dawley rats. This study was performed as part of a larger multigenerational reproductive study. At least 28 days prior to mating, parental F0 male and female rats were placed on a soy- and alfalfa-free diet to which genistein (>99% purity) was added at dose levels of 0, 5, 100, or 500 ppm [mg/kg feed]. Dietary analysis confirmed the lack of detectable genistein and daidzein in the basal diet and that genistein concentrations were within 10% of nominal levels. Within genistein-exposed F1 and F2 litters, half of the male pups were weaned to their parents’ diet and half were weaned to the control diet. Each of 12 litters was used to produce one or two pairs of males, with a pair consisting of males weaned to different diets (genistein-treated or control). The 12 litters gave rise to 17 pairs of male offspring, which were evaluated on PND 140. Trunk blood was collected for measurement of serum testosterone and dihydrotestosterone by RIA. Ventral and dorsal prostates and testes were dissected and weighed, after which they were frozen for later Western blot analysis of ERα and ERβ. Tissues from 6–10 animals/group were evaluated for histologic change by light microscopy. Generation and dose were treated as fixed effects and litter as a random effect in the statistical analysis. Significant effects from the mixed procedure of SAS® were evaluated by t-test adjusted for multiple comparisons.
Results are summarized in Table 44. The authors identified a decreasing trend in body weight in F1 rats exposed to genistein until PND 140. The significant effects on body and seminal vesicle weights identified in animals exposed to 5 ppm genistein were considered by the study authors as likely due to chance. There were no observed effects of treatment on reproductive organ histology. Serum testosterone and dihydrotestosterone showed an increasing linear trend in F1 rats exposed to genistein until PND 140.
Table 44.
Effects of Developmental Dietary Exposure to Genistein on Adult Male Rats
| Dose level (ppm)
|
Benchmark dose (ppm)a |
||||||
|---|---|---|---|---|---|---|---|
| Endpoint | 5 | 100 | 500 | BMD10 | BMDL10 | BMD1 SD | BMDL1 SD |
| F1 Genistein exposure discontinued at weaning | |||||||
| Body weight | ↔ | ↔ | ↔ | ||||
| Organ weight | |||||||
| Dorsolateral prostate | ↔ | ↔ | ↔ | ||||
| Ventral prostate | ↔ | ↔ | ↔ | ||||
| Seminal vesicles | ↔ | ↔ | ↔ | ||||
| Epididymides | ↔ | ↔ | ↔ | ||||
| Testes | ↔ | ↔ | ↔ | ||||
| Serum testosterone | ↓12% | ↔ | ↑28% | ||||
| Serum dihydrotestosterone | ↔ | ↑65% | ↔ | ||||
| ERα | |||||||
| Dorsolateral prostate | ↔ | ↔ | ↔ | ||||
| Ventral prostate | ↔ | ↔ | ↔ | ||||
| ERβ | |||||||
| Dorsolateral prostate | ↓32% | ↓41% | ↓43% | 192 | 130 | 869 | 508 |
| Ventral prostate | ↔ | ↓52% | ↔ | ||||
| F1 Genistein exposure continued until PND 140 | |||||||
| Body weight | ↔ | ↔ | ↓7%b | 506 | Failed | 520 | Failed |
| Organ weight | |||||||
| Dorsolateral prostate | ↔ | ↔ | ↔ | ||||
| Ventral prostate | ↔ | ↔ | ↔ | ||||
| Seminal vesicles | ↔c | ↔ | ↔ | ||||
| Epididymides | ↔ | ↔ | ↔ | ||||
| Testes | ↔ | ↔ | ↔ | ||||
| Serum testosterone | ↔c | ↔ | ↑95%c | 37 | 28 | 74 | 61 |
| Serum dihydrotestosterone | ↔ | ↑80% | ↑218%c | 37 | 18 | 181 | 83 |
| ERα | |||||||
| Dorsolateral prostate | ↔ | ↓41% | ↔ | ||||
| Ventral prostate | ↔ | ↔ | ↓26% | 464 | 201 | 514 | 495 |
| ERβ | |||||||
| Dorsolateral prostate | ↔ | ↔ | ↔ | ||||
| Ventral prostate | ↔ | ↔ | ↔ | ||||
| F2 Genistein exposure discontinued at weaning | |||||||
| Body weight | ↓3% | ↔ | ↑3% | ||||
| Organ weight | |||||||
| Dorsolateral prostate | ↔ | ↔ | ↔ | ||||
| Ventral prostate | ↔ | ↔ | ↔ | ||||
| Seminal vesicles | ↔ | ↔ | ↔ | ||||
| Epididymides | ↔ | ↔ | ↔ | ||||
| Testes | ↔ | ↔ | ↔ | ||||
| Serum testosterone | ↔ | ↔ | ↔ | ||||
| Serum dihydrotestosterone | ↔ | ↔ | ↔ | ||||
| ERα | |||||||
| Dorsolateral prostate | ↔ | ↔ | ↔ | ||||
| Ventral prostate | ↔ | ↔ | ↔ | ||||
| ERβ | |||||||
| Dorsolateral prostate | ↔ | ↔ | ↔ | ||||
| Ventral prostate | ↔ | ↓20% | ↔ | ||||
| F2 Genistein exposure continued until PND 140 | |||||||
| Body weight | ↔c | ↔ | ↔b | ||||
| Organ weight | |||||||
| Dorsolateral prostate | ↔ | ↔ | ↔ | ||||
| Ventral prostate | ↔ | ↔ | ↔ | ||||
| Seminal vesicles | ↔ | ↔ | ↔ | ||||
| Epididymides | ↔ | ↔ | ↔ | ||||
| Testes | ↔ | ↔ | ↔ | ||||
| Serum testosterone | ↔c | ↔ | ↔ | ||||
| Serum dihydrotestosterone | ↔ | ↔ | ↔ | ||||
| ERα | |||||||
| Dorsolateral prostate | ↔ | ↔ | ↔ | ||||
| Ventral prostate | ↔ | ↔ | ↔ | ||||
| ERβ | |||||||
| Dorsolateral prostate | ↔ | ↔ | ↔ | ||||
| Ventral prostate | ↔ | ↔ | ↔ | ||||
↑,↓,↔ Statistically significant increase, decrease, or no change.
See the footnote to Table 33 for an explanation of the use of benchmark dose in this report. The number of animals used in the benchmark dose calculations was the lowest number of the range given in the report or 12 if no range was given. A power model with unequal variances was used.
Value is significantly less than the corresponding value for the group (within dose and generation) that discontinued genistein exposure at weaning.
Value is significantly greater than the corresponding value for the same group (within dose and generation) that discontinued genistein exposure at weaning.
From Dalu et al. (2002).
The authors called attention to the genistein-associated depression of ERβ in the dorsolateral prostate. [This effect was almost entirely restricted to the F1 generation.] They concluded that the “apparent down-regulation of this receptor by genistein may have implications for reproductive toxicity and carcinogenesis.”
Strengths/Weaknesses
Strengths of the study include use of soy- and alfalfa-free chow, analysis of chow for genistein and daidzein content, determination of genistein stability in chow, use of three genistein doses (5, 100, 500 mg/kg feed), and use of 12 litters per treatment group. Other strengths included the cross-over experimental design to determine reversibility of effects, multigenerational exposure, and use of the litter as the experimental unit. A weakness was evaluation of only males. Although data were presented on F2 animals, no data were presented on reproductive performance of F1 males.
Utility (Adequacy) for CERHR Evaluation Process
This study is of moderate-to-high utility based on treatment occurring during appropriate times of development, evaluation of relevant endpoints, and sufficient numbers of animals.
You et al. (2002a), from CIIT, evaluated the developmental effects of dietary genistein alone and in combination with methoxychlor, a pesticide with an estrogenic metabolite (2,2-bis-(p-hydroxyphenyl)-1,1,1-trichloroethane [HPTE]). HPTE has ERα agonist activity and ERβ antagonist activity. Timed-mated Sprague-Dawley rats were obtained on GD 0 (the day sperm were found in the vaginal smear). Animals were randomized by weight to one of six groups (eight animals per group). A control group was given untreated feed (a soy- and alfalfa-free diet). Treated animals were given the same feed with the addition of genistein (>98% pure), methoxychlor (~95% pure), or both. The five diet combinations were: (1) methoxychlor 800 ppm; (2) genistein 300 ppm; (3) genistein 800 ppm; (4) genistein 300 ppm+methoxychlor 800 ppm; and (5) genistein 800 ppm+methoxychlor 800 ppm. The 300 ppm dose of genistein was selected to approximate the amount of genistein in the NIH-07 rodent diet. The 800 ppm doses of genistein and methoxychlor were both based on previous studies showing endocrine effects at these exposure levels.
Dams were maintained on their assigned diets during pregnancy and lactation. Offspring were housed with their dams until weaning on PND 21. [No statement was made about culling.] On PND 22, one pup/sex/litter was killed and brain, liver, testis, ventral prostate, and uterus were dissected, weighed, and fixed in neutral buffered formalin for histologic evaluation. [A subset of these animals had mammary glands evaluated (You et al., 2002b), discussed in Section 3.2.2.] Dams were killed at this time and uteri evaluated for implantation sites. Retained offspring were housed four to a cage by litter and sex and fed with their dam’s assigned diet until PND 90. Animals were observed for vaginal opening (from PND 25) and preputial separation (from PND 35). Daily vaginal smears were taken for 2 weeks following vaginal opening to characterize the estrous cycle. On about PND 55, housing was changed to 2/cage by sex and litter. On PND 64–65, one male and one female from each litter were tested for spontaneous locomotor activity using a photo beam activity sensor system during the light phase of the photoperiod. On PND 64, animals were evaluated for 60 min following an i.p. dose of saline, and on PND 65, the same animals were evaluated after an i.p. dose of amphetamine. On about PND 110, three males (when possible) and one female offspring per litter were killed and organ weights obtained. On PND 120, estrous cyclicity was assessed for 3 weeks with daily vaginal smears in two females/litter. One of the two females/litter had been switched on PND 90 to the soy- and alfalfa-free diet without added genistein or methoxychlor. Statistical comparisons were made with two-way ANOVA (genistein and methoxychlor as treatment factors). Body weight was used as a covariate when organ weights were analyzed. When observations were repeated over time, a repeated-measures ANOVA was used. When endpoints were assessed in more than one pup/sex/litter, a nested model was used to account for possible litter effects.
Offspring were weighed at birth, weekly during lactation, and on about PND 30, 55, and 100. Intakes of genistein and methoxychlor were estimated based on these weights and feed consumption, which was assessed by cage over a 3–4-day interval at various time periods. Feed intake was noted to be reduced by both genistein and methoxychlor. Estimated genistein intakes are given in Figure 3. Pregnancy exposures of the dam varied the least among groups given the same genistein feed concentration, ranging from ~19–30 mg/kg bw/day at 300 ppm genistein and from 42–64 mg/kg bw/day at 800 ppm genistein. Among offspring, genistein intake on a weight basis was greatest among prepubertal animals and decreased with age. The relatively high intake among prepubertal animals was attributed by the authors to a higher ratio of feed intake to body weight at this life stage than at older ages. There was little effect of methoxychlor on weight-adjusted genistein intake, which was attributed by the authors to a commensurate reduction in feed intake and body weight in animals exposed to methoxychlor. Estimated methoxychlor intake was 42–64 mg/kg bw/day in pregnant dams, 44–132 mg/kg bw/day among male offspring, and 52–120 mg/kg bw/day among female offspring. The presence of genistein in the diet did not affect methoxychlor intake except among prepubertal males. Lactation exposures were not estimated.
None of the treatments were shown to affect the number of implantation sites, embryo loss, or sex ratio. Genistein “marginally” increased litter size (P = 0.051). The mean ± SD litter size in controls was 11.0 ± 1.6. Mean litter size in the group given 300 ppm genistein was 11.6 ± 1.8, and in the group given 800 ppm genistein, the mean litter size was 12.9 ± 1.8. [n = 8 litters/dose group. Test for linear trend performed by CERHR gave P = 0.04 for these data; BMD103 = 502 ppm, BMDL10 = 252 ppm, BMD1 SD = 700 ppm, and BMDL1 SD = 392 ppm.] The body weight of male newborns was not shown to be affected by either genistein or methoxychlor treatment, although there was a significant interaction between the two treatments. The birth weight of female offspring was reduced by both treatments and by the interaction between the treatments. The mean ± SD birth weight of control females was 7.09 ± 0.34 g. In the group exposed to genistein 300 ppm, female birth weight was 7.06 ± 0.63, and in the group exposed to genistein 800 ppm, female birth weight was 6.51 ± 0.35 [n = 8 litters/dose group; BMD10 = 812 ppm, BMDL10 = 765 ppm, BMD1 SD = 751 ppm, and BMDL1 SD = 378 ppm]. No effect of treatment on anogenital distance on PND 1 was detected. Treatment was said to have affected dam body weight at the end of the lactation period [data including the direction of the body weight change were not given].
Offspring body weight on PND 22 [PND 21 is indicated in a data table] was decreased about 15% in males and 16% in females in the 800 ppm genistein exposure group. [For males, BMD10 = 779 ppm, BMDL10 = 382 ppm, BMD1 SD = 791 ppm, and BMDL1 SD = 415 ppm; for females, BMD10 = 595 ppm, BMDL10 = 340 ppm, BMD1 SD = 598 ppm, and BMDL1 SD = 323 ppm.] Genistein exposure did not affect PND 21 liver, brain, ventral prostate, testis, or uterine weights. Methoxychlor treatment resulted in a 3-fold increase in uterine weight. Genistein at 800 ppm delayed preputial separation when body weight was used as a covariate. [The magnitude of the delay could not be estimated from the information provided.] There was an interaction between methoxychlor and genistein in delaying preputial separation. [Genistein added about 0.5 day of delay, estimated from a figure, and 1.3 days of delay according to the mean age of preputial separation given in the text.] Vaginal opening was accelerated by genistein at both exposure levels. The average day of vaginal opening in the control females was PND 34; 300 ppm genistein advanced mean day of vaginal opening to PND 32, and 800 ppm genistein advanced mean day of vaginal opening to PND 28. A possible interaction between methoxychlor and genistein in vaginal opening could not be evaluated due to missing data.
Offspring body weight on PND 110 [PND 100 is indicated in the data table in the paper] was reduced 10% in males and 8% in females by exposure to 800 ppm genistein. [For males, BMD10 = 812 ppm, BMDL10 = 547 ppm, BMD1 SD = 689 ppm, and BMDL1 SD = 364 ppm; for females, BMD10 = 802 ppm, BMDL10 = 630 ppm, BMD1 SD = 794 ppm, and BMDL1 SD = 544 ppm.] No treatment-related effects of genistein on weights of the ventral prostate, testis, epididymis, liver, brain, adrenal, uterus, or ovary were detected. Pituitary weight was increased 30% in male offspring exposed to 800 ppm genistein. No treatment effect on female pituitary weight was detected.
Genistein-related alteration in the estrous cycle during the 2 weeks following vaginal opening was not detected; however, in adult females, the time spent in estrus was increased. [According to the text, the increase was seen in the 300 and 800 ppm groups; however, the bar graph showing the data clearly does not illustrate an effect at 300 ppm. The height of the bar indicating time spent in estrus is lower for the 300 ppm group than for the control group.] Withdrawal of genistein treatment for a month prior to estrous cycle evaluation did not prevent the increased time spent in estrus, leading the authors to suggest that the alteration was not reversible. Histologic examination of male and female tissues showed no genistein-related changes; the only alterations noted were in the ovaries of methoxychlor-exposed animals, including animals exposed to methoxychlor+genistein. There were no effects of either genistein or methoxychlor, alone or in combination, on motor activity.
The authors noted that genistein is often identified by in vitro studies as a more potent estrogen than methoxychlor; however, in this in vivo study, methoxychlor appeared more estrogenic than genistein. Differences in kinetics were mentioned as a possible explanation for the differences in activities, but the authors also concluded, “…factors other than reactivity with sex hormone receptors may be responsible for some of the biologic effects of these compounds.”
Strengths/Weaknesses
Strengths of the study include use of soy- and alfalfa-free chow, verification of uniform genistein blending in chow, determination of feed consumption and genistein intake, and use of the litter as the experimental unit. The cross-over design was useful for examining reversibility of effects on estrous cyclicity (PND 90). Weaknesses of the study included the use of only two genistein dose levels (300, 800 mg/kg bw), fairly small numbers of animals/group (n = 8), lack of examination of reproductive function, lack of mention that the authors verified the stability of the test materials in diet, measurement of pup body weights on approximate PNDs rather than exact PNDs, and fixation of testes in formalin, which is not the best fixative for histologic examination of this tissue. Genistein 800 ppm decreased maternal feed consumption during gestation and lactation, which could have impacted other results (e.g., newborn female body weights). The authors stated increase in the amount of time in estrus in adult females relative to controls is not verifiable from the study figure for the 300 ppm group. Sample sizes were insufficient for motor activity measurements as noted by the high coefficient of variation. Different potencies were exhibited in vivo (methoxychlor>genistein) than in vitro in the transcriptional activation assays for estrogenic activity (genistein>methoxychlor). Furthermore, genistein did not potentiate the effects of methoxychlor in vitro (androgen receptor transcriptional activation assay), but appeared to augment methoxychlor effects in vivo by extending the methoxychlor-induced delay in preputial separation. The high dose of methoxychlor was not realistic; consequently, the data may not reflect the interactions of these agents at low dose levels.
Utility (Adequacy) for CERHR Evaluation Process
This study is of limited-to-moderate utility based on use of only two doses, but the data may be helpful in corroborating data from other reports.
Laurenzana et al. (2002), from the FDA and NIEHS, examined the effects of genistein exposure on ERα expression and on hepatic enzymes involved in testosterone metabolism. From GD 7 (plug date = GD 0) through weaning of offspring on PND 21 [day of birth not defined], five Sprague-Dawley rats/group were fed 5K96, a soy- and alfalfa-free diet, to which genistein (>99% purity) was added at 0, 25, 250, or 1250 ppm. Study authors estimated genistein doses at 2–200 mg/kg bw/day. Litters were culled to four males and four females on PND 4. Offspring were fed the genistein-containing diets [assuming the same diet fed to dams] from weaning through PND 50. Offspring were killed, and liver microsomes were obtained for in vitro analysis of 5α-reductase activity by incubation with testosterone, followed by thin-layer chromatography analysis of generated metabolites. Microsomal CYP2C and CYP3A protein levels were determined by Western blot. Cytosolic ERα was quantified using an immunohistochemical method and Western blot. Each analysis was conducted in three or four rats/sex/group. [It was not stated how offspring from different litters were distributed among dose groups.] Statistical analyses included one-way ANOVA, Kruskal-Wallis test, and Dunnett test.
Significant effects of genistein treatment on 5α-reductase-generated metabolites in males included ~2-fold increases in dihydrotestosterone (5α-androstan-17β-ol-3-one)/5α-androstane-3β (3-diol) and 7α-hydroxytes-tosterone metabolites at the 250 ppm dose [~20 mg/kg bw/day based on authors’ estimate for the 25 mg/kg bw/day group]. A similar increase in dihydrotestosterone/3-diol metabolites was reported for females of the 250 ppm group [data were not shown]. Significant effects on testosterone metabolites generated through CYP2C11 included ~2-fold reductions in formation of 2α-hydroxy- and 16α-hydroxytestosterone in the 1250 ppm group. Significant effects on CYP expression in male rats included an approximately 75% increase in CYP3A protein at the 250 ppm dose but about a 50% decrease at the 1250 ppm dose. CYP2C protein expression was numerically increased in males of the 250 ppm dose and decreased at the 1250 ppm dose, but the effect did not attain statistical significance. No effects on CYP protein expression were observed in female rats [data were not shown]. ERα levels in liver cytosol were significantly increased in females and decreased in males of the 1250 ppm group. The study authors concluded that genistein can influence activity of testosterone metabolizing enzymes and ERα expression, but the effects cannot be directly associated with estrogenic activity.
Strengths/Weaknesses
Some of the rats in this study were from the Delclos et al. (2001) study. Strengths included use of soy- and alfalfa-free chow, use of three genistein doses (25, 250, 1250 mg/kg bw), determination of feed consumption and genistein intake, and standardization of litters on PND 4. A weakness is that it was not clear if the litter used as the experimental unit.
Utility (Adequacy) for CERHR Evaluation Process
Endpoints examined are of limited utility alone in determining developmental effects, but may be helpful in interpreting results from other studies.
Masutomi et al. (2003), supported in part by grants from the Japanese Ministry of Health, Labor, and Welfare, examined the effects of genistein exposure during the perinatal period. CD®(SD)IGS rats were fed CRF-1, a regular rodent diet containing soy, except from GD 3 (day of vaginal plug = GD 0) to PND 21 (day of delivery = PND 1) when the rats were given soy-free diet. Soy-free diet was prepared according to the NIH-07 formulation except that soy meal and oil were replaced with ground corn, wheat, and corn oil. Rats were randomly assigned to groups of five or six and given soy-free diet containing genistein (>97% purity) 0, 20, 200, or 1000 ppm [mg/kg feed] from GD 15 to PND 10. Mean genistein intakes during gestation and lactation were estimated by study authors at 1.3–2.1, 13.7–23.0, and 66.6–113.1 mg/kg bw/day. The highest genistein dose was selected to produce weak systemic effects on the dam (e.g., decreased body weight gain) without affecting reproductive parameters. On PND 2, pup body weights and anogenital distance were measured. Litters were culled to five to eight pups on PND 10. On PND 21, pups were weaned and given the CRF-1 diet. Five offspring/sex/group were necropsied on PND 21 for measurement of organ weights and volume of the sexually dimorphic nucleus of the pre-optic area (SDN-POA). Onset of puberty in males and females and estrous cyclicity in 8–11-week-old females was determined in eight offspring/sex, which were ultimately killed and necropsied at 11 weeks of age. Females were killed during diestrus. Brain, adrenal, testis, ovary, uterus, pituitary, and ventral prostate weights were measured. Testes were fixed in Bouin fluid, and all organs except brain were examined histologically. Treatment groups from both time periods consisted of at least one pup/sex/litter. The litter was considered the statistical unit in evaluations conducted during the lactation period. For offspring data collected after weaning, individual animals were considered the statistical unit. Statistical analyses included Bartlett test, one-way ANOVA, Dunnett test, Kruskal-Wallis H-test, Dunnett-type rank-sum test, Fisher exact probability test, and Mann-Whitney U-test.
A tendency for decreased body weight gain during gestation was observed in dams of the high-dose group. No effects on feed intake during gestation or lactation were detected. Live litter sizes were not shown to be affected by genistein treatment. In offspring necropsied during the prepubertal period, no significant effects on body weight gain, anogenital distance, or brain, adrenal, testis, ovary, or uterus weights were detected. In controls and in all treatment groups, volume of SDN-POA was ~10 times higher in males than in females. In offspring necropsied in adulthood, there was a significant decrease in body weight gain in males of the high-dose group on PND 21–42. No effect of genistein treatment on onset of vaginal opening or preputial separation was detected. Body weights of high-dose males were significantly lower than controls at the time of preputial separation. All genistein-treated females had normal estrous cycles. All treated groups of males had significantly lower body weights than controls at necropsy. Significant organ weight changes in males included increased relative brain weight at the low dose, decreased absolute pituitary weight at the high dose, increased relative pituitary weight at the low dose, and increased relative adrenal weight at the mid and high dose. The study authors attributed organ weight effects to body weight changes. There were no histopathologic changes in those organs or other male organs, including testis and ventral prostate. Large atretic follicles were observed in ovaries of two females from the mid-dose group and one female of the high-dose group. However, no changes in mean numbers of secondary follicles or large atretic follicles per unit area were detected.
The study authors concluded that parameters related to sexual development were unaffected by genistein treatment. Reduced body weights of males after treatment ended was unexpected and of unknown biologic significance.
Strengths/Weaknesses
Strengths of this study included use of soy-free chow with similar nutritional contents as soy-containing chow, use of three genistein dose levels, determination of feed consumption and genistein intake, and standardization of litter size on PND 10. Phytoestrogens were measured in chow, but no method and few data were presented. Estrous cycles were determined in adult females so all were sacrificed at the same stage of the cycle. Weaknesses of the study include cessation of genistein exposure on PND 10 and no assessment of reproductive capability of adult offspring. It is assumed that animals selected at weaning for further analysis were selected randomly.
Utility (Adequacy) for CERHR Evaluation Process
This study is of moderate-to-high utility based on thorough and careful collection of experimental data and exposure during relevant periods, but is limited by exposure duration.
Masutomi et al. (2004), supported by the Japanese Ministry of Health, Labor, and Welfare, reported immunohistochemistry studies performed on the pituitary glands obtained in the previous study (Masutomi et al., 2003). Pituitaries from five animals per time point were evaluated at postnatal weeks 3 and 11 after maternal dietary genistein exposures of 0, 20, 200, or 1000 ppm [mg/kg feed] from GD 15 to PND 10. Immunohisto-chemistry was performed for LH, FSH, and prolactin. No effects of the treatments on the proportion of pituitary cells staining for any of these hormones were detected. The authors concluded that the exposure to genistein under the experimental conditions did not affect the developing hypothalamus-pituitary axis.
Strengths/Weaknesses
The chow and experimental design were the same as in studies by Takagi et al. (2004) and Masutomi et al. (2003). These studies have similar strengths and weaknesses.
Utility (Adequacy) for CERHR Evaluation Process
Endpoints examined are of limited utility in determining developmental effects, but data may be helpful in interpreting results from other studies.
Fritz et al. (2002b), funded by the Department of Defense (DoD) and NIH, evaluated the effects of dietary genistein on the developing prostate in Sprague-Dawley rats. Seven-week-old females were placed on a phytoestrogen-free diet to which genistein (98.5% pure) was added at concentrations of 0, 25, or 250 mg/kg feed [ppm]. After 2 weeks on the diet, animals were mated and allowed to litter. On PND 1, pup body weight and anogenital distance were determined and litters were standardized to 10 pups. [Sex ratio after culling was not given. The number of offspring for most evaluations appears to have been 16/group in the animals exposed from gestation through PND 70; the number of litters or distribution of animals among litters was not indicated. For sex ratio, at least eight litters and more than 80 offspring were said to have been evaluated for each group.] Pups were weaned on PND 21 to the diet assigned to their dams until the pups were killed on PND 70. Separate groups of male rats were fed the phytoestrogen-free diet with genistein added at 0, 250, or 1000 mg/kg feed [ppm] on PND 57–65. On PND 66–70, the phytoestrogen-free diet was given without added genistein and animals were gavaged once daily with genistein in sesame oil at 0, 22, or 88 mg/kg bw/day, which approximated the daily genistein dose of the 0, 250, and 1000 ppm dietary treatments. The gavage treatments were used in place of dietary treatments at the end of the experiment to control more precisely the amount and timing of exposure. Animals were killed 9 hr after the genistein dose on PND 70. In both experiments, the dorsolateral prostates were dissected and frozen for subsequent study. Tissues were also fixed in 4% paraformaldehyde, embedded in paraffin, sectioned, and stained with hematoxylin and eosin for light microscopy. Homogenized prostate was evaluated by Western blot for ER and androgen receptor. RT-PCR was used to quantitate ER and androgen receptor RNA in comparison to β-actin. Serum testosterone and dihydrotestosterone were determined by RIA [source of serum not specified]. Statistical analysis was by ANOVA with post-hoc Tukey test. [It appears that the groups treated only as adults were added to include a 1000 ppm exposure level for further evaluation of effects on sex hormone receptors noted in the experiment with prenatal and lifetime exposures.]
Animal weight and feed intake were not given, except for terminal body weights of 414–422 g. [The estimates of 22 and 88 mg/kg bw/day used to determine the gavage doses corresponding to the 250 and 1000 ppm treatments in the second experiment suggest that feed intake was about 36 g/rat. This estimate appears reasonable to the Expert Panel.] Serum total genistein on PND 70 was reported [method of analysis not given] to be 18–28 nM [5–8 μg/L aglycone equivalent] for animals not given genistein, 167 nM [45 μg/L aglycone equivalent] for animals fed 25 ppm genistein in the diet, 1785–1908 nM [482–516 μg/L aglycone equivalent] for animals fed 250 ppm genistein in the diet, and 9640 nM [2605 μg/L aglycone equivalent] for animals given 1000 ppm genistein in the diet. [Values are means; single values represent dose groups used in only one of the two experiments, and ranges represent values obtained in the two different experiments. These serum values are also discussed in Section 2.]
Exposure to genistein during gestation, lactation, and through PND 70 had no observed effect on sex ratio, male anogenital distance, age at testicular descent, or on body or reproductive organ weight at PND 70. No effects of treatment on reproductive organ histology were detected. Serum testosterone was increased by treatment in these animals. Values were 2.61 ± 0.15 ng/mL for the control group, 3.28 ± 0.20 ng/mL for the 25 ppm group, and 3.36 ± 0.29 ng/mL for the 250 ppm group (P>0.05 [error not given, but appears to be SEM (and SEM is used elsewhere in the paper); n = 8 males per dose group, number of litters or litter of origin not specified]. Benchmark dose calculations for serum testosterone levels are listed in Table 45. Dihydrotestosterone was not significantly affected by treatment in this experiment. In the group of animals treated only as adults, testosterone was characterized by the authors as increased by genistein treatment, although there was no effect of treatment by statistical analysis. The serum testosterone values were 1.97 ± 0.23 ng/mL in the control group, 3.10 ± 0.41 ng/mL in the 250 ppm group, and 3.40 ± 0.70 ng/mL in the 1000 ppm group [error not indicated but assumed to be SEM]. Serum dihydrotestosterone was not shown to be affected by treatment in this experiment.
Table 45.
Benchmark Dose Calculations for Serum Testosterone Concentrations in Male Rats Fed Genistein From Conception Until 10 Weeks of Age or From 8 to 10 Weeks of Age
| Benchmark dosea (mg/kg diet [ppm])
|
||||
|---|---|---|---|---|
| Treatment period | BMD10 | BMDL10 | BMD1 SD | BMDL1 SD |
| Lifetime | 149 | 69 | 327 | 163 |
| 8–10 Weeks of age | 195 | 79 | 1119 | 584 |
See the footnote to Table 33 for an explanation of the use of benchmark dose in this report. A power model was used; n = 8 offspring per dose group. The variance was assumed to be SEM, as reported in other parts of the paper.
From Fritz et al. (2002b).
The effects on prostate androgen and ER are shown in Table 46. ERβ protein was not measured because a suitable antibody was not available. The authors concluded that ERα was the most sensitive of these receptors because mRNA was suppressed at a dietary exposure level of 25 ppm. The authors further concluded that the 2-week adult exposure had an effect on receptors similar to that of lifetime exposure, suggesting that if genistein consumption in soy foods protects against prostate cancer, it might do so with adoption of a high-soy diet in adulthood, rather than requiring lifetime adoption of such a diet.
Table 46.
Androgen Receptor in Rats on PND 70 after Genistein Exposure
| % Control Value
|
||
|---|---|---|
| Genistein treatment | mRNA for receptor | Receptor protein |
| Androgen receptor | ||
| Diet of pregnant and lactating dam+offspring to PND 70 | ||
| 25 ppm | 70 | Not reported |
| 250 ppm | 15* | Not reported |
| Diet PND 57–65, gavage PND 66–70 | ||
| 250 ppm-equivalent | 70* | 68 |
| 1000 ppm-equivalent | 66* | 64 |
| ERα | ||
| Diet of pregnant and lactating dam+offspring to PND 70 | ||
| 25 ppm | 60* | Not reported |
| 250 ppm | 52* | Not reported |
| Diet PND 57–65, gavage PND 66–70 (ppm-equivalent) | ||
| 250 ppm-equivalent | 56* | 92 |
| 1000 ppm-equivalent | 49* | 45* |
| ERβ | ||
| Diet of pregnant and lactating dam+offspring to PND 70 | ||
| 25 ppm | 70 | Not reported |
| 250 ppm | 40* | Not reported |
| Diet PND 57–65, gavage PND 66–70 (ppm-equivalent) | ||
| 250 ppm-equivalent | 54* | Not reported |
| 1000 ppm-equivalent | 60* | Not reported |
Percent reductions were estimated from graphs and, if possible, confirmed by the text; n = 8 animals per treatment; litter of origin not specified for animals exposed during gestation and lactation.
P < 0.05 compared to control value by ANOVA with post-hoc Tukey test.
From Fritz et al. (2002b).
Strengths/Weaknesses
Strengths of the study include use of phytoestrogen-free chow and standardization of litter size on PND 1. A weakness is that the numbers of dams/treatment group were not presented (at least eight according to text). Only two dose levels of genistein were used (25 and 250 mg/kg feed). It was not clear if the litter was used as the experimental unit for lifetime exposure groups. No data were presented on effects of genistein during pregnancy (gestation length, weight gain). Feed consumption was apparently determined during 10 days of adult exposure, but no data were presented. Because feed consumption was not reported, genistein exposures are unknown; however, serum genistein levels were determined at PND 70. Only male offspring were examined. It was not clear how 16 male rats were selected to be followed until PND 70 and it is also unknown if the same 16 rats were followed.
Utility (Adequacy) for CERHR Evaluation Process
This study is of limited utility in determining developmental effects due to lack of experimental details and limited usefulness of several of endpoints presented. The data may be useful in corroborating results from other studies.
Thuillier et al. (2003), supported by NIEHS, examined the effects of prenatal genistein exposure on testicular platelet-derived growth factor (PDGF) α- and β-receptors. According to the study authors, there is some evidence indicating that the PDGF pathway is involved in testicular development. Pregnant Sprague-Dawley rats were gavaged with corn oil in DMSO as the vehicle control or genistein [purity not specified] 0.1, 1, or 10 mg/kg bw/day on GD 14 (14 days post coitus) to PND 0 (birth). Male offspring were killed on GD 21 or PND 3, and testes were collected and fixed in formaldehyde or liquid nitrogen. Expression of PDGFα and β-receptor RNA was measured using RT-PCR, and in situ and immunohistochemistry analyses were conducted to localize expression of RNA and proteins. Immunohistochemistry techniques were also used to measure expression of tyrosine-phosphorylated proteins. Data were analyzed by unpaired t-test with Welch correction.
Genistein significantly increased expression of PDGFα-and PDGFβ-receptor mRNA in testes of PND three rats at all doses [~4–5-fold increase for α-receptor and 3–3.5-fold increase for β-receptor compared to controls]. Diethylstilbestrol produced biphasic effects with increased expression at lower doses and decreased expression at higher doses. In situ analyses revealed that PDGF α- and PDGFβ-receptor mRNA were primarily localized in the interstitium of control PND 3 rats. Treatment with genistein 10 mg/kg bw/day increased expression of PDGF α-receptor [~2.5-fold] in interstitium and PDGFβ-receptor mRNA in interstitium [~7.5-fold increase] and in central and peripheral seminiferous cords [~3–6 fold increase]. In situ analysis of protein expression revealed that PDGF α-receptor was localized in peritubular myoid cells of PND 3 rats; treatment with genistein 10 mg/kg bw/day increased expression of PDGFα-receptor in Sertoli cells but not gonocytes. PDGFβ-receptor protein was expressed at low levels in gonocytes and interstitial cells, but treatment with genistein 10 mg/kg bw/day induced strong expression in gonocytes. An examination of testes from PND 21 fetuses revealed that PDGFα-receptor protein was expressed in gonocytes and Sertoli cells, and no changes in expression were reported following treatment with genistein 10 mg/kg bw/day. PDGFβ-receptor was expressed in gonocytes of PND 21 fetuses, and expression was apparently strengthened by genistein treatment. Either no change or slight reductions in expression of tyrosine-phosphorylated protein in fetal Sertoli cells was noted following genistein exposure. Similar effects on PDGFα- and β-receptors were noted with other estrogenic compounds such as bisphenol A and coumestrol. The study authors concluded that the PDGF pathway is a target of estrogens; however, it was not known if the effects seen in this study were due to estrogenic activity.
Strengths/Weaknesses
Strengths of the study include administration of genistein by gavage, which allows the exact dose to be known, and the use of three dose levels. Weaknesses were that numbers of animals/group treated and examined were not specified and it was unclear if data were analyzed on a per litter basis.
Utility (Adequacy) for CERHR Evaluation Process
Endpoints examined are of limited utility in determining developmental effects; however, data may be useful in interpreting results from other studies.
Wisniewski et al. (2003), supported by NIH, evaluated male Long-Evans rats after prenatal and lactational exposure to genistein in the diet of the dam. Adult female rats were fed a soy- and alfalfa-free diet supplemented with genistein [purity not specified] at 0, 5, or 300 mg/kg feed (n = 4/dose group). After 2 weeks on the assigned feed, the females were bred and maintained on their assigned diets through pregnancy and lactation. Feed consumption during the pregnancy and lactation periods was comparable among groups. Estimated genistein intake during pregnancy and lactation was negligible in the basal diet group. In the group given genistein 5 mg/kg feed in the diet, the estimated mean genistein intakes of the dams were 100–200 mg/kg bw/day during pregnancy and 200–500 mg/kg bw/day during lactation. In the group given genistein at 300 mg/kg feed, estimated mean genistein intakes were 6400–9100 mg/kg bw/day during pregnancy and 12,700–23,600 mg/kg bw/day during lactation. [Based on feed intake rates reported by the study authors and genistein intake rates reported in another study with similar dosing (You et al., 2002a), it appears that the authors made an error in reporting units and that intake rates should be 2 orders of magnitude lower (e.g., 1–2 mg/kg bw/day during pregnancy and 2–5 mg/kg bw/day during lactation at 5 mg/kg feed; 64–91 mg/kg bw/day during pregnancy and 127–236 mg/kg bw/day during lactation at 300 mg/kg feed).]
Litter size, pup weight, and sex ratio were assessed on PND 2. Maternal behavior was assessed by removal of all pups and placement of a random four pups (two of each sex) at the end of the cage opposite the nest. Time to retrieval of the first and last pup was recorded. Pup anogenital distance was recorded once/week beginning on PND 2. Pups were weaned on PND 21 and males housed together by litter. Males were assessed on PND 40–45 for penile length, testis diameter, and balanopreputial separation. On PND 70, penile length was again measured and males were placed with hormonally primed ovariectomized females for evaluation of sexual function. After testing of sexual function, males were killed and reproductive organs weighed. Testicular sperm count was assessed in homogenized paired testes. Plasma from retro-orbital sinus blood was evaluated for testosterone. Results, analyzed by ANOVA, are summarized in Table 47. [There was no post-hoc test indicated, and there was no indication of litter analysis for male parameters.] Benchmark dose calculations for reproductive organ weights and plasma testosterone levels are listed in Table 48. The mating trials showed a greater effect of the low-dose genistein exposure with only 4/12 males mounting and intromitting compared to 9/12 animals in the control and high-dose genistein groups. There were no animals ejaculating in either of the genistein groups compared to 4/12 males in the control group. No effect of genistein on sperm count was detected. The authors concluded that low-dose genistein had a greater effect on subsequent male reproductive function than high-dose exposure and wrote, “Because exposure to the low dose of genistein was sufficient to exert permanent alterations in masculinization, the impact of dietary phytoestrogen exposure on human reproductive development should be investigated.”
Table 47.
Effects on Pregnancy Outcome and Male Offspring of Feeding Genistein to Rat Dams During Pregnancy and Lactation
| Genistein added to diet, mg/kg feed [ppm] |
||
|---|---|---|
| Parameter | 5 | 300 |
| Maternal/litter characteristics | ||
| Gestation length | ↔ | ↔ |
| Litter size | ↔ | ↔ |
| Sex ratio | ↔ | ↔ |
| Mean pup weight | ↔ | ↔ |
| Latency to retrieve pups | ↔ | ↔ |
| Male offspring characteristics | ↔ | ↔ |
| Anogenital distance | ||
| PND 2 | ↔ | ↔ |
| PND 7 | ↔ | ↔ |
| PND 14 | ↔ | ↔ |
| PND 21 | ↔ | [↓13%]a |
| Body weight | ||
| PND 21 | ↔ | ↔ |
| PND 40–45 | ↔ | ↓17% |
| PND 70 | Not reported | not reported |
| Testis length, PND 40 | [↓10%]a | [↓11%]a |
| Testis width, PND 40 | [↓11%]a | [↓11%]a |
| Preputial separation by PND 40–45 | [↓77%]a | [↓77%]a |
| Penis length, PND 70 | ↔ | ↔ |
| Prostate weight, PND 70 | ↔ (↑ 41%?)b | ↑ 19%b |
| Testis weight, PND 70 | ↔ | ↔ |
| Seminal vesicle weight, PND 70 | ↔ | ↔ |
| Epididymides weight, PND 70 | ↔ | ↓11% |
| Epididymal fat weight, PND 70 | ↔ | ↔ |
| Plasma testosterone, PND 70 | ↓53% | ↓40% |
| Latency to mount | ↔ | ↔ |
| Latency to intromission | ↔ | ↔ |
| Mean number of mounts | ↔ | ↔ |
| Mean number of intromissions | ↔ | ↔ |
| Proportion mounting | ↓60% | ↔ |
| Proportion intromitting | ↓60% | ↔ |
| Proportion ejaculating | ↓100% | ↓100% |
Estimated from a graph in the published paper.
[The authors’ table appears to be in error in indicating a lack of significant difference in the prostate weight of animals born to dams given genistein 5 mg/kg feed. The numerical mean prostate weight (0.52 g) was higher in this group than in the 300 mg/kg group (0.44) and the SEM (0.04) and sample size (n = 12) were the same in these two groups. ANOVA with post-hoc Dunnett test performed by CERHR showed the prostate weight in the 5 mg/kg group but not the 300 mg/kg group to be significantly higher than the control (0.37 ± 0.04 g).]
From Wisniewski et al. (2003).
Table 48.
Benchmark Dose Calculations for Adult Reproductive Measures Following Gestational and Lactational Exposure of Rats to Genistein
| Benchmark dosea (mg/kg diet [ppm])
|
||||
|---|---|---|---|---|
| Parameter | BMD10 | BMDL | BMD1 SD | BMDL1 SD |
| Prostate weight | 481 | 139 | 563 | 286 |
| Epididymides weight | 296 | 149 | 291 | 104 |
| Plasma testosterone | 153 | 53.4 | 612 | 197 |
See the footnote to Table 33 for an explanation of the use of benchmark dose in this report. A power model was used; n = 4 litters per dose group.
From Wisniewski et al. (2003).
Strengths/Weaknesses
Strengths of the study included use of a soy- and alfalfa-free diet, determination of feed consumption and genistein intake, and testing for mating capability of treated rats. Weaknesses included use of only two genistein dose levels (5 and 300 mg/kg bw), unknown source and purity of genistein, and the small number of animals (4/group). In addition, it was not clear if the litter was used as the experimental unit for statistical analyses.
Utility (Adequacy) for CERHR Evaluation Process
Due to the small numbers of animals used, this study is not useful for the CERHR evaluation process.
Naciff et al. (2002), from the Procter and Gamble Company, examined the effects of prenatal genistein exposure on gene expression in rat female reproductive organs. Pregnant Sprague-Dawley rats were fed Purina 5K96, a casein-based soy- and alfalfa-free diet. The rats were randomly assigned to groups (≥7 rats/group) that were s.c. injected with genistein (~99% purity) 0 (DMSO vehicle), 0.1, 10, or 100 mg/kg bw/day on GD 11–20 (day of sperm detection = GD 0). Dams were killed on GD 20 and ovaries and uteri were removed from fetuses. In four litters/dose group, one female fetus/litter was examined for ovarian and uterine histopathology. In five litters/group, ovaries and uteri from ≥5 littermates were pooled for a microarray analysis of gene expression. Changes in gene expression were further quantified using RT-PCR. Data were analyzed by t-test, ANOVA, and Jonckheere-Terpstra test. Comparisons of gene expression among estrogenic compounds were made by Wilcoxon-Mann-Whitney and Jonckheere-Terpstra tests.
Genistein treatment had no effect on maternal body weight or number of live fetuses/litter, and no gross or histopathologic effects on ovary or uterus. In pooled ovary and uterus samples, expression of 227 genes was significantly altered by genistein, and the genes with the most robust response, as indicated by study authors, are listed in Table 49. When genistein data were pooled with data obtained from ethinyl estradiol and bisphenol A and globally analyzed, there were 66 genes that were significantly altered in the same direction by all three compounds; significant changes in gene expression induced by the three compounds are also listed in Table 49. The study authors concluded that gene expression in rat ovary and uterus is altered by prenatal exposure to estrogenic compounds.
Table 49.
Gene Expression Changes in Pooled Ovary and Uterus Sample in Rats Prenatally Exposed to Genistein
| Average-fold change at each genistein dose (mg/kg bw/day)
|
|||
|---|---|---|---|
| Parameter | 0.1 | 10 | 100 |
| Rat progesterone receptor gene, complete cdsb | 1.0 | 2.9 | 5.7 |
| Rat intestinal calcium-binding protein (icabp) gene 2, 3, end and flankb | 1.1 | 1.2 | 4.7 |
| Rattus norvegicus serine threonine kinase (pim-3) mRNA, complete cdsa | 1.3 | 2.4 | 3.6 |
| Rattus norvegicus 11-beta-hydroxysteroid dehydrogenase type 2 mRNAb | 1.1 | 1.6 | 3.4 |
| Rat mixed-tissue library Rattus norvegicus cDNA clone rex02348 3a | 1.5 | 1.5 | 3.0 |
| EST196997 Rattus norvegicus cDNA, 3 enda | 1.1 | 1.2 | 2.7 |
| EST 197092 Rattus norvegicus cDNA, 3 enda | 1.3 | 1.5 | 2.7 |
| Rat mixed-tissue library Rattus norvegicus cDNA clone rx02392 3a | 1.5 | 1.5 | 3.0 |
| Rattus norvegicus, GPCR-5-1 genea | 1.1 | 1.8 | 2.6 |
| Rattus norvegicus mRNA for collagen alpha 1 Type II, partial cdsa | 1.5 | 2.0 | 2.6 |
| Rattus norvegicus staniocalcin (rSTC) mRNA, complete cdsa | 1.4 | 1.8 | 2.5 |
| EST195752 Rattus norvegicus cDNA, 3 endb | 1.3 | 1.7 | 2.4 |
| UI-R-A0-bm-c-11-0-UI.sl Rattus novegicus cDNAa | 1.4 | 1.3 | 2.4 |
| Rat mixed-tissue library Rattus norvegicus cDNA clone rx01272 3a | 1.1 | 1.2 | 2.3 |
| Rattus norvegicus mRNA for dermo-1-proteinb | 1.1 | 1.4 | 2.1 |
| EST188966 Rattus norvegicus cDNA, 3 enda | 1.2 | 1.4 | 2.1 |
| EST191592 Rattus norvegicus cDNA, 3 enda | 1.0 | 1.3 | 2.1 |
| EST196062 Rattus norvegicus cDNA, 3 enda | 1.3 | 1.4 | 2.1 |
| Rattus norvegicus mRNA for interleukin 4 receptorb | 1.2 | 1.8 | 1.9 |
| Rat tartrate-resistant acid phosphatase type 5 mRNA, complete cdsa | −1.1 | −1.6 | −2.2 |
| EST195631 Rattus norvegicus cDNA enda | −1.3 | −1.5 | −2.2 |
| Rattus rattus guanine nucleotide-releasing protein (mss4) mRNA, complete cdsa | −1.1 | −1.3 | −2.3 |
| EST229949 Rattus norvegicus cDNA, 3 enda | −1.3 | −1.8 | −2.4 |
| Rattus sp. (clone PbURF) galectin-5 mRNA, complete cdsa | −1.3 | −1.1 | −2.5 |
| Rat retinol-binding protein (RBP) partial cdsb | −1.4 | −2.0 | −2.6 |
| Rat mRNA for glycine methyltransferase (EC 2.1.1.20)a | −1.0 | −1.2 | −2.6 |
| Rat mRNA for protocadherin 5, partial cdsa | −1.1 | −1.2 | −2.7 |
| Rattus norvericus neural cell adhesion molecule BIG-1 protein (BIG-1) mRNAa | −1.2 | −1.3 | −2.7 |
| UI-R-E0-ct-c-11-0-UI.s1 Rattus norvegicus cDNA, 3 enda | −1.1 | −2.0 | −2.7 |
| UI-R-E0-bs-f-12-0-UI.s1 Rattus norvegicus cDNA, 3 enda | −1.0 | −1.2 | −2.8 |
| Rattus norvegicus mast cell carboxypeptidase A precursor (R-CPA) mRNA, partial cdsa | −1.1 | −1.9 | −2.9 |
| Rat mRNA for chromosomal protein HMG2, complete cdsa | −1.1 | −1.4 | −3.1 |
| Rattus norvegicus (clone REM2) ORF mRNA, partial cdsa | −2.3 | −2.2 | −4.6 |
| EST200668 Rattus norvegicus cDNA, 3 end (gene symbol Ttr)a,d | −2.9 | −5.8 | −5.2 |
| EST200668 Rattus norvegicus cDNA, 3 end (gene symbol Ahsg)a,d | −2.2 | −5.4 | −5.5 |
| Rattus norvegicus mRNA for 59-kDa bone sialic acid-containing protein, complete cdsa | −3.1 | −5.7 | −5.7 |
| Rattus norvegicus mRNA for fetuina | −1.7 | −7.4 | −6.1 |
| Rat mRNA for serine proteinase inhibitor-like protein, partiala | −1.9 | −3.5 | −6.6 |
| Rattus norvegicus uterus-ovary specific putative transmembrane protein (uo) mRNAc | 1.4 | ||
| Rat mRNA for vascular alpha-actinc | 1.2 | ||
| EST191592 Rattus norvegicus cDNA, 3 end. High homology to Rattus norvegicus putative G-protein coupled receptor GPCR91c | 2.1 | ||
| Rattus norvegicus (clone 59) FSH-regulated protein mRNAc | 1.5 | ||
| Rat aspartate aminotransferase mRNA, complete cdsc | 1.8 | ||
| Rat phosphofructokinase C (PFK-C) mRNA, complete cdsc | 1.3 | ||
| Rat very low density lipoprotein receptor (VLDLR) mRNA, complete cdsc | 1.7 | ||
| Rattus rattus mRNA for glutathione-dependent dehydroascorbate reductase, complete cdsc | 1.2 | ||
| Rat neural receptor protein-tyrosine kinase (trkB) mRNA, complete cdsc | 1.4 | ||
| Rattus rattus RYD5 mRNA for a potential ligand-binding proteinc | 1.4 | ||
| Rat mRNA for growth potentiating factor, complete cdsc | 1.6 | ||
| Rat mRNA for Na+, K+ATPase beta-3 subunit, complete cdsc | 1.5 | ||
| UI-R-EO-bv-d-01-0-UI.sl Rattus norvegicus cDNA, 3 endc | 1.5 | ||
| Rattus sp. mRNA for NTAK alpha2-1p, partial cdsc | 1.6 | ||
| Rat creatine kinase-B (CKB) mRNA, 3 endc | 1.6 | ||
| EST189057 Rattus norvegicus cDNA, 3 endc | 1.4 | ||
| EST198107 Rattus norvegicus cDNA, 3 endc | 1.2 | ||
| Rat brain glucose-transporter protein mRNA, complete cdsc | 1.5 | ||
| Rattus vorvegicus mRNA for growth hormone receptor, 3 UTRc | 2.2 | ||
| Rat insulin-like growth factor I (IGF-I) mRNA, complete cdsc | 1.3 | ||
| UI-R-E0-cb-a-03-0-UI.sl Rattus norvegicus cDNA, 3 endc | 1.8 | ||
| EST188918 Rattus norvegicus cDNA, 3 end. High homology to rat protein kinase C epsilon subspeciesc | 2.0 | ||
| Rat mRNA for non-neuronal enolase (NNE) (α-α enolase, 2-phospho-D-glycerate hydrolase EC 4.2.1.11)c | 1.3 | ||
| EST196141 Rattus norvegicus cDNA, 3 endc | 1.4 | ||
| Rattus norvegicus C-CAM4 mRNA, complete cdsc | 1.4 | ||
| EST196700 Rattus norvegicus cDNA, 3 endc | 1.6 | ||
| Rat DNA for prion proteinc | 1.4 | ||
| Rattus norvegicus GADD45 mRNA, complete cdsc | 2.2 | ||
| EST190190 Rattus norvegicus cDNA, 3 endc | 1.5 | ||
| Rattus norvegicus serum and glucocorticoid-regulated kinase (sgk) mRNA, complete cdsc | 1.4 | ||
| Rattus norvegicus nerve growth factor induced factor A mRNA, partial 3 UTRc | 1.5 | ||
| UI-R-AO-as-e-04-0-UI.sl Rattus norvegicus cDNA, 3 endc | 1.3 | ||
| Rat X-chromosome linked phosphoglycerate kinase mRNA, complete cdsc | 1.2 | ||
| UI-R-E0-bx-c-12-0-UI.sl Rattus norvegicus cDNA, 3 endc | 1.4 | ||
| EST213688 Rattus norvegicus cDNA, 3 endc | 1.2 | ||
| Rat protein-tyrosine-phosphatase (PTPase) mRNA, complete cdsc | 1.5 | ||
| Rattus norvegicus developmentally-regulated cardiac factor (DRCF-5) mRNA, 3 endc | 1.4 | ||
| Rattus norvegicus prostacyclin synthase (ratgis) mRNA, complete cdsc | 1.2 | ||
| Rat lactate dehydrogenase A mRNA, endc | 1.2 | ||
| Rattus norvegicus mRNA for protein kinase C delta-binding protein, complete cdsc | 1.2 | ||
| Rat glutathione S-transferase mRNA, complete cdsc | −1.2 | ||
| Rattus norvegicus potassium channel regulatory protein KChAP mRNA, complete cdsc | −1.2 | ||
| Rat DNA polymerase alpha mRNA, 3 endc | −1.2 | ||
| Rattus norvegicus Ssecks 322 mRNA, 3 untranslated region, partial sequencec | −1.2 | ||
| Rattus norvegicus Drosophila polarity gene (frizzled) homologue mRNA, complete cdsc | −1.2 | ||
| Rattus norvegicus proto-oncogene tyrosine kinase receptor Ret (c-ret) mRNA, partial cdsc | 2.9 | ||
| EST220459 Rattus norvegicus cDNA, 3 endc | −1.4 | ||
| EST196721 Rattus norvegicus cDNA, 3 endc | −1.4 | ||
| EST195725 Rattus norvegicus cDNA, 3 endc | −1.4 | ||
| Rattus norvegicus carboxypeptidase E (CPE) genec | −1.3 | ||
| Rat mRNA for Distal-less 3 (Dlx-3) homeobox proteinc | −1.3 | ||
| Rattus norvegicus mRNA for precursor interleukin 18 (IL-18), complete cdsc | −1.3 | ||
| EST195719 Rattus norvegicus cDNA, 3 endc | −1.2 | ||
| UI-R-EO-cc-c-09-0-UI.sl Rattus norvegicus cDNA, 3 endc | −1.2 | ||
| EST197895 Rattus norvegicus cDNA, 3 endc | −1.8 | ||
| Rattus norvegicus glutathione s-transferase M5 mRNA, complete cdsc | −1.2 | ||
| Rat mRNA for phosphodiesterase Ic | −1.3 | ||
| Rat mRNA for apolipoproteinc | −1.3 | ||
| Rattus norvegicus C kinase substrate calmodulin-binding protein (RC3) mRNA, complete cdsc | −1.4 | ||
Statistical significance (P < 0.001) was obtained in independent analyses of genistein.
Statistical significance was obtained following independent analyses of genistein (P < 0.001) and in analyses to determine gene expression changes occurring in same direction in pooled data from genistein, ethinyl estradiol, and bisphenol A (P < 0.0001).
Statistical significance was obtained in analyses to determine gene expression changes occurring in the same direction in pooled data from genistein, ethinyl estradiol, and bisphenol A (P < 0.0001).
It appears that the gene name for one of these compounds was mistakenly listed.
From Naciff et al. (2002).
Strengths/Weaknesses
Strengths include the well defined exposure time during gestation, the use of an adequate number of litters, the range of doses tested, the use of soy- and alfalfa-free diet, the comparison with ethinyl estradiol and bisphenol A, and the evaluation of histology. The confirmation of some of the array data with quantitative PCR is an additional strength. Weaknesses include the evaluation of gene expression only at the end of exposure and not at later postnatal developmental ages.
Utility (Adequacy) for CERHR Evaluation Process
This study analyzes the gene profile of estrogen-responsive reproductive tissues in female fetuses after gestational exposure to three different estrogenic compounds in an attempt to provide mechanistic clues regarding the effects of the compounds. Although not directly useful in the current evaluation, the study could be useful in pinpointing gestational target genes that may eventually be linked to developmental defects in reproductive tissues and also unveils some common target genes between the three estrogenic compounds, which may be useful as sentinel genes in the evaluation of estrogen exposure.
Naciff et al. (2005), from the Procter and Gamble Company, examined the effect of prenatal genistein exposure on male reproductive organ histology and gene expression. Pregnant Sprague-Dawley rats were fed Purina 5K96, a casein-based soy- and alfalfa-free diet. The rats were randomly assigned to groups (≥8 rats/group) that were s.c. injected with genistein [purity not reported] 0 (DMSO vehicle), 0.001, 0.01, 0.1, 10, or 100 mg/kg bw/day on GD 11–20 (day of sperm detection = GD 0). Dams were killed on GD 20 and testes and epididymides were removed from fetuses. In four litters/dose group, one male fetus/litter was examined for testicular histopathology. In five litters/group, testis and epididymis from five littermates were pooled for a microarray analysis of gene expression. Changes in gene expression were further quantitated using RT-PCR. Data were analyzed by t-test, ANOVA, and Jonckheere-Terpstra test. Comparisons of gene expression among estrogenic compounds were analyzed by Wilcoxon-Mann-Whitney and Jonckheere-Terpstra tests.
Genistein treatment had no effect on maternal body weight or number of live fetuses/litter, and no gross or histopathologic effects on testis or epididymis. In pooled testis and epididymis samples from the high-dose genistein group, expression of 23 genes was significantly altered in a dose-related manner, and those genes are listed in Table 50. When genistein data were pooled with data obtained from ethinyl estradiol and bisphenol A and globally analyzed, there were 50 genes that were significantly altered in the same direction by all three compounds; significant changes in gene expression induced by the three compounds are also listed in Table 50. The study authors concluded that transplacental exposure to high doses of genistein alters the expression of certain genes in the testis and epididymis of fetal rats without causing malformations in those organs. The study authors noted that the dose response to genistein was monotonic with no evidence of robust quantifiable responses at low doses.
Table 50.
Gene Expression Changes in Pooled Testis and Epididymis Following Prenatal Exposure to Genistein
| Average-fold change at each genistein dose (mg/kg bw/day)
|
|||||
|---|---|---|---|---|---|
| Gene | 0.001 | 0.1 | 1.0 | 10.0 | 100 |
| Hydroxyacid oxidase 3 (medium chain)b | −1.1 | 1.1 | 1.1 | 1.8 | 3.5 |
| Progesterone receptorb | 1.2 | 1.4 | 1.1 | 2.1 | 2.9 |
| Progesterone receptor steroid-binding domainb | 1.1 | −1.1 | 1.0 | 1.5 | 2.1 |
| ESTs (accession no. AA858607)b | 1.2 | 1.2 | 1.3 | 2.1 | 1.7 |
| MCT1 monocarboxylate transporterb | 1.0 | 1.1 | 1.2 | 1.6 | 1.7 |
| Sulfonylurea receptor 2b | 1.0 | 1.1 | 1.1 | 1.2 | 1.7 |
| Small proline-rich protein genea | −1.0 | 1.1 | 1.3 | 1.2 | 1.6 |
| Solute carrier 16 (monocarboxylic acid transporter)a | 1.0 | 1.1 | 1.1 | 1.4 | 1.5 |
| Gap junction protein, alpha 1, 43 KD (connexin 43)a | −1.1 | −1.1 | 1.1 | 1.4 | 1.5 |
| ESTs, Weakly similar to T43458 hypothetical protein DKFZp434F0621.1a | 1.1 | −1.0 | −1.0 | 1.3 | 1.5 |
| Mitochondrial 3-hydroxy-3-methylglutaryl-CoA synthaseb | −1.1 | 1.0 | 1.0 | 1.1 | 1.5 |
| ESTs (accession no. AA866383)a | 1.1 | 1.1 | 1.1 | 1.3 | 1.4 |
| ESTs (accession no. AA893596)a | 1.0 | −1.1 | −1.0 | 1.2 | 1.4 |
| ESTs, similar to potassium channel, subfamily K, member 5 (Mus musculus)b | −1.2 | −1.1 | −1.1 | 1.1 | 1.4 |
| 3-hydroxy-3-methylglutaryl-Coenzyme A synthase 2a | −1.0 | 1.0 | −1.0 | 1.1 | 1.4 |
| Solute carrier family 18 (vesicular monoamine), membera | −1.1 | 1.0 | −1.0 | 1.1 | 1.4 |
| Zinc finger protein 354Aa | −1.0 | 1.0 | −1.0 | −1.3 | −1.4 |
| Luteinizing hormone/choriogonadotropin receptora | 1.0 | 1.1 | 1.1 | −1.1 | −1.5 |
| Phospholipase A2, group IBa | −1.1 | −1.1 | −1.2 | −1.3 | −1.6 |
| Carboxypeptidase A1b | 1.1 | 1.1 | 1.1 | −1.1 | −1.6 |
| Natriuretic peptide precursor Cb | 1.1 | −1.0 | 1.1 | −1.8 | −1.9 |
| Cytochrome P450, subfamily XVIIb | 1.1 | −1.0 | 1.1 | −1.2 | −2.5 |
| Steroidogenic acute regulatory proteinb | 1.1 | 1.1 | 1.0 | −1.3 | −3.0 |
| Intestinal calcium-binding protein, calbindin 3c | 1.1 | 1.0 | 4.3 | ||
| Endothelial differentiation, lysophosphatidic acid G-protein-coupledc | 1.1 | 1.0 | 1.2 | ||
| Guanylate kinase associated proteinc | 1.1 | 1.2 | 1.7 | ||
| Very low density lipoprotein receptorc | 1.1 | 1.0 | 1.2 | ||
| Vascular endothelial growth factorc | 1.1 | 1.0 | 1.2 | ||
| Interleukin-4 receptorc | 1.1 | 1.3 | 1.3 | ||
| Rhesus blood group-associated A glycoproteinc | 1.0 | 1.0 | 1.3 | ||
| 3-hydroxy-3-methylglutaryl CoA synthasec | −1.0 | 1.1 | 1.4 | ||
| EGL nine homolog 3 (C. elegans)c | 1.2 | 1.2 | 1.3 | ||
| Silencer factor Bc | 1.1 | 1.5 | 1.3 | ||
| ATP-binding cassette, sub-family C (CFTR/MRP), memberc | −1.1 | −1.1 | 1.4 | ||
| ESTs, high homology to fos-like antigen 2c | −1.1 | 1.1 | 1.2 | ||
| MO monocarboxylic acid transporter, member 1c | 1.2 | 1.6 | 1.7 | ||
| ESTs, high homology to N-myc downstream-regulated gene 2c | −1.0 | 1.1 | 1.3 | ||
| Lectin, galactose binding, soluble 9 (Galectin-9)c | 1.1 | 1.1 | 1.3 | ||
| N-mycc | −1.1 | −1.0 | 1.3 | ||
| ESTs, high homology to solute carrier organic anion transporter family, member 2a1c | 1.1 | 1.1 | 1.3 | ||
| CD36 antigen (collagen type I receptor, thrombospondinc | 1.3 | 1.2 | 1.6 | ||
| ESTs, high homology to phosphatidic acid phosphatase type 2cc | 1.0 | 1.1 | 1.4 | ||
| EGL nine homolog 3 (C. elegans)c | 1.1 | 1.0 | 1.2 | ||
| Similar to carboxypeptidase-like protein ACLPc | −1.0 | 1.1 | 1.2 | ||
| ATPase, Na+K+ transporting, beta polypeptide 3c | −1.0 | 1.0 | 1.1 | ||
| ESTs (accession no. AA894233)c | −1.1 | −1.2 | −1.3 | ||
| Fatty acid Coenzyme A ligase, long chain 3c | −1.1 | −1.1 | −1.1 | ||
| Isocitrate dehydrogenase 1, solublec | 1.0 | −1.1 | −1.1 | ||
| Fatty acid-Coenzyme A ligase, long chain 4c | 1.0 | 1.0 | −1.2 | ||
| RANP-1, sterol-C4-methyl oxidase-likec | −1.0 | −1.1 | −1.3 | ||
| 3-hydroxy-3-methylglutaryl-Coenzyme A synthase 1c | −1.0 | −1.1 | −1.2 | ||
| 7-dehydrocholesterol reductasec | 1.2 | −1.0 | −1.1 | ||
Statistical significance (P≤0.001) was obtained at the highest dose in independent analyses of genistein.
Statistical significance was obtained following independent analyses (P≤0.001) of genistein and in analyses to determine gene expression changes occurring in same direction in pooled data from genistein, ethinyl estradiol, and bisphenol A (P≤0.001) [text states P≤0.0001].
Statistical significance was obtained in analyses to determine gene expression changes occurring in the same direction in pooled data from genistein, ethinyl estradiol, and bisphenol A (P≤0.001) [text states P≤0.0001].
Strengths/Weaknesses
This study is similar to the previous study by Naciff et al. (2002) and has similar strengths and weaknesses.
Utility (Adequacy) for CERHR Evaluation Process
This study has utility in the exploration of possible mechanisms of action, as discussed above for Naciff et al. (2002).
3.2.1.5. Rats treated only postnatally
The following studies with oral or s.c. exposures beginning during postnatal development were conducted in rats. Oral exposure studies are presented before s.c. studies.
Nagao et al. (2001), supported by the Japanese Ministry of Health and Welfare, mated Sprague-Dawley rats and permitted dams to deliver naturally. On the day of birth (PND 0), pups were sexed and weighed and litters were randomly culled to four males and four females where possible. Litters of 8 pups or fewer were not reduced. Pups were gavaged with genistein [purity not specified] at 0, 12.5, 25, 50, or 100 mg/kg bw/day on PND 1–5. A positive control group, used only for terminal histology evaluations, was given ethinyl estradiol 2 mg/kg bw/day by gavage on the same days. Pups were reared by their own dams and weaned on PND 21.
There were 31 males from seven litters in the control group, 25 males from five litters in the 12.5 mg/kg genistein group, 25 males from five litters in the 25 mg/kg genistein group, 28 males from five litters in the 50 mg/kg genistein group, 23 males from six litters in the 100 mg/kg genistein group, and 10 males from five litters in the ethinyl estradiol group. On PND 21, five randomly selected males from the control and genistein-treated groups were killed and necropsied. Testes were fixed in Bouin fluid, stained with hematoxylin and eosin, and examined with light microscopy. In the surviving males, timing of preputial separation was assessed beginning on PND 35 and males were cohabited with untreated females at 12 weeks of age. Cohabitation was permitted on a 1:1 basis for up to 2 weeks or until sperm were found in the vaginal smear. Males that did not produce evidence of copulation were re-mated with a different untreated female for up to an additional 2 weeks. Copulated females were killed on Day 12 of presumed gestation and uterine contents inspected. Partners of non-pregnant copulated females were mated for up to 2 weeks with one additional female. At least 2 weeks after copulation [or at 18 weeks of age; the paper describes terminal sacrifice using both designations], males were killed and blood collected for measurement of serum testosterone. Reproductive organs were weighed. Thawed cauda epididymis was homogenized in water [freezing of the cauda is not described], and sperm concentration determined using an automated system. Reproductive organs were histologically examined by observers who were blind to treatment status. Statistical analysis of offspring data used ANOVA with post-hoc t-test for parametric variables and χ2 or Kruskal-Wallis with post-hoc Fisher or Mann-Whitney U-test for nonparametric variables. Litter of origin was considered in the statistical analyses.
There were 29 females from seven litters in the control group, 25 females from five litters in the 12.5 mg/kg bw/day genistein group, 21 females from five litters in the 25 mg/kg bw/day genistein group, 21 females from 5 litters in the 50 mg/kg bw/day genistein group, 25 females from six litters in the 100 mg/kg bw/day genistein group, and 10 females from five litters in the ethinyl estradiol group. On PND 21, five females from each litter were killed and necropsied. Uteri and ovaries were fixed in 0.1 M phosphate-buffered 10% formalin, stained with hematoxylin and eosin, and evaluated by light microscopy. Surviving females were followed beginning on PND 28 for vaginal opening. At 7 weeks of age, females underwent daily vaginal lavage for monitoring of estrous cyclicity. At 12 weeks of age, females were cohabited 1:1 with untreated males for up to 2 weeks. Copulation was assessed by sperm in the vaginal lavage. Females not copulating within 2 weeks were mated with new untreated males for up to an additional 2 weeks. Copulated females were killed on Day 12 of presumed gestation and uterine contents evaluated. Females that had not copulated were killed at 18 weeks of age for histologic evaluation of the uteri and ovaries. [The text also says that non-pregnant females were killed at 18 weeks of age, and a data table shows 20 non-pregnant females killed at 18 weeks; however, copulated females should have been killed on Day 12 after copulation.] Statistical analysis of offspring data used ANOVA with post-hoc t-test for parametric variables and χ2 or Kruskal-Wallis with post-hoc Fisher or Mann-Whitney U-test for nonparametric variables. Litter of origin was considered in the statistical analyses.
There were no clinical signs in any pups during the treatment period, and viability was similar in control and treatment groups. There was a decrease in male body weight at the 100 mg/kg bw/day genistein dose at all time points (PND 6, 14, 21, and weeks 5, 7, 9, and 18 after birth) and at the 50 mg/kg bw/day genistein dose at weeks 5, 7, 9, and 18 after birth. Week 18 body weights were also decreased in the 12.5 and 25 mg/kg bw/day groups at terminal sacrifice. Weight by dose group over the course of the experiment is shown in Figure 4. Benchmark dose values for body weight are given in Table 51. There were no detected differences among groups of males in time to preputial separation, copulation, or fertility, or in number of implants or number of resorptions in sired pregnancies. There were no detected differences among males in serum testosterone, epididymal sperm concentration, or testicular histologic changes, although a 100 mg/kg bw genistein-treated male showed testicular atrophy. Epididymal weight was decreased in all genistein groups, with a mean± SEM control weight of 0.98± 0.03 g and mean weights in treated groups ranging from 0.90–0.92 g. [Using the power model and number of offspring, BMD10 was 217 mg/kg bw/day, the BMDL10 was 92 mg/kg bw/day, the BMD1 SD was 299 mg/kg bw/day, and BMDL1 SD was 124 mg/kg bw/day for epididymis weight.] No treatment effects on relative epididymal weight were detected.
Fig. 4.

Body weight of male rats treated on PND 1–5 with oral genistein 0–100 mg/kg bw/day. Drawn from data presented in Nagao et al. (2001). Error bars omitted for clarity. Pair-wise difference from control in 25 and 50 mg/kg bw/day groups at Weeks 9 and 18, in 50 mg/kg bw/day group at Weeks 5, 7, 9, and 18, and in 100 mg/kg bw/day group at all time points from PND 6 on.
Table 51.
Benchmark Doses for Each Weighing Interval in Nagao et al. (2001)
| Benchmark dosea, mg/kg bw/day
|
||||||||
|---|---|---|---|---|---|---|---|---|
| Male offspring
|
Female offspring
|
|||||||
| Weighing interval | BMD10 | BMDL10 | BMD1 SD | BMDL1 SD | BMD10 | BMDL10 | BMD1 SD | BMDL1 SD |
| PND 6 | 74 | 26 | 485 | 104 | 70 | 50 | 106 | 73 |
| PND 14 | 127 | 67 | 223 | 102 | 100 | 61 | 160 | 96 |
| PND 21 | 158 | 74 | 283 | 103 | 100 | 69 | 113 | 81 |
| 5 weeksb | 142 | 87 | 140 | 84 | 113 | 79 | 98 | 67 |
| 7 weeks | 118 | 75 | 127 | 79 | 98 | 71 | 84 | 60 |
| 9 weeks | 177 | 99 | 172 | 95 | 107 | 74 | 102 | 69 |
| 18 weeks | 78 | 52 | 112 | 73 | Not done | Not done | Not done | Not done |
See the footnote to Table 33 for an explanation of the use of benchmark dose in this report. A power model was used. Doses are rounded to the nearest whole number.
Postnatal weeks.
From Nagao et al. (2001).
There was a decrease in female weight at the 100 mg/kg bw/day genistein dose at all time points (PND 6, 14, 21, and Weeks 5, 7, and 9), in the 50 mg/kg bw/day genistein dose group at Weeks 5, 7, and 9, and in the 12.5 and 25 mg/kg bw/day genistein dose groups at Week 9. A graph of the body weight response by dose group is shown in Figure 5. Benchmark dose values for body weight are given in Table 51. There were no detected differences among groups in age at vaginal opening, days at each stage of the estrous cycle, or mean estrous cycle length. The proportion of females showing normal estrous cycles was decreased in all genistein-exposed groups compared to the control proportion of 21/24. The authors indicated that the reduction in proportion of females showing normal estrous cycles was not dose related. The lack of dose relationship appears due to a proportion of normally cycling females of 8/20 in the 100 mg/kg bw/day dose group compared to 3/13 in the 50 mg/kg bw/day dose group.
Fig. 5.

Weight of female rats treated on PND 1–5 with oral genistein 0–100 mg/kg bw/day. Drawn from data presented in Nagao et al. (2001). Error bars omitted for clarity. Pair-wise difference from control in 25 and 50 mg/kg bw/day groups at Weeks 9 and 18, in 50 mg/kg bw/day group at Weeks 5, 7, and 9, and in 100 mg/kg bw/day group at all time points after PND 6.
No effect of genistein treatment on the proportion of females copulating was detected, but there was a decrease in the proportion of copulated females that were pregnant in all genistein-exposed groups. [Using the power model and number of offspring treated/group, the BMD10 for this endpoint was 20 mg/kg bw/day, the BMDL10 was 15 mg/kg bw/day, the BMD1 SD was 91 mg/kg bw/day, and BMDL1 SD was 63 mg/kg bw/day.] The number of implants per litter was decreased at 100 mg/kg bw/day. [Using the power model and the number of offspring treated/group, the BMD10 for this endpoint was 64 mg/kg bw/day, the BMDL10 was 35 mg/kg bw/day, the BMD1 SD was 115 mg/kg bw/day, and the BMDL1 SD was 79 mg/kg bw/day.]
On histologic evaluation of ovaries on PND 21, each genistein group was said to show polyovular follicles, whereas the control group had no polyovular follicles [there were no data on the proportion of genistein-treated females with this finding]. Among the female rats that were necropsied at 18 weeks, atrophic ovaries were reported in 1/5 rats in the 50 mg/kg bw/day genistein group and 5/10 rats in the 100 mg/kg bw/day group. Of the nine rats in the 100 mg/kg bw/day group listed in a study table, eight showed hypertrophy of uterine luminal epithelial cells. The study authors noted that histologic findings such as ovarian atrophy and hypertrophy of uterine epithelial cells and myometrium in genistein-treated females were consistent with results in females exposed to other estrogenic substances. Hypertrophy of corpora lutea was also described in the text as occurring in “many” rats in the 50 mg/kg bw/day or lower groups. [The table in the paper lists 14 rats in 50 mg/kg bw/day or lower groups, of which five had more than “very slight” hypertrophy of the myometrium and four had hypertrophy of corpora lutea.] Histologic changes, such as hypertrophy of corpora lutea, increased luminal epithelial cell numbers, and increased epithelial folds, were believed by the authors to represent pseudopregnant-like changes associated with increased prolactin, which was shown in another study (Santell et al., 1997) to be produced by genistein treatment of rats. The authors contrasted these histologic changes with the changes produced by ethinyl estradiol in this study and other estrogens in other studies. The polyovular follicles seen on PND 21 in this study also occurred in other studies with other estrogens, according to these authors.
Strengths/Weaknesses
Strengths of this study include a relevant route of exposure during the neonatal period, use of a positive control group, mating of females with proven breeders, allowance of two breeding periods, and blinded histopathologic evaluation of reproductive organs. Weaknesses of the study included not specifying purity of genistein and lack of analytical characterization of dose solutions (e.g., concentration verification, stability, homogeneity). A phytoestrogen-free diet was not used in these experiments. (feed contained ≤2.1 mg genistein/100 g and ≤1.9 mg daidzein/100 g from PND 21 to adulthood, but feed consumption data were not reported). On PND 0, litters were culled to eight pups, four males and four females whenever possible, using three to five males or three to five females per litter. This point was difficult to reconcile with pup numbers in some cases (e.g., in the 50 mg/kg bw/day male group, 28 pups were used from five litters, implying that some litters contained greater than five males). Furthermore, it appeared that the male and female offspring in the same dose groups came from different litters (e.g., 25 males and 25 females were exposed in the 12.5 mg/kg bw/day dose group from five litters (50 pups total), but litters were culled to eight pups per litter, which would equal 40 pups. Different litters of males and females must have been used. Obviously, pup assignments were not clear. Assuming litter-based analyses with an n of 5–7, sample sizes were insufficient for some endpoints, particularly endpoints with greater inherent variance (e.g., epididymal sperm concentrations). It would have been useful if the authors had given some detail as to why estrous cycles did not meet the “normal” criteria inasmuch as there was no significant difference in estrous cycle length or days in any phase of the estrous cycle in genistein-treated animals. There were few details given with respect to serum collection for hormone measurements; consequently, the Expert Panel cannot verify whether the authors controlled for diurnal variation, necropsy stress, etc. It is unclear why thawed cauda epididymis was homogenized in water when typically a medium containing detergent (e.g., Triton X-100) is used. Age at puberty onset was measured; however, the authors did not report body weights at puberty onset. This parameter may be of interest because an estrogenic material might be expected to accelerate vaginal opening, whereas decreased rate of growth (body weight effects) might be expected to delay puberty onset. Vaginal opening at the same age as control animals may mask an effect if it occurred in the presence of decreased body weight (e.g., high-dose females weighed 10% less on PND 21). Incidence of polyovular follicles at 21 days was not given. The authors did not report female body weights after 9 weeks, so it was difficult to determine whether body weight differences may have affected some reproductive parameters. It would have been useful if the authors had reported blood genistein levels in treated pups. The authors stated that the litter of origin was considered in statistical analyses and specified a number of parameters evaluated using the litter as the unit of analysis; however, it does not appear that all endpoints were controlled for litter of origin. For example, it does not appear that litter was the unit of analysis for estrous stage length. Study Figure 1 lists n values as 24, 20, 14, 13 and 20, which does not suggest litter-based analyses. Furthermore, reproductive performance data (study Table 3) did not use a litter-based analysis.
Utility (Adequacy) for CERHR Evaluation Process
This study is useful in the evaluation process.
Fritz et al. (2002a), funded by DoD and NIH, evaluated the effects of dietary genistein on prostate development in the rat. Sprague-Dawley rats on an unspecified diet were bred when females were 9 weeks old. Litters were culled at birth to 10 pups [sex ratio not specified] and weaned on PND 21. After birth, dams were given the phytoestrogen-free AIN-76A diet. Offspring were weaned to this diet with the addition of genistein (98.5% pure) at 0, 250, or 1000 mg/kg feed [ppm; ~0, 37, and 147 mg/kg bw/day in weanling rats, estimated using EPA (1988) assumptions]. The 250 ppm diet was said to produce genistein serum concentrations at the “high physiological” level, and the 1000 ppm diet was said to produce serum concentrations at the “extreme of those found in humans consuming soy products” [serum levels were not obtained in this study, but reference was made to Fritz et al. (2002b)]. Additional animals were given the AIN-76A diet with diethylstilbestrol 75 μg/kg feed [ppb]. Other animals were fed the AIN-76A and received s.c. testosterone 10 mg/kg bw/day, dihydrotestosterone 2 mg/kg bw/day, or an equivalent volume of the DMSO vehicle on PND 26–35. [A data table implies that there were no injections in the animals given treated feed. The number of animals in each group is specified as eight in the data table; it is not known how many litters gave rise to these eight animals per treatment group.] Offspring were killed on PND 35, and the dorsolateral prostate was dissected. The individual lobes (dorsal prostate and Types 1 and 2 lateral prostate) were identified in fixed whole mounts for measurement of bud perimeter and main duct length. Measurements were made of dorsolateral prostate 5α-reductase activity, expressed as percent dihydrotestosterone formed from total androgens (testosterone+ dihydrotestosterone), and mRNA for dorsal protein 1, a marker for prostate differentiation, was determined using RT-PCR followed by electrophoresis and expressed by comparison to β-actin. Serum testosterone and dihydrotestosterone were determined with a kit. Data were analyzed by ANOVA with post-hoc Dunnett test. Because there was no difference between the group receiving untreated AIN-76A and the group receiving DMSO, the AIN-76A group values were taken as control values.
There was no detected effect of genistein at either exposure level on relative dorsolateral prostate weight, mRNA expression of dorsal protein 1, or serum testosterone or dihydrotestosterone. Bud perimeter of the Type 1 lateral prostate lobe was decreased by 23% in the group exposed to genistein 1000 ppm, but no other effects of genistein at either exposure level on prostate morphology were detected. Diethylstilbestrol decreased relative weight of the dorsolateral prostate, decreased the perimeter of all three lobes, and decreased dorsal protein 1 mRNA. The androgen treatments had effects opposite to those of diethylstilbestrol. The activity of 5α-reductase was said to be decreased 10% by dietary genistein 250 ppm and 14% by dietary genistein 1000 ppm. [Data were not shown, and the P value was given as < 0.08.] The authors concluded that dietary genistein may have little estrogenic effect due to the extent to which it is conjugated, by comparison to estrogenic effects reported in studies using genistein injections, which result in a lower rate of conjugation.
Strengths/Weaknesses
A strength of the study is that after delivery, dams and subsequently male rats on study were fed a phytoestrogen-free AIN-76A diet. Genistein was 98.5% pure. Multiple dose levels of genistein (250 and 1000 mg/kg diet) were used, which allowed a dose–response assessment. The authors looked at the effects of genistein on the developing testis following exposure from weaning (PND 21) to PND 35. Genistein exposures were reportedly within realistic ranges for humans and did not alter body weights or feed consumption in experimental animals. Genistein was administered in the diet, a relevant route of exposure. Genistein blood levels were not reported, although these values were recorded in a previous experiment using this exposure paradigm. The authors examined genistein effects on both prostate structural (bud size) and functional parameters (5α-reductase levels and dorsal protein 1 expression). RNA data were normalized to β-actin expression. The effects of genistein were contrasted against effects seen with other estrogenic and androgenic materials. A weakness of the paper is that there was insufficient experimental detail to fully evaluate the study. There were no analytical data provided to verify dietary concentrations of genistein, stability of genistein in feed, or homogeneity of diets. There was no indication whether the authors controlled for litter effects. There was no information on how weanling rats were assigned to different treatment groups or whether they were singly housed during the study. Exposures were identified as 250 and 1000 mg/kg diet without conversion to dose levels on a mg/kg bw basis (data on feed consumption were not provided). While the authors stated that body weights were not affected by this dosing paradigm, body weights of animals were not given at any time point. There was no indication whether the authors controlled for diurnal variation or necropsy stress when collecting samples for serum hormone measurements. Activity of 5α-reductase was expressed only as percent of mean control activity; the value for mean control activity was not given. For prostate bud perimeter measurements, it was unclear how the authors listed the sample size in study Figure 2 (i.e., n = 18+37+28, which is the sample size for lateral prostate Type 1, lateral prostate Type 2, and dorsolateral prostate, respectively. It appeared that each of those areas was analyzed separately). Due to technical difficulties, dorsal protein 1, a marker of prostate differentiation, could only be analyzed using whole dorsolateral prostate (not individual lobes). The relevance of genistein exposure in rats during this peripubertal period to human infants fed soy formula was not discussed.
Utility (Adequacy) for CERHR Evaluation Process
This study is of limited utility in the evaluation process.
Fritz et al. (2003), funded by DoD and NIH, evaluated the effects of dietary genistein on testicular development in rats. Sprague-Dawley rats were bred and given the phytoestrogen-free AIN-76A diet. Litters were culled at birth to 10 pups [sex ratio not specified]. Offspring were weaned on PND 21 to the AIN-76A diet with the addition of genistein (98.5% pure) at 0, 250, or 1000 mg/kg feed [ppm]. The 250 ppm diet was said to produce genistein serum concentrations at the “high physiological” level, and the 1000 ppm diet was said to produce serum concentrations at the “extreme of those found in humans consuming soy products.” [Serum levels were not obtained in this study, but reference was made to Fritz et al. (2002b). This citation was also used to support the statement that feed consumption and weight were not altered by the dietary treatments.] Additional animals were given the AIN-76A diet with diethylstilbestrol 75 μg/kg feed [ppb]. [The design and the apparent number of animals in each treatment group (n = 8) is identical to Fritz et al. (2002a), discussed above, in which prostate was investigated, leading to the possibility that the same animals were used in both studies.] Animals were killed on PND 35 and testes harvested. One testis was sectioned and a middle section fixed in formalin, embedded in paraffin, and stained with hematoxylin and eosin. An additional piece of the same testis was subjected to Western blot analysis for androgen receptor, EGF receptor, extracellular signal-related kinase, and phosphorylated extracellular signal-related kinase. Immunohistochemistry was performed on deparaffinized sections for androgen receptor, phosphorylated extracellular signal-related kinase, EGF receptor, and PCNA. DNA fragment end-labeling was used in sections from three rats/group to detect apoptosis in seminiferous tubules. The other testis was used for assessment of aromatase activity, measured as the release of tritiated water after conversion of testosterone labeled in the 1 position. RT-PCR was used to measure mRNA for aromatase. Testicular testosterone and 17β-estradiol were measured using RIA kits. Statistical analysis was by one-way ANOVA with post-hoc Tukey test.
No statistically significant effects of genistein exposure on testis weight, seminiferous tubule dimensions, percent apoptotic tubules, testicular histology, immunohistochemistry, or testicular testosterone or 17β-estradiol were detected. [The authors state that testicular testosterone “tended to be greater” and 17β-estradiol “tended to be lower,” with P values given as < 0.546 and < 0.793 for the comparisons. The Expert Panel is not convinced that intratesticular steroid hormones were shown to be altered by treatment. The authors identified androgen receptor protein as decreased by genistein, although not significantly so. The Expert Panel found a significant decrease on re-analysis of the authors’ data, however. The values and P values appear in Table 52.]
Table 52.
Effect of Dietary Genistein (PND 21–35) on Rat Testis Development
| Dietary genistein (ppm) | Androgen receptor protein | Aromatase activity | Aromatase mRNA relative to β-actin |
|---|---|---|---|
| Percent of control | |||
| 0 | 100.0± 9.1 | 100± 10.4 | 100± 12.5 |
| 250 | 88.2± 4.6 | 81.6± 11.8 | 87.9± 13.0 |
| 1000 | 71.0± 7.0a | 74.8± 6.7b | 71.9± 8.0b |
| ANOVA overall P value | 0.03 | 0.20 | 0.24 |
| Benchmark dosec, ppm | |||
| BMD10 | 355 | 440 | 368 |
| BMDL10 | 241 | 237 | 209 |
| BMD1 SD | 688 | 1243 | 1139 |
| BMDL1 SD | 431 | 618 | 590 |
n = 8/group.
P < 0.05 compared to 0 ppm group by post-hoc Tukey test.
Identified as different from control by authors. For aromatase activity, P = 0.06 and for aromatase mRNA, P = 0.08 [t-testing performed by CERHR].
See the footnote to Table 33 for an explanation of the use of benchmark dose in this report.
From Fritz et al. (2003).
Testicular aromatase activity and mRNA expression (compared to β-actin) were described as significantly decreased in the high-dose genistein group. [Data analysis by CERHR did not identify a statistically significant effect of genistein, as indicated in Table 52.]
The authors concluded that dietary genistein did not cause effects on the developing testis as adverse as did injected genistein, reported in other papers, and indicated that the difference by route of administration may be due to the greater proportion of genistein that is conjugated after oral administration. The authors believed the increase in testicular testosterone and decrease in testicular 17β-estradiol were consistent with a decrease in testicular aromatase. [The Expert Panel notes that none of these increases and decreases were verified by statistical analysis.]
Strengths/Weaknesses
A strength of this study was that after delivery, dams and subsequently male rats on study were fed a phytoestrogen-free AIN-76A diet. Genistein was 98.5% pure. Genistein was administered in the diet, a relevant route of exposure. The authors looked at the effects of genistein on the developing testes following exposure from weaning (PND 21) to PND 35. Multiple dose levels of genistein (250 and 1000 mg/kg diet) were used, which allowed a dose–response assessment. The authors examined genistein effects on a variety of testicular parameters, including testicular weight, morphology, apoptosis in the seminiferous tubules, androgen receptor protein concentration and localization, and expression of EGF receptor and extracellular signal-regulated kinases (ERK). The effects of genistein were compared to effects seen with the estrogenic positive control diethylstilbestrol. Genistein exposures were reportedly within realistic ranges for humans and did not alter body weight or feed consumption in experimental animals. Genistein blood levels were reported, although the values were recorded in a previous experiment using this exposure paradigm. The authors reported that appropriate negative (normal serum) and positive (unspecified tissues) controls were included in immunohistochemistry experiments. In experiments to determine aromatase activity, appropriate controls were included (i.e., testicular homogenates, addition of unlabeled testosterone to test samples, background radioactivity determination). In initial experiments to determine testicular testosterone and 17β-estradiol levels, the percent recovery demonstrated that loss of radioactivity was not significant. A weakness of this paper is that there was insufficient experimental detail to fully evaluate the study. There were no analytical data provided to verify dietary concentrations of genistein, stability of genistein in feed, or homogeneity of diets. There was no indication as to whether the authors controlled for litter effects. There was no information provided on how weanling rats were assigned to different treatment groups or whether they were singly housed during the study. While the authors stated that body weights were not affected by this dosing paradigm, body weights of animals were not given at any time point. This also was true for aromatase activity and aromatase expression (mRNA), which were reported relative to control values without presenting the control data. Testes sections were fixed in formalin, which is not the best preservative for tissue histopathology (Hess and Moore, 1993). The number of nuclei examined per tubule was not specified in apoptosis experiments. Changes in testicular testosterone and 17β-estradiol levels were not statistically different. The relevance of genistein exposure in rats during this peripubertal period to human infants fed soy formula was not discussed.
Utility (Adequacy) for CERHR Evaluation Process
This study is of limited utility in the evaluation process.
Kouki et al. (2003), in a study sponsored by a grant from the Ministry of Education, Science, Culture and Sports of Japan, examined the effects of neonatal genistein treatment of rats. Female Wistar rats were s.c. injected with sesame oil (n = 10) or 1 mg genistein/day (n = 9) [purity not specified] from PND 1 (day of birth) to PND 5. [Based on the assumed body weight of 0.052 kg for a female weanling rat (EPA, 1988), the dose was estimated at 19 mg/kg bw/day.] Each treatment group was represented by rats from two or three litters, and rats from the same litter received the same treatment. Rats were checked for vaginal opening. Vaginal smears were examined from the day of vaginal opening through PND 60, when rats were ovariectomized. Ovaries were fixed in Bouin fluid and examined for corpora lutea. One to two weeks following ovariectomy, rats were s.c. implanted with 17β-estradiol-containing tubes, and behavioral tests were conducted to examine sexual behavior with male rats. Statistical analyses included Mann-Whitney U-test for vaginal opening data and ANOVA for sexual behavior data.
The mean day of vaginal opening in the genistein group (28 days; range = 26–35 days) was significantly accelerated compared to the control group (35 days; range = 33–38). Normal estrous cycles were observed in all rats of the control group but in no rats in the genistein group. In the genistein group, 6/9 rats displayed prolonged estrus and 3/9 displayed persistent estrus. Ovarian weights were significantly reduced by almost half in the genistein group compared to controls. Corpora lutea were present in 2/9 rats in the genistein group and all rats of the control group. In sexual behavior tests conducted at 2, 4, and 6 days following implantation with 17β-estradiol, the lordosis quotient was significantly lower than the control value only on the third day of testing [~95 in control group and 68 in treated group]. All but one of the genistein-treated rats displayed lordosis response. In comparison to other compounds also examined in this study, the response to genistein group was similar to the response to 17β-estradiol, although reduction of lordosis response was greater in the 17β-estradiol group. Most results for daidzein were similar to controls. The study authors concluded, “These results suggest that genistein acts as an estrogen in the sexual differentiation of the brain and causes defeminization of the brain in regulating lordosis and the estrous cycle in rats.”
Strengths/Weaknesses
A strength of this study is that female Wistar rats were exposed to genistein 1 mg/day s.c. on PND 1–5, a dosing paradigm that included administration during the neonatal period; however, the s.c. route is not relevant to human exposure. A relatively broad assessment of female reproductive endpoints was conducted including vaginal patency, estrous cyclicity, ovarian weight, corpora lutea counts, ovarian histopathology, and sexually dimorphic behavioral tests (lordosis quotient). Rats were ovariectomized and given implants of 17β-estradiol prior to behavioral tests in an effort to control for inter-animal variability in exogenous 17β-estradiol levels. Repeated measures ANOVA was used for the behavioral tests conducted on Days 2, 4, and 6 after 17β-estradiol tubes were implanted. A weakness of the study is that only one dose level of genistein was used, which does not allow for evaluation of dose–response relationships. There was no evidence that the authors controlled for litter effects (i.e., the authors state that all female pups within a litter received the same treatment, and two to three litters were used in one treatment group. If the litter was the unit of analysis, sample sizes would have been n = 2–3, which is insufficient for many of the parameters discussed). Furthermore, the authors apparently used multiple comparisons for numerous endpoints (genistein vs. control, genistein vs. daidzein, etc.), with no indication that there was protection of the alpha level to prevent Type I errors.
Utility (Adequacy) for CERHR Evaluation Process
This study is not useful in the evaluation process.
Cotroneo et al. (2001), supported by NIH, evaluated the effects of genistein on uterine weight in the Sprague-Dawley rat. Female rat pups were injected s.c. with estradiol benzoate 0.5 mg/kg bw (positive control), genistein [purity not specified] 500 mg/kg bw, or vehicle (DMSO). Pups were treated on PND 16, 18, and 20. During their gestation, the dams had been given a phytoestrogen-free diet (AIN-76A). On PND 21, one group of pups was killed 18–20 hr after the last injection. Other pups were weaned to the phytoestrogen-free diet and were killed on PND 50 or 100. A separate group of 16-day-old pups was ovariectomized and treated with s.c. injections of estradiol benzoate, genistein, or vehicle at 16, 18, and 20 days of age, as above. On PND 21, these pups were killed 18–20 hours after the last injection. [There was no information on how many litters gave rise to these pups or whether littermates were treated together or were randomized to treatment groups.] An additional group of rats was exposed to genistein in the diet. Because the dietary study focused primarily on uterine weight, this endpoint is included in Table 28, which summarizes estrogenicity studies. Uteri were weighed, and whole uterine extracts were analyzed by Western blot for ERα, progesterone receptor, and androgen receptor protein. Immunohistochemistry for ERα localization was performed on uterine sections. Scoring of sections was based on assigning 0, + (weak), ++ (moderate), +++ (strong), or ++++ (intense) to each of three uterine structures (epithelium, muscle, stroma) and averaging the individual ranks. RT-PCR was used to quantitate uterine mRNA for ERα, ERβ, progesterone receptor, androgen receptor, and β-actin (which was used to normalize the receptor measurements). Total and unconjugated genistein was measured in serum [method of collection not given] by HPLC-MS with a detection level of 10 pM [2.7 ng/L]. RIA kits were used to determine serum 17β-estradiol, progesterone, and testosterone. Statistical analysis was performed using ANOVA [post-hoc test not indicated].
The responses of intact and ovariectomized rats assessed on PND 21 are summarized in Table 53. Hypertrophy of the luminal and glandular epithelium of the uterus was reported in animals treated with either genistein or estradiol benzoate. Immunohistochemical staining intensity for ERα was less intense in uteri from animals treated with genistein or estradiol benzoate compared to control. Uterine mRNA for ERα was decreased 37% in genistein-treated rats compared to controls [estimated from graph]; an apparent reduction in estradiol benzoate-treated rats of similar magnitude was not statistically significant. No treatment effects on mRNA for ERβ, progesterone receptor, or androgen receptor were detected. ERα protein was decreased 66% from the control value on PND 50 (30 days after the last treatment) in genistein-exposed rats but recovered to control levels by PND 100. Estradiol benzoate treatment had no observed effect on ERα protein on PND 50 or 100. There were no detected effects on progesterone or androgen receptor protein on PND 50 or 100 after treatment with either genistein or estradiol benzoate. Although serum 17β-estradiol levels were increased and progesterone levels were decreased by genistein and estradiol benzoate treatment on PND 21, neither treatment was shown to alter serum 17β-estradiol or progesterone on PND 50; serum hormone assays were not performed at PND 100. Total serum genistein concentrations in intact rats after genistein treatment on PND 16, 18, and 20 were as follows: PND 21 (n = 6) 5558± 1434 nM [1502± 388 μg/L aglycone equivalent]; PND 50 (n = 7) 39± 12 nM [11± 3 μg/L aglycone equivalent]; and PND 100 (n = 9) 13± 1 nM [4± 0.3 μg/L aglycone equivalent; error not given, but SEM was used elsewhere in this manuscript for reporting data]. Free genistein was reported as follows: PND 21: 1956± 114 nM [529± 31 μg/L]; PND 50: 16± 6 nM [4.3± 1.6 μg/L]; and PND 100: 6± 1 nM [1.6± 0.3 mg/L].
Table 53.
Response of Intact and Ovariectomized Female Rats to Genistein or Estradiol Benzoate Assessed on PND 21 (Relative to Vehicle Control)
| Intact
|
Ovariectomized
|
|||
|---|---|---|---|---|
| Parameter | Genistein | Estradiol benzoate | Genistein | Estradiol benzoate |
| Relative uterine weight | ↑ 2.3-fold | ↑ 2.2-fold | ↑ 2.4-fold | ↑ 2.6-fold |
| Serum 17β-estradiol | ↑ 1.6-fold | ↑ 1.8-fold | Not evaluated | |
| Serum progesterone | ↓62% | ↓52% | ||
| Serum testosterone | ↔ | ↔ | ||
| ERα proteina | ↓76% | ↓62% | ↓88% | ↓89% |
| Progesterone receptor proteina | ||||
| Isoform A | ↑ 1.7-fold | ↑ 1.7-fold | ↑ 1.4-fold | ↑ 2.1-fold |
| Isoform B | ↑ 1.5-fold | ↑ 1.8-fold | ↑ 1.5-fold | ↑ 1.5-fold |
| Androgen receptor proteina | ↓22% | ↓17% | ↓22% | ↓30% |
Rat pups were injected s.c. with vehicle, genistein (500 mg/kg bw), or estradiol benzoate (0.5 mg/kg bw) on PND 16, 18, and 20 and killed on PND 21; n = 8/group. Ovariectomy was performed on PND 16.
↑,↓ Significant increase, decrease compared to vehicle control. ↔ no significant difference from vehicle control.
Estimated from graph.
From Cotroneo et al. (2001).
[The Expert Panel noted that effects seen with a high dose (500 mg/kg bw) of injected genistein mimicked those seen with injected 17β-estradiol (e.g., increased uterus:body weight ratio, increased serum 17β-estradiol, decreased serum progesterone, decreased uterine ERα and androgen receptor, increased uterine progesterone receptor A and B, decreased uterine ERα mRNA and immunohistochemical labeling, and hypertrophy of uterine luminal and glandular epithelia). Similar results were seen in ovariectomized rats treated with genistein via the same dosing paradigm and sacrificed on PND 21 (e.g., increased uterus:body weight ratio, decreased serum progesterone, decreased uterine ERα and androgen receptor, increased uterine progesterone receptor A and B). However, as noted in Table 28, at 250 mg genistein/kg diet, uterus:body weight ratio and uterine ERα, progesterone receptor, and androgen receptor protein levels were not altered.]
The authors concluded that the decrease in ERα protein after genistein treatment may have been due to hydrolysis or to extended retention of nuclear receptor. They attributed the increase in progesterone receptor to a direct action of genistein on ERα and believed genistein exerted much of its action in this system through ERα in spite of its greater affinity for ERβ. Although they acknowledged the statistically significant decrease in androgen receptor protein, they questioned the biologic significance of this finding inasmuch as androgen receptor message was not decreased and testosterone serum levels were not decreased. The authors noted that the large dose of genistein given in this study may have remained for a prolonged time under the skin of the animals, serving as a repository for continuous exposure over time. They also cited studies showing that a greater proportion of an injected than an oral dose of genistein remains free (unconjugated) and therefore biologically active. [The Expert Panel noted that the data from this study demonstrate uterotropic effects following s.c. but not dietary exposure, thus supporting the hypothesis that the s.c. route of exposure impacts the absorption and metabolism of genistein, resulting in greater concentrations of free, bioavailable genistein. Genistein blood levels following dietary exposure were not measured in this study, but an earlier study in the same laboratory demonstrated higher levels of free genistein with s.c. vs. oral exposure (Fritz et al., 1998). In the earlier study, total genistein concentrations in serum following dietary exposure to 250 mg/kg diet from conception to PND 21 was 1810± 135 pmol/mL (average percent free genistein was 7%) compared with 5558 ± 1434 nM total genistein in serum after s.c. injection of 500 mg/kg bw on PND 16, 18 and 20 (average percent free genistein was 27%).]
Strengths/Weaknesses
A strength of both the dietary and s.c. injection experiments is that pregnant rats were fed an AIN-76A phytoestrogen-free diet. Injections were carried out at approximately the same time each day and necropsy time was controlled, which would help to control diurnal variability in hormone measurements. Post-pubertal animals (50- and 100-day-old rats) were sacrificed in the same phase of the estrous cycle (estrus). The authors verified that genistein would not interfere with the procedure used to measure serum 17β-estradiol. Appropriate controls were included in the Western blot analyses and immunohistochemistry experiments. Both total and free (unconjugated) genistein levels were measured in serum following injection of genistein. A weakness is that in both the s.c. injection and dietary portions of this study, only one dose level of genistein was used, which does not allow for evaluation of dose–response relationships within a given dosing paradigm. Dose volumes were not given. The genistein dose injected s.c. was 500 mg/kg bw, which is a high dose level. There was no evidence that the authors controlled for litter effects (in fact, the authors do not state how many pregnant dams/litters were used in this study). Statistical description was inadequate (post-hoc test[s] not identified). Data for uterine and body weights were presented as ratios (raw data not given). 17β-Estradiol did not decrease ERα mRNA concurrent with decreases in ERα protein levels; similarly, genistein did not increase progesterone receptor mRNA expression concurrent with increases in progesterone receptor protein levels; these discrepancies were attributed to the time post-dosing at which samples were collected. The dose equivalent (mg/kg bw) of the 250 mg/kg diet dose level used in this study was not given.
Utility (Adequacy) for CERHR Evaluation Process
This study was somewhat useful for comparing the effect of route differences on genistein effects on the uterus.
Lamartiniere et al. (1998), funded by NIH and the American Institute for Cancer Research, examined the effects of prepubertal genistein exposure on reproductive and developmental toxicity in female Sprague-Dawley rats. On PND 16, 18, and 20, 20 females/group were injected with DMSO vehicle or genistein [purity not specified] at 500 μg/g [mg/kg] bw. [The treatment route was not specified but assumed to be s.c. based on other studies conducted in this laboratory.] At 9 weeks of age, fertility was evaluated by mating the treated females to untreated males for 3 weeks. One untreated male was used for one treated and one control female. After birth of the litter, the dams were separated from the pups and bred to a different male. The rats were bred a total of three times. In each breeding cycle, 16–20 dams gave birth to litters. Although the number of litters in the genistein group was slightly lower, the effects were not statistically significant. [Procedures for statistical analysis were not discussed for any of the endpoints in this study.] No differences were detected in the number of male and female pups in either treatment group. After the third breeding, the dams were weighed and killed. No effects on body or ovarian weight were noted, but uterine weight was significantly reduced [by 16%] in the genistein-treated rats compared to controls. Though the number of ovarian follicles tended to be higher in the prepubertally treated rats, there were no significant effects on number of corpora lutea or numbers of normal or atretic primordial, growing, or antral follicles. [Methods for ovarian histology were not specified.] Offspring from the third litter were evaluated for endocrine-related parameters. Evaluations were performed on 16 genistein-exposed and 19 control litters. Compared to controls, there was no effect on body weight or anogenital distance in offspring born to dams treated prepubertally with genistein. No treatment-related effect was detected on sexual maturity, as determined by age of testicular descent or vaginal opening. Changes in estrous cycling were not detected in 16 female offspring per group at 43–50 days of age. Prepubertal genistein treatment of dams also had no detected effect on body, ovarian, or uterine weight of 50-day-old female offspring or prostate or epididymal weight of 56-day-old male offspring. Study authors concluded that genistein was too weak an estrogen to cause endocrine and reproductive tract changes following prepubertal exposure.
Strengths/Weaknesses
A weakness of this study is that methods for the continuous breeding study were not fully discussed. The purity of genistein was not given, and dose solutions were not analyzed for concentration or verified for stability or homogeneity. The authors did not mention the use of phytoestrogen-free diet, suggesting the possibility of additional genistein exposure. The authors used only one dose level of genistein, so dose–response relationships could not be evaluated, and the dose may have been s.c., which is not relevant for human exposure. There were no details as to how pups were assigned to treatment groups, and no indication was given that the authors controlled for litter effects. The authors reported that the uterine weights of multiparous female rats exposed to genistein were lower than control rats; however, there was no mention as to whether the authors controlled for estrous stage at necropsy. Methods for statistical analyses were not identified.
Utility (Adequacy) for CERHR Evaluation Process
This study is not useful in the evaluation process.
Lee et al. (2004b), supported by the Korea Science & Engineering Foundation and Korea Research Foundation, examined the effect of genistein exposure on calbindin-D9k expression in immature rat uterus. Sprague-Dawley rats were obtained at 18 days of age and fed a soy-free diet. A series of studies was conducted following an acclimation period [duration of acclimation period and age of rats at start of dosing not specified]. In a dose–response experiment, rats were s.c. injected with DMSO (negative control, n = 3/group), 17β-estradiol (positive control, n = 3/group) or genistein [purity not reported] 0.4, 4, or 40 mg/kg bw/day (n = 5/group) for 3 days. Rats were killed 24 hr following the last injection. In a study to examine the effects of genistein over time, 18 rats/group were s.c. injected with DMSO or genistein 40 mg/kg bw/day for 3 days, and 3 rats/group were killed at 3, 6, 12, 24, 48, or 72 hr following the last injection. In a third study, 10 rats [presumably 2/group] were s.c. injected with ICI 182,780 before s.c. injection with 40 mg/kg bw/day genistein or 17β-estradiol for 3 days and killed 24 hr following the last injection. Uteri were removed and RNA was extracted for northern blot and RT-PCR analysis of calbindin-D9k expression. Protein levels of calbindin-D9k in uterus were also measured by Western blot. Expression of ERα and ERβ protein and progesterone receptor mRNA were examined in the time-response study. Data were analyzed by ANOVA, Kruskal-Wallis test, and Dunnett test for multiple comparisons.
In the dose–response experiment, calbindin-D9k protein levels in uterus were increased 3-fold following treatment with genistein 40 mg/kg bw/day. The time-response study demonstrated that calbindin-D9k mRNA expression was increased from 3 to 12 hr following exposure, and protein levels were increased from 3 to 48 hr following exposure; control levels were obtained for mRNA at 24 hr and for protein by 72 hr following exposure. Pretreatment of rats with ICI 182,780 completely blocked increases in calbindin-D9k protein expression that were induced by both genistein and 17β-estradiol. Genistein had no detected effect on ERβ protein expression. ERα protein expression was increased at 3 hr and returned to control levels at 12 hr following exposure. Progesterone receptor mRNA levels were increased at 3 hr following exposure and returned to control levels by 6 hr following exposure. According to the study authors, this study demonstrated that genistein stimulated calbindin-D9k expression via the ERα receptor in immature rat uterus.
Strengths/Weaknesses
Strengths include the well defined treatment during prepuberty, the reasonable number of animals, the use of three dose levels of genistein, two of which were within the range of human exposure levels, the comparison to 17β-estradiol, and the use of ICI 182,780 pre-treatment to confirm the estrogenic nature of the effects observed. Weaknesses include the limitation of tissues examination to the uterus, the limitation of endpoints to calbindin-D9k, ER, and progesterone receptor, the s.c. dose route, and the examination of only short-term effects.
Utility (Adequacy) for CERHR Evaluation Process
Although not directly useful in the current evaluation, this study is useful in a consideration of mechanism of action of genistein in a female reproductive tissue at the sensitive developmental time of prepuberty. The finding that genistein treatment increases ERα expression may be relevant when evaluating the genistein-associated risk of uterine cancer.
Csaba and Karabélyos (2002), supported by the National Scientific Research Fund of Hungary, examined the effects of a single neonatal dose of genistein [purity not stated] on the sexual behavior of adult rats. Within 24 hr of birth, male and female Wistar rats were given a single s.c. dose of 20 μg genistein or 20 μg genistein+ 20 μg benzpyrene in 0.066% DMSO. Controls were treated with the vehicle. [The number of litters from which pups were obtained was not specified. Benzpyrene (not otherwise specified) was given because a previous study by these authors had shown an effect of this chemical on sexual behavior.] Sexual behavior was examined at 4 months of age. On ~4 different days during a 2-week period, receptivity was assessed in 24 females/group during estrus. Sexual behavior with a receptive female was tested in 10 males/group during a 30-min period, once a week, for 4 weeks. Data were averaged and evaluated by Student t-test and χ2 test.
Receptivity was not found to be significantly affected in females when evaluated by the Meyerson index (a binary evaluation of lordosis), but the lordosis quotient (lordosis response in 10 matings) was significantly increased by genistein treatment (~35% in controls compared to 45% in the genistein group). Genistein treatment significantly reduced sexual inactivity in male rats (50% of controls vs. 32.5% of genistein-treated males inactive). The number of multiple ejaculations was increased by genistein treatment, with a 10% rate in the genistein group and no occurrences in controls. No significant effects were reported for mounting or intromission. No significant findings compared to controls were reported for males or females in the genistein +benzpyrene group. The study authors concluded that sexual activity in male and female rats is promoted by a single neonatal genistein treatment and that benzpyrene counters this effect.
Strengths/Weaknesses
In this study, the effects of estrous stage were controlled by only testing females during estrus. Sample sizes were sufficient for female rats (24/dose group) but were less robust for male rats (only 10/group). It is not clear whether the authors controlled for litter effects in males or females or the litter was used as the unit of analysis. This study used Wistar rats from a closed breed colony (not commercially available). Only one dose level of genistein was used, which does not allow for evaluation of dose–response relationships, and the s.c. dose route is not relevant to human exposure. Purity of the genistein test material was not specified, and dose solutions were not analyzed to verify dose level, stability, or homogeneity. Dose volumes were not given. It was not clear how many experienced males or receptive females were used in this study. The increased activity in genistein-treated males may have been related to the fact that half of the control males were inactive, which seems high given that the males were co-housed with receptive females. Without some historic control data, it is difficult to put this information into context. Because this study used a single genistein exposure within 24 hr of birth, it is difficult to extrapolate these data for human exposure scenarios.
Utility (Adequacy) for CERHR Evaluation Process
This study is not useful in the evaluation process.
Lewis et al. (2003), funded by UK Foods Standards Agency, treated neonatal rats [strain not indicated] to simulate lactational exposure to genistein. Targeted exposures were 4 and 40 mg/kg bw/day orally. Preliminary studies showed that it would be difficult to achieve the high dose using exposure through the milk of treated dams due to the limited access of genistein to milk, so direct dosing of pups was planned. Subcutaneous dosing of pups on PND 1–6 was used (due to the difficulty of gavaging very young pups in large numbers) followed by gavage treatment of pups on PND 7–21. The s.c. doses equivalent to the targeted oral doses were determined to be 0.2 and 4 mg/kg bw/day based on AUC determinations; however, due to an error, the experiment was initially performed with the high s.c. dose on PND 1–6 equivalent to an oral dose of 20 mg/kg bw/day. A subsequent study was added in which the correct s.c. dose was tested for one of the endpoints (volume of the SDN-POA). Studies to establish doses were based on single-dose administration reported in this paper and are reviewed in Section 2. The low-dose genistein regimen produced AUC values after a single s.c. or oral dose of 4.58–7.52 μg equivalents-hours/mL, and the high dose regimen produced AUC values after a single s.c. or oral dose of 38.3–56.8 μg equivalents-hr/mL.
The main study on general postnatal development used 60 time-mated rats allocated to three equal groups. Rats were allowed to deliver their litters. Pups were dosed as indicated above. [It is implied that pups within the same litter were given the same treatments.] On PND 5, litters were standardized to include three or four males and three to five females [final litter size not given]. Dosing with genistein or vehicle was continued to PND 21. On PND 22, one male and one female pup per litter were killed and serum was taken for FSH and LH and for testosterone (males only) and 17β-estradiol and progesterone (females only). Uterine weights were recorded. Surviving males were evaluated for age and weight at testicular descent. Pups were weaned on PND 29, at which time up to two males and two females/litter were retained to make up groups of 30 males and 40 females per dose. Age and weight at vaginal opening and preputial separation were recorded. Daily vaginal smears were obtained from 20 females from the time of vaginal opening until the second proestrus, at which time the females were killed and serum was taken for measurement of FSH, LH, 17β-estradiol, and progesterone. Males were killed at 13 weeks of age, and serum was collected for FSH, LH, and testosterone measurement. Epididymides, prostates, seminal vesicles, and testes were weighed. [In the results section, it appears that some females and males were killed at 12 rather than 13 weeks.]
A separate study using reproductive neuroendocrine endpoints was performed using five pregnant rats in each of four dose groups. Animals were allowed to litter, following which five litters each were treated with diethylstilbestrol, low-dose genistein, high-dose genistein, or carboxymethylcellulose vehicle. As in the previous study, the treatments on PND 1–6 were s.c. and consisted of diethylstilbestrol 10 μg/kg bw/day, genistein 0.2 mg/kg bw/day, genistein 2 mg/kg bw/day, or vehicle. Treatments on PND 7–21 were by gavage and consisted of diethylstilbestrol 10 μg/kg bw/day, genistein 4 mg/kg bw/day, genistein 40 mg/kg bw/day, or vehicle. On PND 22, 10–12 rats/sex/dose group were retained. The remaining rats were killed and uterine and testis weights were recorded. The retained animals underwent ovariectomy and orchidectomy on PND 22–24. Intra-atrial cannulas were inserted between PND 42 and 54 for repetitive blood sampling. Blood was sampled for LH every 15 min, beginning 15 min before a 50-ng/kg gonadotropin-releasing hormone (GnRH) i.v. bolus through 30 min after the bolus. Animals were then anesthetized and perfusion fixed through the aorta with 4% paraformaldehyde. Brains were removed and stored for at least a week in 4% paraformaldehyde. Coronal sections were stained with cresyl violet, and the volume of the SDN-POA was estimated from serial sections using an image analysis system. Data analysis was by ANOVA with post-hoc t-test. After PND 1, pup weight was evaluated using ANCOVA with PND 1 weight as a covariate. Proportions were evaluated using the Fisher exact test.
In the general postnatal development study, no effect of genistein exposure on clinical condition or pup body weight gain was detected. Anogenital distance was described as not influenced by treatment on PND 2. There was said to be no “biologically significant difference” in anogenital distance between genistein-and vehicle-treated pups on PND 22 [data were not shown]. No treatment-related effects on hormone levels in serum on PND 22 [data were not shown] were detected. Uterine weight on PND 22 was increased in animals exposed to the high dose of genistein compared to the controls [mean± SD uterine weights estimated from figure: control 25± 2.5 mg (n = 17); low-dose genistein 27.5± 5 mg (n = 17); high-dose genistein 52.5± 7.5 mg (n = 14). The figure used μg; the Expert Panel assumes that mg was meant.] There were no differences in uterine weight in 12-week-old animals exposed to genistein during the lactation period. Vaginal opening was advanced a mean of 4 days in the high-dose genistein group compared to the control. There was no detected change in age at vaginal opening in the low-dose genistein group. Most females in the high-dose genistein group demonstrated persistent vaginal cornification, and serum progesterone was lower in adult animals in the high-dose genistein group compared to controls. In the low-dose genistein group, females had vaginal cytology consistent with normal cycling. High-dose females had lower body weights than control or low-dose genistein females from PND 57 until the end of the experiment. [The difference estimated from a graph was ~15 g.] There were no treatment effects on body weight or reproductive organ weights in males. [Effects seen at the highest dose of genistein (increased uterine weight at PND 22, accelerated vaginal opening, vaginal smears with persistent cornification, decreased body weight at Week 7, and decrease progesterone levels) were consistent with an estrogenic response.]
In the reproductive neuroendocrine study, absolute and relative uterine weights were increased by diethylstilbestrol and by the high dose of genistein. [Mean± SD uterine weights estimated from figure: control 20± 5 mg (n = 3); low-dose genistein 20± 5 mg (n = 6); high-dose genistein 40± 10 mg (n = 5); diethylstilbestrol 120± 10 mg (n = 5). The figure uses g; the Expert Panel assumes that mg was meant.] Relative testis weight was said to be reduced by diethylstilbestrol but not by genistein. [Data were not shown; absolute testis weights were shown and did not appear to have been affected by any treatment.] Neither basal nor GnRH-stimulated LH concentrations on PND 42–54 were affected by lactation-period treatment [data not shown]. The volume of the SDN-POA was greater in control males than control females. The low dose of genistein had no effect on SDN-POA volume in males or females. The high dose of genistein and diethylstilbestrol increased SDN-POA volume in females.
The authors concluded that the highest dose of genistein, designed to be equivalent to 40 mg/kg bw/day, produced estrogenic effects in terms of uterine weight and produced persistent estrus, probably through alterations in hypothalamic development with prevention of the LH surge. The low dose of 4 mg/kg bw/day, which they believed represented anticipated exposures in infants consuming soy-based formulas, was without detectable effects.
Strengths/Weaknesses
A strength of this study is that the authors conducted a relatively thorough assessment of reproductive function in male and female rats following neonatal (PND 1–21) exposure to genistein. Genistein was 98.3% pure. Two dose levels were used, which allows some assessment of dose–response relationships. Sample sizes, which varied with endpoints measured, were sufficient, although it was not clear that the authors controlled for litter effects. The low-dose level (4 mg/kg bw/day) was selected because it is the estimated exposure level for infants fed soy formula. The authors included a sophisticated approach to assess toxicokinetics of genistein to select the best dosing paradigm. In addition, plasma concentrations of genistein and its metabolites were measured after both s.c. and oral dosing. The authors used these data to determine approximately equivalent s.c. dose levels that would achieve similar genistein AUCs (bioequivalent doses) as orally administered doses of 4 and 40 mg/kg/day, which allowed the authors to use s.c. administration of genistein in neonatal pups on PND 1–6 because it is technically difficult to gavage this number of pups at such a young age; however, it is a weakness that the results were based on the kinetics of a single dose of genistein administered s.c. or by oral gavage on PND 7. It is also unfortunate that there was a dosing error for high-dose pups on PND 1–6. While it is not clear that the authors controlled for litter effects at all time points, data collected on PND 22 were from 1 pup/sex/litter; thus, the increase in uterine weights observed on PND 22 was controlled for litter effects. Diethylstilbestrol was used as a positive control for some endpoints. Statistical analyses were appropriate for endpoints and sample sizes, although there was no indication that the litter was the unit of analysis. A weakness was that there was no indication whether dose solutions were analyzed to verify dose level, stability, or homogeneity. The diet R&M No. 3 contained ~100–110 ppm genistein (Special Diet Services Ltd., Witham, Essex). While the authors measured time of testes descent, results for this measure were not reported. It was unclear why blood hormone concentrations and uterine weights on PND 22 were analyzed with both the pup and the litter as the unit of analysis; the litter is the correct unit. Anogenital distance and relative anogenital distance results were not shown. In the HPLC data, it was interesting that the retention times for Metabolites IV and I did not change between the plasma and milk matrices (19 and 27 min, respectively), whereas the retention time for Metabolite II shifted from 23 to 22 min (Metabolite III had a retention time of 22 min, raising the question of a possible typographic error for retention time or metabolite number). In study Figures 7 and 11, the y-axis scale was apparently misstated and should have read weight in mg (not g). There was a large difference in the SDN-POA area in the two studies illustrated in study Figure 12 (i.e., area in control males was ~0.07 mm3 in Study 1 compared to ~0.021 mm3 in Study 2). The relevance of genistein exposure in rats during the neonatal period (PND 1–21) to human hypothalamic development in infants fed soy formula was not discussed.
Utility (Adequacy) for CERHR Evaluation Process
This study is useful in the evaluation process.
Fisher et al. (1999), from the UK Medical Research Council, examined the effects of genistein and other suspected estrogenic compounds on development of testicular excurrent ducts in Wistar rats. The primary focus of the study was to establish dose–response relationships for diethylstilbestrol. Neonatal male rats, the mothers of which were fed a soy-free diet during gestation and lactation, were injected s.c. with genistein [purity not specified] 4 mg/kg bw/day in phosphate-buffered saline plus gelatin. [Days of treatment were not specified, but the report states that PND 10 and 18 occurred during the dosing period.] Dose selection was based on the estimated intake of isoflavonoids by infants fed soy formula. Controls were fed soy-free diets and were treated with vehicle (soy-free control). A second control group was injected with the corn oil vehicle used for administration of the other compounds examined (vehicle control). Rats were killed at 10, 18, 25, or 75 days of age. Testes and epididymides were removed and fixed in Bouin fluid. Rats that were 35 days old or older were perfused with 0.9% saline and 0.01% heparin prior to removal and fixation of testes. Testes were weighed, embedded in paraffin, and sectioned. Immunostaining to detect aquaporin-1, a protein the expression of which was reduced after diethylstilbestrol treatment, was followed by staining with hematoxylin and eosin for histologic analysis. Data for testicular weight and epithelial cell height were analyzed by ANOVA. Because effects on PND 18 did not differ significantly between the soy-free and vehicle control group, except for testicular weight, the 2 control groups were pooled for analyses conducted after PND 18. [The number of rats treated with genistein was not specified, but for most endpoints, 3–14 genistein-treated rats were examined per group and time period.]
On PND 18, no significant difference in testicular weights was detected between the genistein group and soy-free control group but testicular weights were significantly higher in the genistein compared to vehicle control group. Testicular weights in the soy-free control group were significantly higher compared to the vehicle control group. In the genistein group, no significant effects on testicular weights were noted on PND 25, but testicular weights were marginally but significantly higher than controls on PND 75. Genistein treatment had no detected effect on aquaporin-1 immuno expression or on efferent duct or rete testis morphology, as was noted for the control group, on all days examined (PND 10, 18, 25, and 75). A small but significant reduction in epithelial efferent duct cell height was observed in the genistein group on PND 18 but no effects were seen on PND 25 or 75. Effects similar to those observed in the genistein group were seen in groups treated with octylphenol and bisphenol A. Treatment of rats with diethylstilbestrol 0.0037–0.37 mg/kg bw/day resulted in dose-dependently reduced testicular weight, distension of the rete testis and efferent ducts, reduction of efferent duct epithelial cell height, or decreased expression of aquaporin-1. Effects were most pronounced on PND 18 and 25; some effects became less pronounced with time, while others persisted into adulthood. Similar effects were noted in animals treated with ethinyl estradiol and tamoxifen. Treatment with a GnRH antagonist did not affect most endpoints, with the exception of permanent reduction in testis weight and transient reduction in efferent duct epithelial cell height, suggesting that estrogenic compounds cause direct, as opposed to indirect, effects through hormonal changes. The study authors noted that magnitude and duration of adverse effects were comparable to estrogenic potencies reported in in vitro assays.
Strengths/Weaknesses
A strength of this study is that genistein was administered at a realistic dose level (4 mg/kg bw/day), a level reported to be equivalent to total phytoestrogen intake by human infants consuming soy formula; however, the s.c. route is not relevant to human exposure. Appropriate negative controls were used for the immunocytochemistry experiments, and immunostaining was evaluated in at least three animals per age and treatment on at least three occasions. A weakness of this study is that Wistar rats were bred in the authors’ own breeding colony (not commercially available). The purity of genistein was not given, and dose solutions were not analyzed for concentration, stability, or homogeneity. The authors used only one dose level of genistein, so dose–response relationships could not be evaluated. Pup blood levels of genistein were not reported. There were no details on how pups were assigned to treatment groups, and there was no indication that the authors controlled for litter effects. The authors did not provide any information on body weights during the study. The exact dose period used for the genistein exposure was not specified, although the text indicated that the pups were still on treatment on PND 10 and 18. The authors state “As the soy-free control data did not differ significantly from control animals in any parameters assessed at Day 18 (except testis weight), for simplicity, at all other ages assessed, the data from soy-free control animals were pooled with ‘normal’ control data.” Given that testis weight differed on PND 18, the validity of this assumption seems questionable. It is possible that soy-free control data differed from “normal controls” at other time points. Figure 1 of the study showed a significant difference in testis weight for genistein on Day 18 and stated that the genistein group was compare to the soy-free control group; however, the text for Day 18 stated that “the testis weights of genistein treated and soy-free controls did not differ significantly.” Per the authors’ admission, rete testis morphology was difficult to assess in an objective and quantifiable manner, particularly given that cross-sections from identical regions of the tissue must be assessed. The authors stated that only gross changes could be detected easily. It seemed unlikely that cross-sections of the rete testis (planes of section) were the same in controls and treated samples and it was unclear if cross-section differences may have affected the results. Sample sizes varied from 3–20 rats/group/time point, and no explanation was given for this large variability in sample sizes. Statistics were conducted by ANOVA, comparing control and treated groups at each age. It appears as if the authors conducted multiple comparisons without adequate protection against Type I error.
Utility (Adequacy) for CERHR Evaluation Process
This study is not useful in the evaluation process.
Atanassova et al. (2000), supported by the European Center for the Ecotoxicology of Chemicals and by AstraZeneca, examined the effects of neonatal exposure to weak and strong estrogens on pubertal spermatogenesis and long-term changes in the reproductive system of male rats. As part of this study, adult female Wistar rats were fed standard diets (15.5% soy meal) or soy-free diets (soy substituted by fishmeal and cereal content increased from 64% to 78%) for 3 weeks prior to mating and through mating, pregnancy, and lactation. Male offspring of rats fed soy-free diets were maintained on soy-free diets from weaning until termination. An unspecified number of males born to mothers on the soy-free diets received s.c. injections of genistein [purity not specified] 4 mg/kg bw/day in phosphate-buffered saline vehicle on PND 2–18. The dose was selected to represent exposure levels of total phytoestrogens in 4-month-old infants fed soy formula. A group of soy-free controls were treated with vehicle. Males from the soy-free control group were compared to males in the standard diet control group. Male rats treated with genistein were compared to soy-free controls. [Total number of rats treated was not stated, but 7–14 rats/group were evaluated.] On PND 18 and 25, rats were killed and testes were fixed in Bouin fluid. Testicular cell numbers and seminiferous tubule lumen formation were determined by standard point counting of cell nuclei. Apoptosis was assessed by DNA fragmentation detected by in situ DNA 3′-end labeling. Spermatocyte nuclear volume as a fraction of Sertoli cell nuclear volume was calculated as “an index of spermatogenic efficiency.” Plasma FSH and inhibin B were measured by RIA and enzyme-linked immunosorbent assay (ELISA) methods, respectively. In addition, mating and fertility were examined in adult rats (80–90 days old) by placing them in a cage with an unexposed female for 7 days. Statistical significance was determined by ANOVA.
Results and statistical significance for endpoints characterizing pubertal spermatogenesis in 18- and 25-day-old rats are listed in Table 54. The study authors noted that the increase in spermatocyte nuclear volume per Sertoli cell nuclear volume in rats fed soy-free compared to standard diets on PND 18 suggested that dietary soy retarded pubertal spermatogenesis. Administration of genistein to rats reared on soy-free diets reversed the increase in spermatocyte nuclear volume per Sertoli cell nuclear volume and also slowed lumen formation, reduced FSH levels, and increased the germ cell apoptotic index compared to soy-free diet controls. For parameters also assessed on PND 25, the only significant effect that remained was the increase in spermatocyte nuclear volume per Sertoli cell nuclear volume in soy-free compared to standard diet controls. Testis weights in adult rats (90–100 days old) from the soy-free group were significantly higher (8%) compared to rats in the standard diet group, and testis weight of rats in the genistein group were similar to those in the soy-free group. Two of nine males in the genistein group did not mate, one of the matings did not result in pregnancy, and all pups of one litter died shortly after birth; statistical significance was not attained. Animals in the soy-free control group were not mated.
Table 54.
Effects of Neonatal Exposures to Soy-Free Diet or Genistein on the Reproductive System of Male Rats
| Comparison
|
||
|---|---|---|
| Effect | Soy-free control compared to standard diet control | Genistein 4 mg/kg bw/day (soy-free diet) compared to soy-free control |
| Germ cell apoptotic index, PND 18 | ↔ | ↑ |
| Germ cell apoptotic index, PND 25 | ↔ | ↔ |
| Seminiferous tubule lumen formation, PND 18 | ↔ | ↓ |
| Plasma inhibin B, PND 18 | ↔ | ↔ |
| Sertoli cell nuclear volume/testis, PND 18 | ↑ | ↔ |
| Plasma FSH, PND 18 | ↔ | ↓ |
| Plasma FSH, PND 25 | ↔ | ↔ |
| Spermatocyte/Sertoli cell nuclear volume, PND 18 | ↑ | ↓ |
| Spermatocyte/Sertoli cell nuclear volume, PND 25 | ↑ | ↔ |
↑,↓ Statistically significant increase, decrease; ↔ no effect.
From Atanassova et al. (2000).
In a larger study reported in this paper, body weight, testis weight, and plasma FSH levels were compared in 24 litters from soy-free groups and 29 litters from standard diet groups. Male rats were evaluated at 90–95 days of age. Rats in the soy-free group had significantly higher body weights (5.7%) and testis weights (3.6%) and significantly reduced plasma FSH levels (11.1%). [Relative testis weights were not reported.]
The study authors noted that effects of genistein exposure were similar to those seen in rats treated with 1 μg diethylstilbestrol, but unlike diethylstilbestrol, genistein was not shown to affect all facets of pubertal spermatogenesis. For example, genistein only mildly affected testicular weight and increased Sertoli cell nuclear volume per testis. Low doses of diethylstilbestrol (≤1 μg) and high doses of weak environmental estrogens (octylphenol at 0.5 mg and bisphenol A at 2 mg) were found to advance spermatogenic development. The study authors concluded that “the presence or absence of soy or genistein in the diet has significant short-term (pubertal spermatogenesis) and long-term (body weight, testis size, FSH levels, and possibly mating) effects on males.”
Strengths/Weakness
A strength of this study is that the authors took several important steps to control for litter effects. They repeated each experiment at least twice and considered only reproducible effects as treatment-related, they pooled data from different experiments and from the several control groups to determine the spectrum of changes due to chance (historical control data), and in the statistical evaluation, they used pooled variance for each parameter of the study as a whole to minimize false positive findings. Samples sizes appeared to be sufficient. Genistein-treated animals and their negative control group were maintained on a soy-free diet, while a concurrent control given the standard diet with 15.5% soy meal was also included. Pups were treated with genistein on PND 2–18, which coincided with the neonatal period. Genistein was administered at a realistic concentration (4 mg/kg bw/day), a level reported to be equivalent to total phytoestrogen intake by human infants consuming soy formula. The authors referenced previous studies where methods were validated. Baseline FSH levels were determined in hypophysectomized rats and inhibin was confirmed to be undetectable in castrated adult male rat plasma. By monitoring multiple time points, the authors were able to evaluate long term effects of neonatal genistein exposure. A weakness of this study is that Wistar rats were bred in the authors’ own breeding colony (not commercially available). The purity of genistein was not given, and dose solutions were not analyzed for concentration, stability, or homogeneity. While using 2 different concentrations of genistein (standard diet and 4 mg/kg bw/day s.c.), the dose of genistein consumed in the diet was not specified, and there were differences in route of exposure; thus, dose–response relationships were difficult to evaluate. Pup blood levels of genistein were not reported. The authors provided minimal information on body weights throughout the study. Mating and fertility experiments could have been performed more effectively. Samples of testicular cross-sections varied from 5 to 14 rats/group with no explanation for this variability in sample sizes. Statistics were conducted by ANOVA comparing control and treated groups at each age. It appears as if the authors conducted multiple comparisons without adequate protection against Type I error. It is difficult to discern whether the different testicular effects between male rats on the standard diet and the soy-free diet were related to the difference in soy content or other nutritional differences between the diets. Odum et al. (2001) reported that different rodent diets containing varying amounts of phytoestrogens can have centrally mediated effects on rodent sexual development, rather than affecting peripheral ERs. Effects from these diets are likely due to nutritional differences between the diets. The soy-free diet had numerous changes compared with the standard diet (i.e., soy meal in the diet was substituted by fish meal; maize gluten was added, and the overall cereal content was increased to 78% compared with 64% in the standard diet).
Utility (Adequacy) for the CERHR Evaluative Process
This study is not useful in the evaluation process.
Williams et al. (2001), supported by the European Centre for the Ecotoxicology of Chemicals, AstraZeneca, and the European Union, evaluated the effect of estrogenic chemicals on sex steroid receptors in rat seminal vesicles. Neonatal Wistar rats (n = 11–18; birth = PND 1) were treated with s.c. injections of corn oil or genistein [purity not specified] 4 mg/kg bw/day on PND 2–18 [inferred from reference to Atanassova et al. (2000)]. On PND 18, seminal vesicles were dissected and fixed in Bouin fluid or frozen. Immunohistochemistry was used to evaluate ERα, ERβ, androgen receptor, and progesterone receptor. Western blot analysis was used to confirm changes in receptor levels in the seminal vesicles of some animals. [It is not clear whether genistein-treated animals were evaluated by Western blot; statistical methods were not discussed and may not have been used.] No genistein-associated changes in seminal vesicle histology or hormone receptor levels were seen. The authors concluded that in spite of using high doses in this study, “weak environmental estrogens,” including genistein, did not produce changes in hormone receptors or seminal vesicle structure. The lack of effectiveness of these weak estrogens was attributed to lack of suppression of androgen receptor. By contrast, the stronger estrogens diethylstilbestrol and ethinyl estradiol suppressed androgen receptor, induced estrogen and progesterone receptor, and reduced epithelial branching in the seminal vesicles.
Strengths/Weaknesses
A strength of this study is that genistein was used at realistic human exposure levels. Group sizes were sufficient (seminal vesicles collected from 11–15 animals/treatment group), although there was no indication that the authors controlled for litter effects. Experimental controls were adequate. Specificity of the antibodies used for immunocytochemistry and Western blots was confirmed. Immunolocalization studies were repeated on three to five occasions using sections from at least three animals to ensure reproducibility. Scores for immunostaining were based on at least six animals in two separate experiments. Diethylstilbestrol served as a positive control (high dose) and exhibited a dose–response relationship (lower doses) against which immunostaining could be scored. A weakness of this study is the sparse experimental detail. Wistar rats were bred in the authors’ own breeding colony (not commercially available). There was no mention that a soy-free diet was used in these studies. The purity of genistein was not given, and dose solutions were not analyzed for concentration, stability, or homogeneity. Because the authors used only one dose level of genistein, dose–response relationships could not be evaluated. Pup blood levels of genistein were not reported. There were no details on how pups were assigned to treatment groups, and there was no indication that the authors controlled for litter effects. The authors provided no information on body weights. Although immunocytochemistry changes in seminal vesicle steroid receptors were confirmed by Western blot for selected chemicals, data on genistein were not presented. There was no information about statistical analyses.
Utility (Adequacy) for CERHR Evaluation Process
This study is not useful in the evaluation process.
3.2.1.6 Fish
Kiparissis et al. (2003), supported by the Natural Sciences and Engineering Council of Canada, Environment Canada, and Health Canada, evaluated reproductive development in Japanese medaka exposed to genistein for about 100 days after hatching. Genistein in acetone was added to the water at nominal concentrations of 0, 1, 10, 100, or 1000 μg/L (n = 31–43 females, 17–30 males per treatment group [purity of genistein and achieved concentrations not given]. At termination, fish >17 mm in length were sexed by external examination, following which hematoxylin and eosin-stained gonadal sections were evaluated by light microscopy. Differences between groups were evaluated by χ2 test. There was no detected effect of genistein on sex ratio, and ovotestes were identified in only two fish in the 1000 μg/L group. There was a concentration-dependent increase in testicular fibrosis and in testes with low sperm density [not otherwise defined]. Genistein retarded oocyte maturation beginning at the 10 μg/L concentration, and there was a concentration-dependent increase in oocyte atresia in genistein-exposed females. External and gonadal sex were concordant in 56–61% of genistein-exposed fish compared to 96–100% of control fish. The authors concluded that genistein altered gonadal development and secondary sex characteristics in medaka. They noted that some of the alterations could be attributed to estrogenic activity, but that non-receptor mediated processes were also likely to have been affected by genistein. Inhibition of steroidogenic enzymes, noted in other papers, was offered as a possible mechanism of genistein effects on reproductive development.
Strengths/Weaknesses
A strength of this study is that multiple dose levels of genistein were used, allowing for an evaluation of dose–response relationships. Evaluation of the medaka included both visible secondary sex characteristics (shape of the urogenital papilla, dorsal fin, and papillary processes on the anal fin) and internal histologic changes in fish gonads (testes, ovaries). Sample sizes were sufficient for most endpoints. A weakness of this study is that it looked at the effects of genistein on teleosts. It is difficult to extrapolate these data to humans given that the routes of exposure (waterborne vs. oral) are so different. Furthermore, dose levels, sensitivity, and pharmacokinetics likely differ across species. Genistein levels in medaka blood were not measured. The purity of the genistein used in these experiments was not specified. There were no analytical data to confirm genistein concentration, homogeneity, or stability. A static test system was used without presenting data to substantiate consistent exposure with the system (water in the test system was renewed 3 times/week, but there were no data on how stable these exposures were). A lower size limit on medaka was specified (>17 mm), but the size range (upper limit) and variance across the treatment groups were not specified. There were only six fish examined for stages of spermatogenesis at the high dose of genistein.
Utility (Adequacy) for CERHR Evaluation Process
This study is not useful in the evaluation process.
3.2.2 Mammary development/carcinogenesis
The effects of genistein on mammary gland development or carcinogenesis were studied in rodents exposed during prenatal or postnatal development. The studies are presented in order of mouse before rat, dietary exposures before parenteral exposures, and exposures beginning during the prenatal before exposures during the postnatal period.
Fielden et al. (2002), in a study funded by the EPA, examined the effects of gestational and lactational genistein exposure on mammary gland development. C57BL/6 female mice were mated with DBA/2 male mice to produce B6D2F1 offspring. The C57BL/6 mice were fed AIN-76A, a feed with undetectable levels of isoflavones, throughout pregnancy and lactation. Mice (a minimum of 9/group) were gavaged with genistein (98% purity) in corn oil 0, 0.1, 0.5, 2.5, or 10 mg/kg bw/day on GD 12 through PND 20, excluding the day of parturition (PND 0). The lower two doses represented human dietary exposures, while the highest two doses were selected to replicate potentially higher exposures resulting from supplement intake. Pups were weaned on PND 21. Litter size and weight were evaluated and anogenital distance was measured on PND 7 and 21. Mammary gland development was examined in females from five to nine litters per group on PND 49. [It was not clear if all females from each litter were examined.] The selection of the time point for mammary gland evaluation was based upon the results of a preliminary study to assess mammary gland development in untreated mice. Effects were compared to those in mice exposed to diethylstilbestrol 0.1–10 μg/kg bw in a separate experiment with similar design. The litter was considered the experimental unit in statistical analyses that included ANOVA, ANCOVA, Dunnett method, Tukey method, and Kruskal-Wallis test.
No effects of genistein treatment on body weight or anogenital distance were detected. Genistein treatment had no detected effect on percent mammary growth, mammary length, number of terminal end buds (a measure of proliferation), or number of alveolar buds (a measure of differentiation). In contrast, treatment with diethylstilbestrol 10 μg/kg bw increased percent mammary growth. Diethylstilbestrol was also reported to decrease the number of terminal end buds, but the effect was only marginally significant. The study authors concluded that gestational and lactational exposure to genistein at levels equivalent to or higher than that encountered by populations eating soy-rich diets does not affect mammary morphology in pubertal female mice.
Strengths/Weaknesses
A strength of this study is that pregnant dams were treated orally with genistein at dose levels comparable to human exposure (0.1 and 0.5 mg/kg bw/day) and higher levels to simulate dietary supplements. The use of multiple dose levels allowed for an assessment of dose–response relationships. AIN-76 diet with undetectable levels of genistein, daidzein, and glycitein was used in these experiments. Genistein was >98% pure. The authors described extensive characterization work aimed at delineating baseline mammary gland development in the mouse strain used and determined the optimum time point for assessing mammary gland development. Multiple time points (3, 4, 5, 7, and 10 weeks of age) were assessed. The authors controlled for litter effect by using five to nine animals in each age group, with all animals originating from different litters. For genistein experiments, gavage doses were adjusted daily to dam body weights. Anogenital distance measurements were made by a single observer to limit inter-experimenter variability. The same mammary gland in each animal (fourth abdominal gland on the right side) was used for each assessment. All mammary whole mounts were examined blind to treatment group by two people and averaged. The litter was used as the experimental unit. Statistical analyses were appropriate. The authors identified and included covariate terms that influenced endpoint measurements to account for sources of variability. They also adjusted for multiple comparisons to protect the α level at 0.05. Genistein results were compared with diethylstilbestrol-induced effects on mouse mammary gland development (evaluated in a separate study, but reported here). It is a weakness that the diethylstilbestrol and genistein experiments were not run concurrently, which may have contributed to difficulty in interpreting alveolar bud development in 7-week-old control mice. Dam blood levels of genistein were not measured in this study. Neither lactational transfer of genistein nor pup blood genistein levels were measured, making it difficult to assess the exposure to pups during the lactational period. The authors did not discuss how the critical windows for mammary gland development compare between mice and humans.
Utility (Adequacy) for CERHR Evaluation Process
This study is useful in the evaluation process.
In offspring of mice that received 0.5 or 10 mg/kg bw/day genistein by s.c. injection for 4 days beginning on GD 15, mammary alveolar differentiation was more advanced in 2/3 high-dose mice with corpora lutea at 4 weeks of age (Nikaido et al., 2004); there were no detected differences in mammary development from 8 to 16 weeks of age. More details of this study are included in Section 3.2.1.1.
No effect on mammary gland development was observed in mice s.c. injected with 10 mg/kg bw/day genistein for 4 days, beginning at 15 days of age (Nikaido et al., 2005). More details of this study are presented in Section 3.2.1.2.
Hilakivi-Clarke et al. (1998), supported by the American Cancer Society and the Public Health Service, evaluated the effect of prenatal exposure to genistein on mammary gland development in mice. Pregnant outbred CD-1 mice were obtained on GD 7 and injected on GD 15–20 with genistein 20 μg/day. [The days of treatment were indicated only in the abstract; injection route was not specified. Number of treated dams and dam weights were not given; assuming a dam weight of 25–30 g, this genistein dose is about 0.7–0.8 mg/kg bw/day. Neither plug day nor day of delivery was specified.] Other groups of pregnant mice were treated with 20 ng estradiol benzoate, 2 μg zearalenone, 2 μg tamoxifen, or oil vehicle. Within 24 hr of birth, males were removed and litters were constituted of two or three female pups born to a given dam plus six or seven female pups fostered in from other dams in the same treatment group [final litter size not indicated but presumably 9]. Fifteen to thirty offspring/dose group were examined for eyelid opening beginning on PND 12, and 14–32 offspring/dose group were weighed on PND 25, 35, and 46. Four or five pups/dose group/time point were killed on PND 25, 35, or 46 for measurement of serum 17β-estradiol and evaluation of mammary gland morphology by dissecting microscope examination of carmine aluminum-stained whole mounts. Day of vaginal opening was assessed in 10–25 pups/dose group. At 2 months of age, six offspring/dose group were monitored by daily vaginal smear for estrous cycling. Statistical comparisons were performed using ANOVA with post-hoc Fisher least significance test or nonparametric tests for proportions. [Litter of origin appears not to have been tracked or considered in the analysis in spite of the dam having been the treatment unit.]
There were no detected effects of treatment on number of offspring born or PND 1 body weights [presumably pup body weight; data were not shown]. Genistein- and estradiol benzoate-exposed pups had significantly increased body weights on PND 25 compared to control pups. [A difference of 4 g was estimated from a graph.] Eye opening was accelerated in the estradiol benzoate-exposed group and delayed in the genistein-exposed group. Vaginal opening was accelerated in offspring exposed to estradiol benzoate, genistein, or tamoxifen. Serum 17β-estradiol measurements on PND 25 and 35 were not significantly altered in any treatment group [mean± SEM 17β-estradiol concentrations on PND 25 estimated from a graph were 30± 10 pg/mL in control offspring, and 60± 14 pg/mL in genistein-exposed offspring, n = 4 or 5/group, P≈0.1, Student t-test by CERHR]. No genistein-associated difference in estrous cyclicity was reported compared to controls. [The Expert Panel noted that all 6 control animals had 4–5 day cycles compared to 2/6 genistein-exposed animals, P = 0.06, Fisher exact test by CERHR.] The epithelial area of the mammary glands from genistein- and estradiol benzoate-exposed offspring was larger than in the control group on PND 35 but not on PND 25 or 46. The density of terminal end buds in the mammary glands was increased in the genistein-exposed group on PND 35 and 46 and in estradiol benzoate-exposed offspring on PND 46. There was no difference in differentiation of breast tissue, assessed using the density of terminal end buds and lobuloalveolar units, between genistein-exposed and control offspring. The authors concluded, “Maternal exposure to genistein during pregnancy, at a dose comparable to that consumed by Oriental women, has profound effects on mammary gland of female mouse offspring.” They further concluded that genistein effects were similar to those of estradiol benzoate.
Strengths/Weaknesses
A strength of this study is that effects of genistein on mammary morphology were compared with effects observed in previous experiments with estradiol. The authors reported that the genistein dose level was physiologically relevant. Multiple time points were assessed. The fourth abdominal gland was used for mammary gland assessments. To account for sources of variability, statistical analyses included covariate terms that influenced endpoint measurements. When collecting blood for measurement of serum 17β-estradiol levels, estrous stage was controlled (blood was collected when animals were in estrus). Time (presumably age of animals) and treatment were used as variables (2-way ANOVA) for the analysis of mammary gland structures. A weakness of this study is injection route was not specified. The purity of genistein was not given, and dose solutions were not analyzed for concentration, stability, or homogeneity. The authors did not mention the use of phytoestrogen-free diet, suggesting the possibility of additional genistein exposure. Because the authors used only one dose level of genistein, dose–response relationships could not be evaluated. Maternal/fetal blood levels of genistein were not reported. There were no details on how dams were assigned to treatment groups or how many dams were treated. The days on which the animals were sperm-positive (GD 0 or 1) or delivered offspring (PND 0 or 1) were not specified. There was no indication that the authors controlled for litter effects. While they cross-fostered pups into different litters (two to three pups stayed with the biologic mother), this cross-fostering would only control for environmental factors such as maternal caregiving. There was no evidence that the authors considered litter of origin when assigning pups to different endpoints. With four to six litters per group, the n value would be 4–6 for each endpoint. The authors do not specify what kind of oil was used as a vehicle. They did not state whether mammary whole mounts were examined blind to treatment group. Body weight was not measured and therefore was not included as a covariate when analyzing maturational landmarks (eye opening and vaginal opening). In some cases (e.g., serum 17β-estradiol measurements, estrous cycle evaluations), sample sizes were too small.
Utility (Adequacy) for CERHR Evaluation Process
This study is not useful in the evaluation process.
Fritz et al. (1998), funded by NIH, explored the possible role of genistein in protection from mammary tumors. Seven-week-old female Sprague-Dawley rats were treated with dietary genistein (98.5% pure, with 1.5% methanol) at 0, 25, or 250 mg/kg diet [ppm; doses would likely be ~0, 2.2, and 22 mg/kg bw/day according to information presented in Fritz et al. (2002b)]. The basal diet was AIN-76A, a phytoestrogen-free rodent feed. At 9 weeks of age, females were bred 2:1 with males that had been placed on the same diet as the females at the time of mating. Offspring were sexed at birth. Litters were standardized to 10 pups with four to six females. Offspring were weaned on PND 21 and given the untreated AIN-76A diet. On PND 50, female offspring were given dimethyl benzanthracene 80 mg/kg bw by gavage in order to induce mammary tumors. Animals were killed when palpable tumors reached 2.5 cm in diameter, when the animals became moribund, or on PND 200. Whole mounts of mammary glands were prepared from females on PND 21 and 50. [The source and number of these animals were not specified.] Mammary gland size and numbers of terminal end buds, terminal ducts, and lobules were determined. Uterine weights were obtained. Two hours before death, animals were injected with bromodeoxyuridine for labeling of proliferating cells in the mammary glands. [The source and number of these animals were not specified, but they were at PND 21 and 50 and may have been the same animals used for the whole mounts.] Serum genistein concentrations were measured in PND 21 offspring. [The source and number of these animals were not specified.] Serum testosterone concentrations were said to have been determined by RIA [no results presented], and estrous phase was evaluated on PND 41–50. Total and free genistein levels were measured analytically in dam serum and milk at 7 days postpartum (free genistein in milk analyzed for high-dose dams only). Milk also was collected on PND 21, although these analytical results were not shown. Total and free genistein concentrations were measured in pup stomach milk (7-day-old pups only) and in pup serum and mammary glands at 7 and 21 days of age. The number of tumors per animal and time of tumor appearance were analyzed using a Poisson and Weibull distribution. ANOVA was used for other comparisons. [Apparently none of the analyses considered litter of origin.]
Genistein concentrations in mammary glands and milk are presented in Section 2. The number of litters produced by females in each of the treatment groups was expressed as follows: control diet 35/40; 25 ppm genistein 25/29; 250 ppm genistein 44/57. [The Expert Panel assumes these data represent number of dams producing litters/number mated; there is no significant difference between these proportions.] No significant differences were detected between groups in number of male or female offspring, anogenital distance, or time to testicular descent or vaginal opening. Among female offspring, there were no detected differences among treatment groups with respect to body weight, uterine weight, or mammary gland surface area at either PND 21 or 50, and no significant differences in time spent in each phase of the estrous cycle, number of primordial follicles, or number of corpora lutea in the ovaries. Histologic evaluation of the vagina, uterus, and ovaries showed no alterations on PND 50 or 100.
Genistein-exposed females developed fewer tumors per animal (control 8.8± 0.8 tumors/animal; genistein 25 ppm 7.1± 0.8 tumors/animal; genistein 250 ppm 4.4± 0.6 tumors/animal). [The error was not defined; SEM was used elsewhere in the paper for other data. The number of animals or number of litters involved was not given.] There was no detected alteration in latency to onset of tumor palpability. On PND 21 and 50, there were fewer terminal end buds in the group exposed to genistein 250 ppm. Type I lobules (defined as having 5–10 alveolar buds) were reduced in number by both genistein exposure levels on PND 50. There was no detected effect of genistein on numbers of Type II lobules (10–20 alveolar buds) or on DNA labeling indices of mammary end buds or terminal ducts.
The authors concluded that neonatal exposure to genistein protected against mammary cancer in rats. Although they noted that the DNA labeling index was not altered by genistein, they calculated that multiplying the labeling index by the number of proliferating structures (e.g., end buds) showed a genistein-associated decrease in the total amount of cell proliferation in tissues at risk for carcinogenesis.
Strengths/Weaknesses
A strength of these experiments is that phytoestrogen-free AIN-76 diet was used. Genistein was 98.5% pure. According to data in another publication by this author (Fritz et al., 2002b), exposure levels are relevant to human exposures, as are the oral route of exposure and exposure during the neonatal period. Mammary morphology was assessed at two time points (21 and 50 days of age). Histologic examinations of tumors and estrous cycles were conducted blind to treatment group. Total and free genistein levels were measured analytically in dam serum and milk at 7 days postpartum. Total and free genistein concentrations also were measured in pup stomach milk (7-day-old pups only), and in pup serum and mammary glands 7 and 21 days after delivery. The use of multiple dose levels allowed for an assessment of dose–response relationships. Statistical analyses for tumor data were appropriate, although the influence of litter of origin was never tested for tumor data or other endpoints. A weakness of this study is that diets were not analyzed for concentration, stability, or homogeneity. There was no indication that the authors controlled for litter effects by selecting pups from different litters for each endpoint or controlling for litter of origin during data analyses. It was difficult to determine the sample size in many of the experiments. Serum testosterone data were not presented. Tumor incidence (number or proportion of animals developing tumors) was not given. The dimethyl benzanthracene dose level was relatively high (80 mg/kg bw); thus, this experiment was apparently designed to detect only decreases in tumor incidence. Blood genistein concentrations in neonatal rats were considerably lower than blood genistein concentrations reported for infants consuming soy formula.
Utility (Adequacy) for CERHR Evaluation Process
This study is somewhat useful, particularly the toxicokinetics data involving milk transfer and pup exposures.
You et al. (2002b), supported by CIIT, evaluated the developmental effects on the rat mammary gland of dietary genistein alone and in combination with methoxychlor, a pesticide with the estrogenic metabolite HPTE. [The animals in this study are a subset of the animals reported in You et al. (2002a) (L. You, personal communication, February 2, 2004).] Time-mated Sprague-Dawley rats were obtained on GD 0 (the day sperm were found in the vaginal smear). Animals were randomized by weight to one of six groups (8 animals/group). A control group was given untreated feed (a soy- and alfalfa-free diet). Treated animals were given the same feed, with the addition of genistein (>98% pure), methoxychlor (~95% pure), or both. The five diet combinations were: 800 ppm methoxychlor; 300 ppm genistein; 800 ppm genistein; 300 ppm genistein +800 ppm methoxychlor; and 800 ppm genistein+ 800 ppm methoxychlor. The 300 ppm dose of genistein was selected to approximate the amount of genistein in the NIH-07 rodent diet. The 800 ppm doses of genistein and methoxychlor were both based on previous studies showing endocrine effects at these exposure levels. [For information on feed consumption, body weight, and estimated genistein ingestion, see the discussion of You et al. (2002a) in Section 3.2.1.4.]
Dams were maintained on their assigned diets during pregnancy and lactation. [No statement was made about culling. The authors note that pups would likely have ingested treated feed during the last part of the lactation period.] On PND 22, pups were killed. One pup/sex/litter had inguinal mammary glands removed for evaluation. In four animals per treatment group [probably 4/sex/group based on the study Results section], one gland was used for whole mount preparation and the other was used for tissue section. Whole mount mammary glands were evaluated using computerized image analysis for total gland area and the number of terminal end buds and lateral buds. Immunohistochemistry studies were performed on fixed mammary gland sections from male offspring using antibody to insulin-like growth factor (IGF)-1 receptor-β, ERα, progesterone receptor, and PCNA. PCNA-stained slides were used to derive a labeling index, which was the ratio of actively dividing cells to total cells in the section. Trunk blood was collected for measurement of IGF-1 and prolactin by RIA. [The results section indicates three or four animals per group.] Statistical analysis was by 3-way ANOVA (sex, methoxychlor, and genistein) for whole mount data and 2-way ANOVA (methoxychlor and genistein) for serum hormone measurements and immunohistochemistry (which were only performed on males). Post-hoc t-testing was used when ANOVA suggested an effect of genistein.
Offspring in the control group had inguinal mammary glands described as rudimentary, with little difference between morphometric measurements in males and females. Genistein and methoxychlor had little effect on mammary glands of female offspring. Among males, both compounds were associated with an increase in branches, terminal end buds, and lateral buds, with the effect being statistically significant for genistein at the 800 ppm dietary level. [The Expert Panel noted that the pair-wise comparison to the 300 ppm group gave a P value of 0.06, using a Bonferroni correction.] There was no interaction between genistein and methoxychlor. Histologic evaluation of tissue sections were interpreted as showing an effect of genistein exposure on lateral bud formation, and the PCNA labeling index confirmed this impression for the 800 ppm genistein group (52% cells stained in the genistein 800 ppm group compared to 35% in the control group [estimated from graph, P < 0.05]). There was no significant interaction with methoxychlor exposure. IGF-1 receptor staining was described as higher in the group exposed to genistein 800 ppm [data not shown]. Progesterone receptor and ER staining was performed only for the control group and the group exposed to genistein 800 ppm+methoxychlor 800 ppm and was described as increased [no quantitative data were presented]. Serum prolactin and IGF-1 were not shown to be affected by genistein treatment. The authors added in the study Discussion section that dietary genistein did not result in an increase in uterine weight in this study. [No information was given in the study Methods or Results section concerning the evaluation of uterine weight. This information was presented in a previous paper (You et al., 2002a).] The authors concluded that genistein exposure enhanced the differentiation of mammary glands, expressed as an increase in lateral buds, as opposed to methoxychlor, which produced ductal proliferation.
In a continuation of this study (Wang et al., 2006), 1 pup/sex/litter (n = 10 litters) were weaned to their dams’ diet on PND 22, and inguinal mammary glands were removed on PND 90 for evaluation in whole mount and histologic section. Trunk blood was collected for determination of 17β-estradiol, testosterone, LH, FSH, growth hormone, IGF-1, and prolactin. RNA was extracted from mammary tissue for microarray analysis against a panel of 1176 genes implicated in cellular responses to stress and toxicity. Genistein at 300 and 800 ppm increased mammary gland size and density in male rats. Alveolar proliferation was more prominent at 800 than at 300 ppm. There were no detected genistein-related effects on serum hormone levels, although the 800 ppm dose level reduced serum IGF-1. In the microarray analysis, there were 10 genes that were down-regulated and 23 genes that were upregulated by genistein treatment. Androgen receptor was one of the down-regulated genes and ERα was one of the up-regulated genes.
Strengths/Weaknesses
Strengths include the use of multiple dose levels, which allowed for an assessment of dose–response relationships, and the use of an exposure period that included the neonatal period. The soy-and alfalfa-free diet, the verification of homogeneity and concentrations of test diets, and the monitoring of individual dam body weights and feed consumption are additional strengths. The high dose of methoxychlor was not realistic; consequently, the data may not reflect the interactions of these agents at low dose levels.
Utility (Adequacy) for CERHR Evaluation Process
This study is useful in the evaluation process.
Hilakivi-Clarke et al. (1999a), supported by the American Cancer Society and the Public Health Service, evaluated the effect of prenatal genistein exposure on susceptibility to dimethyl benzanthracene induction of mammary cancer in rats. In Experiment 1, pregnant Sprague-Dawley rats were obtained on GD 10 and treated with daily s.c. doses of genistein 20 μg (n = 10), zearalenone 20 μg (n = 11), or vehicle (n = 9) on GD 15–20 [plug day not specified; dam weight not given, but genistein dose was indicated as 0.1 mg/kg bw/day, implying a 200 g dam body weight]. In Experiment 2, dams were treated on GD 15–20 with s.c. genistein 0, 100, or 300 μg/day (stated to be 0.5 and 1.5 mg/kg bw/day). On PND 2, males were removed and female pups cross-fostered to produce litters of 10–12 pups. [The Expert Panel questions whether pups were cross-fostered in the sense of pups being raised by dams in a treatment group other than that of their biologic mother. In a previous publication from this laboratory (Hilakivi-Clarke et al., 1998), the term “cross-fostering” was used to mean re-allocation of pups to dams within the same treatment group.] In Experiment 1, five offspring/group/time point were killed on PND 21 and 35 for estimation of ERα and ERβ protein in mammary glands using a ligand binding assay. In Experiment 2, ER protein was estimated in five offspring each from the 0 and 300 μg genistein groups on PND 45. Protein kinase C was estimated in mammary tissue from five offspring/treatment group in Experiment 1 using a commercial kit. In Experiment 1, 45-day-old offspring (24/group) were treated with the mammary carcinogen dimethyl benzanthracene by mouth at 10 mg [described as 40 mg/kg bw, implying 250 g body weight]. The same dimethyl benzanthracene treatment was given in Experiment 2 on PND 50 (18–27/group). Animals were evaluated weekly for number of animals with tumors, latency to the appearance of tumors, and number of tumors per animal. Animals were killed when their tumor burden reached 10% of their body weights or by 18 (Experiment 1) or 20 (Experiment 2) weeks after administration of dimethyl benzanthracene. [Statistical methods were not explicitly discussed but appeared to be ANOVA with post-hoc Fisher least significant difference test. Litter of origin appears not to have been considered in the analyses.]
Dams producing litters, dam weight gain, pregnancy length, pups/litter, and PND 2 pup weight were not found to be altered by treatment [data shown only for Experiment 1]. There was no detectable effect of treatment on pup body weight in Experiment 1. In Experiment 2, pup body weights were ~9% lower than control in both genistein-exposed groups on PND 35 but not at earlier or later evaluations. Mammary ER protein content on PND 35 was nearly twice as high in pups born to dams treated with genistein 20 μg/day compared to controls. On PND 45, ER protein content in mammary tissue was more than five times as high in pups born to dams treated with genistein 300 μg/day compared to controls. [ER comparisons estimated from a graph; both comparisons were statistically significant according to the study authors.] In Experiment 1, there was no detected effect of treatment on protein kinase C activity on PND 21, but on PND 45, offspring born to dams treated with genistein 20 μg/day had a statistically significant 47% reduction in protein kinase C activity [estimated from a graph]. The incidence of mammary tumors after dimethyl benzanthracene treatment was significantly increased in offspring born to dams treated with genistein 20 or 300 μg/day but not 100 μg/day. There was no detected treatment effect in either experiment on latency to tumor development, number of tumors per animal, or number of tumors showing regular growth. The authors concluded that maternal exposure to genistein during pregnancy at doses in the range of human exposures increased susceptibility to carcinogen-induced mammary tumorigenesis.
Strengths/Weaknesses
A strength of this study is that female rat pups were cross-fostered on PND 2 to control for environmental factors such as maternal caregiving. Dose levels were selected to approximate the level of human exposure (0.1, 0.5, 1.5 mg/kg bw compared to reported human exposures of ~0.1 mg/kg bw in Asian populations), although the injection route is not relevant to human exposure. Multiple time points were assessed for mammary ER numbers, although the exposures were not the same at all time points. Appropriate controls were included in protein kinase C experiments. A dose of dimethyl benzanthracene was selected that allowed for detection of both decreases and increases in mammary tumors. The purity of genistein was not given, and dose solutions were not analyzed for concentration, stability, or homogeneity. The authors did not mention the use of genistein-free diet, suggesting the possibility of additional genistein exposure. The authors used only one dose level of genistein (20 μg) in Experiment 1, so dose–response relationships could not be evaluated. The authors estimated the 20 μg dose of genistein to be equivalent to 0.1 mg/kg bw/day (implied dam weight = 200 g). There appeared to be an error, because it seems highly unlikely that female Sprague-Dawley rats on GD 15–20 weighed as little as 200 g, particularly given that the animals dosed with dimethyl benzanthracene at 45 days of age were calculated to weigh 250 g. Maternal/fetal blood levels of genistein were not reported. The day on which the dams were sperm-positive was not identified (GD 0 or 1). There were no details on how dams were assigned to treatment groups, and there was no indication that the authors controlled for litter effects. While they cross-fostered pups into different litters (two to three pups stayed with the biologic mother), this cross-fostering would only control for environmental factors (see above). There was no evidence that the authors considered litter of origin when assigning pups to different endpoints. The ER assay measured total ER without specifying subtype (ERα or ERβ). The description of the statistical analyses was inadequate; tests were identified in cases where statistical significance was observed but not identified in cases where effects were not statistically significant. Body weights of female offspring were significantly lower at 35 days of age at both 100 and 300 μg genistein, which may have influenced some endpoints. There was a lack of consistency between doses of genistein used and time points at which data were collected. For example, reproductive endpoints (pregnancy rates, weight gain during pregnancy, numbers of pups/litter, etc.) were examined only at 20 μg genistein, not at higher doses. ER protein levels were measured in the 20 μg group at 21 and 35 days of age and in 300 μg group at 45 days of age; thus, dose–response could not be assessed at any of those time points. A similar situation existed for protein kinase C activity. There was a discrepancy in the mammary tumor incidence between Experiments 1 and 2. In Experiment 1, 50% of control animals had tumors and 96% of animals given 20 μg genistein developed tumors by week 18. In Experiment 2, only 17% of control animals developed tumors, compared with 27% and 44% of animals exposed to 100 and 300 μg genistein, respectively. The authors mentioned that the difference in the control incidence was related to the age at which dimethyl benzanthracene was administered (45 days of age in Experiment 1 compared to 50 days of age in Experiment 2). It is not clear why dimethyl benzanthracene was administered at different ages, as this difference complicates the interpretation of the genistein results. Sample sizes were insufficient for some endpoints (e.g., only three animals developed tumors in the Experiment 2 control group).
Utility (Adequacy) for CERHR Evaluation Process
This study is not useful in the evaluation process.
Yang et al. (2000), supported by the Japanese Private School Promotion Foundation evaluated the effects of prenatal exposure of Sprague-Dawley rats to genistein on subsequent susceptibility to methylnitrosourea-induced mammary cancer. Genistein (>99% purity) in DMSO was given s.c. at 5 or 25 mg/kg bw/day on GD 16–20 (plug day not specified). An untreated control was used. Female offspring of the untreated control dams were injected s.c. with genistein in DMSO at 0 or 12.5 mg/kg bw/dose on PND 15 and 18 (birth = PND 0). [No information was provided on culling, weaning, or litter allocation of postnatally treated animals.] On PND 35, four to nine females per dose group were killed, and thoracic mammary glands were fixed in formalin and prepared for whole-mount evaluation after staining with hematoxylin. The remaining females were treated with methylnitrosourea 50 mg/kg bw i.p. Vaginal cytology was used to monitor the estrous cycle from 12–16 weeks of age. Animals were examined weekly for palpable breast tumors and were killed when the largest tumor reached 1 cm diameter or at 35 weeks of age. Mammary tumors and abdominal mammary glands were fixed in neutral buffered formalin, embedded in paraffin, sectioned at 4 μm, and stained with hematoxylin and eosin for light microscopy. Immunohistochemistry was used to evaluate tumors for proliferation (using antibody to PCNA) and estrogen and progesterone receptor using counts of antigen-positive cells among at least 1000 cells from five different tumor sections. Tumors containing more than 80% ER- or progesterone receptor-positive cells were considered hormone-dependent. Data were analyzed using χ2 and the Mann-Whitney U-test. [There is no indication that litter of origin was considered in the analysis.]
There were no detected effects of treatment on birth weight, survival, or general health of dams and pups [data were not presented]. PND 35 body weight was significantly lower among offspring exposed to genistein either pre- or postnatally (11–18% lower than the untreated control). Relative uterine-ovarian weight was described as decreased in genistein-exposed offspring. [Marked in the data table as statistically significant for the group in which dams received genistein 5 mg/kg bw/day, but numerically lower in the other groups. The Expert Panel believes the lack of a dose–response relationship in the statistical analysis may be due to the use of eight offspring in the 5 mg/kg group and four offspring in the other genistein-exposed groups.] Evaluation of estrous cycles in 18–29 females/group showed a statistically significant increase in mean cycle length in animals prenatally exposed to maternal genistein at 5 mg/kg bw/day (0.4-day increase) and postnatally exposed to two 12.5-mg/kg bw doses of genistein (1.4-day increase). There was a significant increase in mean time/cycle spent in estrus in all genistein-exposed animals (0.2–0.8 days).
On PND 35, there were no qualitative differences in the appearance of mammary gland tissue in genistein-exposed or untreated animals. Immunohistochemistry assessment of proliferation, ER, and progestin receptor did not show a treatment effect. There was no detected treatment effect on the number of rats developing mammary tumors >1 cm or on the latency from methylnitrosourea treatment to recognition of a tumor >1 cm. The mean (± SEM) number of mammary tumors (including those identified histologically) per animal was statistically increased in animals from dams treated with genistein 5 mg/kg bw/day (2.9± 0.5) compared to untreated animals (1.5± 0.2, P < 0.05). The mean number of tumors per animal in the group exposed prenatally to 25 mg/kg bw/day to the dam (2.6± 0.5) was not statistically different from the control rate according to the authors [P = 0.026, t-test performed by CERHR]. Most tumors >1 cm were hormone-dependent; no significant difference was detected in the proportion of hormone-dependent tumors by treatment group. The authors concluded that short exposure to genistein during the perinatal period in rats increased susceptibility to methylnitrosourea-induced mammary tumors as manifested by an increase in the number of tumors per rat.
Strengths/Weaknesses
A strength of this study is that rats were exposed to multiple dose levels of genistein, which allowed some assessment of dose–response relationships. Large numbers of cells (1000 cells from five different areas of each tissue section) were counted during immunohistochemistry experiments to identify ER-, progesterone receptor-, and PCNA-positive cells. Offspring body weights were monitored throughout the experiment. A weakness is that the acclimation period for this study was very short; rats were received on GD 14 and injections began on GD 16. It was not specified whether the rats received genistein-free chow. The purity of genistein was not given, and dose solutions were not analyzed for concentration, stability, or homogeneity. There was only one dose level used for PND 15 and 18 exposures, which did not allow an assessment of dose–response relationships. Maternal/fetal blood levels of genistein were not reported. The day on which the dams were sperm-positive was not identified (GD 0 or 1). There were no details as to how dams were assigned to treatment groups, and there was no indication that the authors controlled for litter effects. In utero control animals were untreated (apparently not given DMSO as a vehicle control). There was no evidence that the authors considered litter of origin when assigning pups to different endpoints. Litter data (e.g., number of litters, litter size, pup body weights) were not presented. Estrous cycle evaluations were performed at 12–16 weeks of age after exposure to methylnitrosourea at 35 days of age, which could have contributed to altered cycles. Mammary whole mounts were prepared from 4–9 females/group at 35 days of age; a sample size of four is small for such an assessment. The authors did not mention whether negative or positive controls were used during their immunohistochemistry experiments; thus, it is not possible to confirm the specificity of labeling. There was a significant decrease in relative uterine-ovarian weight in 35-day-old rats exposed to genistein 5 mg/kg bw/day on GD 16–20; however, there was no indication that the authors controlled for estrous cycle stage at the time of sample collection on PND 35. The relative uterine-ovarian weights in the 12.5 and 25 mg/kg bw/day dose groups did not achieve statistical significance, which may have been related to the small sample sizes in these groups (n = 4). The 25 mg/kg bw/day group had a greater decrease in uterine-ovarian weight than the 5 mg/kg bw/day dose group. According to study Table 2, the control value for length of one estrous cycle was 42± 0.1 days (presumably, this should be 4.2± 0.1 days). While statistically significant, it is difficult to discern the biologic significance of a 4.2-day estrous cycle in control animals compared to a 4.6-day cycle in animals treated in utero with 5 mg/kg bw/day genistein, given that normal estrous cycles are 4–5 days in length and the authors did not control for litter effects. A similar issue applies to length of estrus, which was 1.1 days in control animals compared to 1.3 days in animals treated with genistein 25 mg/kg bw/day (normal duration of estrus is 1–2 days). The “increased time in estrus” did not exhibit a dose–response relationship. With in utero genistein exposure, neither the percent increase in mammary carcinoma incidence nor the mean number of mammary carcinomas/rat followed a dose–response relationship.
Utility (Adequacy) for CERHR Evaluation Process
This study is not useful in the evaluation process.
Hilakivi-Clarke et al. (2002), in a study supported by the American Institute for Cancer Research, American Cancer Society, Komen Breast Cancer Foundation, and DoD, examined the effects of in utero genistein exposure on development of mammary cancer in adulthood. Sprague-Dawley rats were fed a control AIN-93 diet for 7 days upon arrival at the laboratory. A few days prior to mating, the rats (n = 17–23/group) were switched to one of three AIN-93 diets containing 20% soy isolate, with genistein concentrations of 15, 150, or 300 mg (aglycone equivalent)/kg diet. [Based on assumed values of rat body weights (0.204 kg) and feed intake (0.02 kg/day) (EPA, 1988), in addition to reported weight gain during pregnancy (~100 g), genistein intake was estimated at 1–1.5, 10–15, and 20–30 mg/kg bw/day.] Rats fed the medium- and high-dose genistein diets were reported to have serum genistein levels within ranges observed in Asians consuming high-soy diets. Rats were fed their respective diets throughout pregnancy, and after giving birth were fed the control AIN-93 diet. On PND 2 [day of birth not specified] female pups from three or four different litters were fostered to dams from the same dietary group as their mothers. Mammary gland morphology was examined in 3- and 8-week-old female offspring that were not exposed to carcinogens [number examined not specified]. At 47 days of age, 23–27 female offspring/group were administered dimethyl benzanthracene by gavage at ~50 mg/kg bw, a dose that induces tumors in ~2/3 animals. In another part of the study, dams (n = 36) fed the low-, medium-, or high-dose diets on GD 7–19 were killed on GD 19 and serum 17β-estradiol was determined. Serum 17β-estradiol levels were also measured in offspring (n = 5–7/group) at 3 and 8 weeks of age. 17β-Estradiol data were not used for the 8-week-old rats in proestrus because 17β-estradiol levels peak at that stage. Serum 17β-estradiol levels were measured using a double antibody kit. Statistical analyses were conducted using 1- or 2-way ANOVA, Fisher least significant difference test, χ2 test, Kaplan-Meier test, or Wilcoxon test.
Genistein had no detected effect on weight gain in dams, length of pregnancy, litter size, or postnatal pup weight gain. Percent successful pregnancy appeared lower in rats fed the high-genistein (55%) than the low-or medium-genistein diets (70–71%), but the effect was not statistically significant. A dose-related increase in serum 17β-estradiol levels was observed in the dams fed genistein, but the results did not attain statistical significance. In offspring of dams fed genistein-containing diets during pregnancy, serum 17β-estradiol levels were not shown to be significantly affected at 3 weeks of age but were significantly reduced at 8 weeks of age in the high-genistein diet group. Morphologic changes in mammary glands of 8-week-old but not 3-week-old offspring of the high genistein diet group included decreased numbers of lobules [scores of ~3.75, 3.75, and 2.5 in the low-, medium-, and high-dose diet groups] and a dose-related increase in terminal end buds [~30, 45, and 60 in the low, medium, and high dose diet groups]. Significant effects following dimethyl benzanthracene treatment included increased tumor incidence in the high genistein diet group at 17 weeks (82 vs. 67% in the low- and medium- diet groups) and decreased proportion of animals surviving to 17 weeks of age in the medium and high genistein groups (survival 37, 51, and 59% in low-, medium-, and high-dose groups). [The data table in the study did not indicate statistical significance for the medium-dose genistein group.] Genistein had no detected effect on tumor latency or multiplicity. The effects of polyunsaturated fatty acids (n-3 or n-6) were also examined in this study, and it was determined that increased levels of polyunsaturated fatty acids in diet were associated with higher levels of 17β-estradiol during pregnancy, more mammary lobules and fewer terminal end buds in offspring, and protective effects against carcinogenicity in offspring. The study authors concluded that in utero exposure to genistein could increase breast cancer risk.
Strengths/Weaknesses
A strength of this study is that dosing occurred through the diet, which is the most relevant route for humans. The authors used AIN-93 diet, which has no phytoestrogen activity (per Harlan-Teklad, Madison, WI). For the genistein-treated groups, diets contained genistein at one of three dose levels by addition of soy isolate (20% of the diet; 0.075, 0.75, or 1.5 mg genistein [aglycone equivalent]/g product). Dose levels were relevant, as medium- and high-dose levels were reportedly equivalent to Asians consuming a high-dose diet. Female rat pups were cross-fostered on PND 2 to control for environmental factors such as maternal caregiving. A satellite group was included for the measurement of serum 17β-estradiol levels during pregnancy. For serum 17β-estradiol measurements in the offspring, pups were evaluated at 3 weeks of age (sampling time) to ensure that none had undergone vaginal opening prior to collecting a serum sample. For 8-week-old rats, uterine morphology was used to determine estrous stage, and rats were excluded if they were in proestrus. Increased tumor incidence in the high-dose genistein group at 17 weeks corresponded with the increased numbers of terminal end buds and decreased lobule density seen in this group at 8 weeks. A weakness of the study is that it was not clear which group represented the control, as the diets were modified to contain either high or low levels of n-3 or n-6 polyunsaturated fatty acids and low (15 mg/kg diet), medium (150 mg/kg diet), or high (300 mg/kg diet) levels of genistein. None of the groups were maintained on unsupplemented diet. It was not clear if an untreated control group existed among the polyunsaturated fatty acids diets, and there was no indication that the genistein-treated groups were compared back to such a control. The purity of genistein was not given, and there was no mention as to whether the diets were analyzed for concentration, stability, or homogeneity. Maternal blood levels of genistein were not reported. There were no details as to how dams were assigned to treatment groups, and there was no indication that the authors controlled for litter effects. While they cross-fostered pups into different litters (two to three pups stayed with the biologic mother), this cross-fostering would only control for environmental factors. There was no evidence that the authors considered litter of origin when assigning pups to different endpoints. Pregnancy rates were somewhat low for Sprague-Dawley rats (e.g., 70% in the low-genistein group), although the sample size was small. Larger sample sizes would have made the 17β-estradiol data more easily interpretable. The authors only measured total 17β-estradiol; it is not known what proportion of this 17β-estradiol existed in a free state.
Utility (Adequacy) for CERHR Evaluation Process
This study is not useful in the evaluation process.
Foster et al. (2004), supported by the Canadian Chemical Producers association, Health Canada, and the Natural Sciences and Engineering Research Council, evaluated the effect of neonatal genistein exposure in Sprague-Dawley rats with antenatal exposure to a mixture of 17 different chlorinated compounds. The mixture was formulated to include organic and inorganic environmental chemicals for which there was evidence of human exposure in Canada. The compounds were present in amounts (on a mg/kg bw/day basis) representing “safe” exposure levels based on US or Canadian government regulations. Pregnant animals were gavaged with corn oil (n = 9) or with the mixture (n = 10) daily on GD 9–16 [plug day not defined]. On PND 2–8, half the pups in each group were given s.c. genistein 10 mg/kg bw/day [assignment by litter not indicated]. On PND 200, one female per litter were killed, and the first right thoracic mammary gland was dissected for histopathologic evaluation. [There were seven females evaluated from the group that was exposed to the mixture and to genistein, suggesting that more than one female/litter was used in this group.] Histopathology findings were ranked from 0 (normal) to 4 (severe changes), with a decimal added to the integer to represent focal changes (0.25), locally diffuse changes (0.5), and diffuse changes (0.75). The maximum histologic abnormality, then, was represented by a rank score of 4.75. Comparisons were made using ANOVA with post-hoc Dunn test. In the control group (corn oil during pregnancy, s.c. vehicle neonatally), there was one animal of the four examined with rare mild ductal hyperplasia. There were no detected histologic abnormalities in the group exposed during pregnancy to the mixture with neonatal vehicle administration. In the group exposed to corn oil during pregnancy and genistein in the neonatal period, mammary glands showed evidence of lactation with cystic ductal dilatation, atypical epithelial hyperplasia, and microcalcifications. In situ ductal carcinoma was identified in two of the five animals examined. In the group exposed to the mixture during pregnancy, these changes were more severe, with atypical hyperplasia in six of the seven animals examined; however, there were no instances of carcinoma in this group. The authors concluded that low concentrations of environmental toxicants can interact with hormonally active agents postnatally to alter mammary gland structure. The authors contrasted their findings with those of Fielden et al. (Fielden et al., 2002) in which there was no adverse effect of in utero or lactational exposure of mice to genistein, and noted possible differences in route of administration (s.c. compared to oral). They also noted the discrepancy between their findings and those of Cotroneo et al. (2002), who used the same rat strain and route of administration of genistein (at 500 mg/kg bw/day), but who did not find histologic changes suggesting an increase in mammary gland susceptibility to carcinogenesis. Cotroneo et al. exposed animals to genistein on PND 16, 18, and 20 as opposed to PND 2–8 in the current study, and the current study authors concluded, “…our data suggest that both the dose and timing of exposure are critical factors in altering mammary-gland sensitivity to genistein-induced changes in mammary gland morphogenesis and potential tumorigenesis.”
Strengths/Weaknesses
A strength of this study is that it included genistein exposure during the neonatal period. Histopathology was scored for both severity of changes and distribution. Statistical analyses were appropriate. The purity of genistein was not given, and dose solutions were not analyzed for concentration, stability, or homogeneity. The animals received standard laboratory rat chow (8604 Harlan-Teklad), which may have contributed additional genistein exposure. Because the authors used only one dose level of genistein (10 mg/kg bw/day), dose–response relationships could not be evaluated. The dose level was higher than human exposures (considered pharmacological, presumably because it may be in the range of some dietary supplements). Pup blood levels of genistein were not reported. There were no details as to how dams and pups were assigned to treatment groups. Sample sizes were relatively small (n = 4–7 animals/group). Focal mild ductal epithelial hyperplasia was noted in 1/4 control animals. The authors reportedly controlled for litter effects by selecting one female from each litter for necropsy on PND 200; however, the n value of 7 was inconsistent with the five litters assigned to the mixture plus genistein treatment group, suggesting that the authors failed to control for litter effects when assigning animals to different endpoints and did not use the litter as the unit of analysis.
Utility (Adequacy) for CERHR Evaluation Process
This study is not useful in the evaluation process.
Pei et al. (2003), in a study supported in part by the Ministry of Health, Labor, and Welfare of Japan, examined the effects of prenatal and prepubertal genistein exposure on chemically induced carcinogenesis in the rat. Pregnant and lactating Sprague-Dawley rats were fed NIH-O7, a phytoestrogen-free diet. During pregnancy, 5–6 rats/group were s.c. injected with genistein (>99% purity) at 0 (DMSO vehicle), 1.5, or 30 mg/kg bw/day on GD 15–19 (day of vaginal plug not defined). A total of 26–30 female offspring were produced in each group. Thirty female rats/group from additional untreated dams [number of dams from which female offspring were obtained was not specified] were s.c. injected with genistein 1.5 or 30 mg/kg bw/day from 15–19 days of age. The low dose was reported to be equivalent to genistein intake in Asian populations (0.4–1.5 mg/kg bw/day). Vaginal opening was monitored daily, and body weights were measured weekly. Six randomly selected rats from each dose group were killed at 28 days of age to examine mammary gland histopathology, and numbers of ERα-, progesterone receptor-, p63- (involved in cell renewal), and PCNA-positive cells by immunohistochemistry methods. The remaining 28-day-old rats from each group (~20–24/group) were i.p. injected with 50 mg/kg bw N-methyl-N-nitrosourea dissolved in 0.5% acetic acid. Rats were palpated weekly for mammary tumors. Estrous cyclicity was monitored from 10–14 weeks of age. Rats were killed at 26 weeks of age for evaluation of mammary tumors, ERα- and progesterone receptor-containing cells, and cell proliferation. Mammary carcinomas with >80% ERα- or progesterone-positive cells were classified as hormone-dependent. Tumor incidence data were analyzed by Mantel-Cox Log rank test. Estrous cycle and hormone-dependency data were assessed by χ2 test. All other data were analyzed by ANOVA, Kruskal-Wallis test, Fisher protected least significant difference test, or Bonferroni/Dunn test.
Results are summarized in Table 55. Prenatal genistein treatment resulted in lower body weights, while pre-pubertal genistein treatment resulted in higher body weights compared to controls on PND 28. Relative (to body weight) uterine-ovarian weights were lower in both dose groups treated prenatally and in the low-dose group treated in the prepubertal period. There were no detected histopathologic changes in ovaries or uteri at 28 days of age. Vaginal opening was accelerated in rats treated with genistein 30 mg/kg bw/day during the prepubertal period [mean day of vaginal opening was not reported by study authors]. All untreated rats had normal 4–5-day estrous cycles, but percentages of rats with either 3-day or 6-day estrous cycles were increased in all treated groups. The estrous phase of the cycle was prolonged and the diestrous phase was shortened in rats treated with genistein during prepuberty. At 28 days of age, mammary gland development was comparable in all treatment groups, with similar numbers of terminal end buds at the periphery of the mammary tree. Genistein-treated rats had decreased numbers of ERα-, progesterone-, PCNA-, and p63-positive mammary terminal end bud cells. Genistein treatment decreased the number of rats with carcinomas ≥1 cm, but statistical significance was attained only in the group given 1.5 mg/kg bw/day during prepuberty. Genistein had no detected effect on tumor multiplicity, latency, or numbers of hormone-dependent carcinomas. The majority of tumors (91–100%) in the control and all dose groups were hormone-dependent. The study authors suggested that prepubertal exposure to genistein protects rats against N-methyl-N-nitrosourea-induced mammary carcinomas by reducing levels of ERα-, progesterone receptor-, p63-, and PCNA-positive cells.
Table 55.
Effects in Rats Treated With Genistein During Prenatal or Prepubertal Development
| Genistein doses (mg/kg bw/day)
|
||||
|---|---|---|---|---|
| During gestation
|
In prepuberty
|
|||
| Parameter | 1.5 | 30 | 1.5 | 30 |
| Body weight at 28 days of age | ↓13% | ↓10% | ↑ 28% | ↑ 25% |
| Relative (to body weight) uterine-ovarian weight at 28 days of age | ↓23% | ↓32% | ↓20% | ↔ |
| Percentage of rats with 3-day estrous cyclesa,b | ~10% | ~5% | ~8% | ↔ |
| Percentage of rats with 6-day estrous cyclesa,b | ↔ | ~10% | ~10% | ~17% |
| Percentage of time in estrus | ↔ | ↔ | ↑ 20% | ↑ 34% |
| Percentage of time in diestrus | ↔ | ↔ | ↓19% | ↓22% |
| Percentage of terminal end bud cells at PND 28 positive for | ||||
| ERα | ↓13% | ↓28% | ↓30% | ↓25% |
| Progesterone | ↓12% | ↓29% | ↓27% | ↓27% |
| p63 | ↓17% | ↓15% | ↓12% | ↓17% |
| PCNA | ↔ | ↓6.3% | ↓11% | ↓14% |
| Percentage of rats with carcinomas ≥1 cm | ↔ | ↔ | ↓40% | ↔ |
↑,↓,↔ Significant increase, decrease, or no change.
Values estimated from a graph by CERHR.
All control rats had normal (4–5 day cycles); statistical significance of the effect was not determined.
From Pei et al. (2003).
Strengths/Weaknesses
Strengths include the use of a diet free of phytoestrogens, purity of genistein >99%, use of multiple dose levels, and selection of physiological (1.5 mg/kg bw/day) and pharmacological (30 mg/kg bw/day) dose levels, although a relevant route of exposure was not used. Weaknesses include the lack of analysis of dose solutions for concentration verification, stability, or homogeneity, the lack of detail on how dams and pups were assigned to treatment groups, and the lack of indication that the authors controlled for litter effect either in their sampling methodology or statistical analyses. For the prepubertal treatment, 60 female offspring of mothers not exposed to genistein received s.c. injections, indicating that the prepubertal genistein treated animals came from different litters than those used in the prenatal experiments. There was no information on the number of litters from which these pups originated or that any litters were culled to standardize growth rates. Furthermore, it does not appear as if there was a concurrent prepubertal vehicle control group. It was difficult to determine how genistein treatment affected body weights because the authors did not report any body weights prior to 3 weeks of age. This lack of reporting was particularly problematic for the prepubertal animals, which may have weighed more than the control animals prior to genistein treatment. Genistein-treated rats reportedly had lower relative uterine-ovarian weights; however, the reason for this decrease was not given and is difficult to discern given that body weights were different across the treatment groups. Vaginal opening was accelerated in the prepubertal 30 mg/kg bw/day genistein-treated animals, but growth rate was not considered in this determination. Furthermore, historical control data were not presented for either age at vaginal opening or estrous cyclicity. The authors stated, “The number of tumors per rat (tumor multiplicity) was low in groups 2, 4, and 5…” when tumor multiplicity (study Table IV) in Group 2 did not differ from the control group (mean = 1.6 in both groups). The impact of body weight differences on the various endpoints was not known.
Utility (Adequacy) for CERHR Evaluation Process
This study is not useful in the evaluation process.
Hilakivi-Clarke et al. (1999b), in a study supported by the American Cancer Society, the Lombardi Cancer Center, and the Public Health Service, examined the effects of a physiologic dose of genistein on mammary tumorigenesis. Neonatal Sprague-Dawley rats (n = 30/group) were randomized to make litters of 10–12 females/dam. The rats were s.c. injected with 0 or 20 μg genistein [purity not specified] in a DMSO/peanut oil vehicle on PND 7, 10, 14, 17, and 20. Authors estimated doses at 2 mg/kg bw on PND 7 and 0.7 mg/kg bw on PND 20. On PND 45, rats were gavaged with ~50 mg/kg bw dimethyl benzanthracene to induce mammary tumors. Animals were examined regularly for up to 19 weeks following dimethyl benzanthracene dosing, at which time they were killed for an evaluation of mammary gland morphology (n = 4 or 5/group) and the number of ER-binding sites in the fourth mammary gland (n = 7/group). Data were analyzed by ANOVA, Fisher least significant difference, and χ2 test.
No effect of genistein treatment on body weight gain was detected. The incidence of mammary tumors was 43% in the genistein group at Week 18 compared to 57% in control group (not statistically significant). Tumor multiplicity was significantly reduced in the genistein group with a mean± SEM of 1.1± 0.1 tumors/animal versus 1.8± 0.3 tumors/animal in controls. The percentage of proliferating tumors was also reduced in the genistein group (60%) compared to the control group (94%). Adenocarcinomas represented 100% of tumors in the control group and 40% of tumors in the genistein group. The remaining tumors in the genistein group were non-malignant. Genistein had no detected effect on tumor latency. Rats treated with genistein had greater lobular differentiation, significantly decreased terminal duct density [about half that of controls], and significantly increased alveolar bud density [~45% higher than controls]. Genistein had no effect on ER protein levels in mammary gland. The study authors concluded that in rats, the risk of developing mammary tumors is reduced by a low dose genistein exposure prior to puberty.
Strengths/Weaknesses
A strength of this study is that rat pups were cross-fostered on PND 2, prior to genistein treatment. Dose levels were selected to approximate the level of human exposure in Asian populations. A dose of dimethyl benzanthracene was selected that allowed for detection of both decreases and increases in mammary tumors. Histologic examinations were conducted independently by two pathologists who were blind to treatment group. The purity of genistein was not given, and dose solutions were not analyzed for concentration, stability, or homogeneity. The authors did not mention the use of genistein-free diet, suggesting the possibility of additional genistein exposure. The authors used only one dose level of genistein (20 μg), so dose–response relationships could not be evaluated. Genistein doses varied from 2 mg/kg bw on PND 7 to 0.7 mg/kg bw on PND 20. Maternal/fetal blood levels of genistein were not reported. There were no details as to how dams were assigned to treatment groups, and there was no indication that the authors controlled for litter effects by considering litter of origin when assigning pups to different endpoints. The ER assay measured total ER without specifying subtype (ERα or ERβ). There was no description of positive and negative controls included during the determination of ER-binding sites. Mammary whole mount examinations were conducted on only 4–5 specimens/group. The authors used 1-way ANOVA for statistical analyses; however, because there was only 1 genistein treatment group, 1-way ANOVA would be the equivalent of a t-test (presumably the genistein and zearalenone data were analyzed separately).
Utility (Adequacy) for CERHR Evaluation Process
This study is not useful in the evaluation process.
Lamartiniere et al. (1995a,b), Brown and Lamartiniere (1995), Brown et al. (1998), Cotroneo et al. (2002), and Murrill et al. (1996), funded in part by NIH, published a series of studies on the role of genistein in mammary carcinogenesis in rats. Sprague-Dawley rats were fed standard chow during pregnancy and AIN-76-A, a phytoestrogen-free diet, starting at parturition. [In one study, rats were purchased as weanlings and placed on the AIN-76-A diet (Brown and Lamartiniere, 1995).] At birth, litters were culled to 11 pups (4–6 females). During neonatal (PND 2, 4, and 6), prepubertal (PND 16, 18, 20), or pubertal (PND 23, 25, 27, 29) stages of development, female offspring were s.c. injected with genistein. Doses were equivalent to 500 mg/kg bw in neonates and prepubertal rats and 50 mg/kg bw in pubertal rats. DMSO was the vehicle used for genistein delivery and treatment of controls, with the exception of 1 study that used a sesame oil vehicle (Brown and Lamartiniere, 1995). Five or more rats per group were evaluated for most endpoints, and at least 19 animals per group were examined for tumor development. Statistical analyses were performed with the Wilcoxon rank sum test, Fisher exact test, Armitage test, Student t-test, ANOVA, and Tukey test. [Variances are not always identified in the Results sections of these papers, but the use of SEM appears to be common in this laboratory and is assumed for the data presented below.]
In rats treated prepubertally with genistein 500 mg/kg bw on PND 16, 18, and 20, total genistein concentrations were measured in serum by HPLC and reported as 4.2± 0.6 μM [1134± 162 μg/L] at 21 days of age and 102± 30 nM [28± 8 μg/L] at 50 days of age (Murrill et al., 1996). Brown et al. (1998) noted that the genistein level in the 21-day-old rats was similar to genistein plasma concentrations in infants fed soy formula, 684 μg/L (2.5 μM) (Setchell et al., 1997).
Endocrine parameters were reported for rats treated with 500 mg/kg bw genistein s.c. during neonatal (Lamartiniere et al., 1995b) and prepubertal (Murrill et al., 1996) stages. A very limited examination of endocrine parameters was included in the study with pubertal treatment with 50 mg/kg bw genistein s.c. (Brown and Lamartiniere, 1995). Genistein accelerated female sexual development, as noted by vaginal opening occurring on PND 28 versus 34 in rats treated neonatally and on PND 27 versus 37 in rats treated prepubertally with genistein versus vehicle. Mammary size was transiently increased following treatment with genistein in the neonatal and prepubertal periods. Evaluation of pubertally treated rats at a single time period also revealed increased mammary size. Uterine-ovarian weight was reduced in 21–230-day-old rats treated neonatally, but uterine wet weight was transiently increased in rats treated prepubertally. No significant effects on body weight were observed at any age. Time spent in estrus increased following neonatal genistein exposure (42.9% of the cycle in treated compared to 23.4% of the cycle in control) and prepubertal genistein exposure (36% in treated compared to 23% in control) [statistical significance not discussed]. An examination of ovaries fixed in 10% neutral buffered formalin revealed twice as many atretic antral follicles and less than 1/10 the number of corpora lutea [data not shown] in 50-day old rats treated as neonates. No significant effects of genistein treatment on the number of oocytes/follicle, atretic follicles, or corpora lutea in ovaries from 50-day-old rats treated during the prepubertal period were detected. RIA measurement of circulating progesterone and 17β-estradiol levels found progesterone to be significantly reduced [by 81%] following neonatal treatment; both hormones were found to be slightly, but not significantly, lower in rats treated during the prepubertal period.
Tumorigenicity following gavage administration of dimethyl benzanthracene at 50 days of age was assessed in rats treated with 500 mg/kg bw genistein during the neonatal (Lamartiniere et al., 1995a,b) and prepubertal (Murrill et al., 1996) periods. Rats treated with genistein during either developmental period developed only half as many dimethyl benzanthracene-induced tumors as control rats. In neonatally treated rats, genistein significantly increased latency for appearance of palpable tumors (124± 33 days compared to 87± 37 days in controls) and reduced the incidence of mammary tumors (100 compared to 88% in controls) at 190 days post treatment. No significant difference in time to tumor development in rats treated with genistein during the prepubertal period was detected. Adenocarcinomas represented ≥93% of tumors in all groups of rats.
Effects of genistein on mammary gland development were studied in rats exposed to genistein during each of the developmental periods using whole mounts fixed in 10% neutral buffered formalin; procedures, results, and references are presented in Table 56. Consistent effects of genistein treatment included increased numbers of terminal end bud cells in 21-day-old rats and decreased numbers of terminal end bud cells in50-day-old rats. Numbers of lobule cells were increased in 50-day-old rats treated with genistein during the prepubertal stage and in 90-day-old rats treated with genistein as neonates.
Table 56.
Effect of Genistein Treatment in Rats on Development of Mammary Structures
| Lobules
|
|||||||||
|---|---|---|---|---|---|---|---|---|---|
| Treatment (PND) | Dose, mg/kg bw | Evaluation (PND) | Terminal end buds | Terminal ducts | Type I | Type II | Type III | Total | Reference |
| 2, 4, 6 | 500 | 21 | ↑ | ↑ | ↔ | ↔ | Lamartiniere et al., 1995b | ||
| 50 | ↓ | ↔ | ↔ | ↔ | |||||
| 2, 4, 6 | 500 | 50 | ↓ | ↔ | ↔ | ↔ | ↔ | Lamartiniere et al., 1995a | |
| 90 | ↔ | ↔ | ↔ | ↔ | ↑ | ||||
| 16, 18, 20 | 500 | 21 | ↔ | ↔ | ↔ | Cotroneo et al., 2002 | |||
| 16, 18, 20 | 500 | 21 | ↑ | ↔ | Brown et al., 1998 | ||||
| 50 | ↓ | ↓ | ↑ | ||||||
| 16, 18, 20 | 500 | 22 | ↔ | ↓ | ↔ | ↔ | Murrill et al., 1996a | ||
| 33 | ↔ | ↔ | ↔ | ↔ | |||||
| 50 | ↓ | ↔ | ↔ | ↑ | |||||
| 23, 25, 27, 29 | 50 | 30 | ↔ | ↔ | ↑ | Brown and Lamartiniere, 1995 | |||
↑,↓,↔ Significantly increased, decreased, or unchanged compared to control.
Values for this study were presented as percentage instead of numbers.
Effects of genistein on proliferation were studied in mammary glands that were fixed in formalin and sectioned (Brown and Lamartiniere, 1995; Lamartiniere et al., 1995b; Murrill et al., 1996). As noted in Table 57 and Table 58, evaluations were conducted using PCNA staining (positive cells were described as “cycling”) or bromodeoxyuridine incorporation (positive cells were described as “S-phase). Table 57 summarizes percentages and Table 58 summarizes the number of cells described as cycling or in S-phase per mammary structure multiplied by the number of structures per gland. Lamartiniere et al. (1995b) concluded that there were increased numbers of cycling terminal end bud and duct cells in 21-day-old rats treated with genistein as neonates. [Consistent results were not obtained for 21-day-old rats; results varied according to the evaluation method used (i.e., percentage vs. number per structure).] Increases in cell proliferation from terminal structures were not observed in 22-day-old rats treated during prepubescence but were seen in 30-day-old rats treated during puberty. The authors concluded that genistein exposure in immature animals reduced the number of cycling and S-phase cells during adulthood (50 days of age). [In some cases no significant effects were seen compared to controls.]
Table 57.
Percentages of Mammary Cells Cycling or in S-Phase Following Genistein Treatment of Rats
| Terminal end buds
|
Terminal ducts
|
Type I lobules
|
Type II lobules
|
|||||||
|---|---|---|---|---|---|---|---|---|---|---|
| Treatment (PND) | Dose mg/kg bw | Evaluation (PND) | Cycling | S-phase | Cycling | S-phase | Cycling | S-phase | Cycling | S-phase |
| 2, 4, 6a | 500 | 21 | ↓ | ↓ | ↔ | ↔ | ↓ | ↔ | ||
| 50 | ↔ | ↓ | ↔ | ↓ | ↔ | ↔ | ↔ | ↓ | ||
| 23, 25, 27, 29b | 50 | 30 | ↑ | ↑ | ↑ | ↑ | ↑ | ↑ | ||
Cycling, PCNA positive; S-phase, BrdU positive.
↑,↓,↔ Significantly increased, decreased, or unchanged compared to control.
Table 58.
Numbers of Mammary Cells Cycling or in S-Phase Following Genistein Treatment of Rats
| Terminal end buds
|
Terminal ducts
|
Type I Lobules
|
Type II lobules
|
|||||||
|---|---|---|---|---|---|---|---|---|---|---|
| Treatment (PND) | Dose (mg/kg bw) | Evaluation (PND) | Cycling | S-phase | Cycling | S-phase | Cycling | S-phase | Cycling | S-phase |
| 2, 4, 6a | 500 | 21 | ↑ | ↔ | ↑ | ↑ | ↓ | ↔ | ||
| 50 | ↓ | ↓ | ↔ | ↓ | ↔ | ↓ | ↔ | ↓ | ||
| 16, 18, 20b | 500 | 22 | ↔ | ↓ | ||||||
| 33 | ↔ | ↔ | ↔ | |||||||
| 50 | ↓ | ↔ | ↔ | ↑ | ||||||
| 23, 25, 27, 29c | 50 | 30 | ↑ | ↑ | ↔ | ↔ | ↑ | ↑ | ||
Cycling, PCNA positive; S-phase, BrdU positive.
↑,↓,↔ Significantly increased, decreased, or unchanged compared to control.
One study focused on the role of the EGF-signaling pathway in animals treated during the prepubertal period (PND 16, 18, and 20) with 500 mg/kg bw genistein s.c. (Brown et al., 1998). Expression of transforming growth factor (TGF)-α, EGF, and EGF receptor in mammary glands of 21- and 50-day-old rats were examined using RT-PCR, Western blots, and immunohistochemical techniques. The study authors noted that in terminal ductal structures of 21-day-old rats, TGF-α and EGF receptor protein, but not mRNA expression, increased. [Based on immunohistochemistry data, the effect was statistically significant only for EGF receptor.] In mammary terminal structures from 50-day-old rats, mRNA expression was down-regulated for TGF-α during proestrus and estrus and EGF during proestrus. The study authors stated that in 50-day-old rats, immunostaining intensity was decreased for EGF receptor in terminal end buds and increased for EGF in terminal end buds and terminal ducts. [Results for EGF were not statistically significant.]
A subsequent study further examined mechanisms of prepubertal genistein exposure on mammary glands of 21-day-old rats (Cotroneo et al., 2002). Consistent with the earlier study by Brown et al. (1998), prepubertal genistein treatment increased EGF receptor protein expression in mammary glands. Although phosphorylated-EGF receptor expression was increased, normalization to total EGF receptor resulted in no detected difference, indicating no net effect on phosphorylation. Expression and phosphorylation of downstream EGF receptor targets were not affected [data not shown]. Genistein treatment also increased progesterone receptor expression and decreased staining intensity of ERα in mammary glands. Effects in genistein-treated rats were similar to those in estradiol benzoate-treated rats. Treatment with the anti-estrogen ICI 182,780 inhibited genistein and estradiol benzoate effects on mammary development and inhibited expression of EGF and progesterone receptors; the ICI 182,780 effects led authors to suggest blocking of ER function. Similar effects on progesterone expression [data not shown] and EGF receptor expression in intact and ovariectomized rats suggested no indirect action of genistein via increased circulating 17β-estradiol. The study authors concluded that genistein acts via an ER-based mechanism to stimulate mammary gland proliferation and differentiation, which may protect against mammary cancer.
In conclusion, the studies from the laboratory of Lamartiniere were interpreted by the authors as suggesting that acute s.c. exposure of immature animals to 500 mg/kg bw genistein resulted in increased differentiation of immature terminal end buds, leading to a greater number of lobules, thought to be more resistant to carcinogens, during adulthood. It appeared that the effects were mediated through ERs, which regulate progesterone receptor and EGF receptor. Up-regulation of EGF receptor in immature rats did not occur through tyrosine phosphorylation. EGF receptor was down-regulated in adult rats, and the authors hypothesized that a less active EGF-signaling pathway in adulthood suppressed mammary cancer development (Lamartiniere, 2000).
Strengths/Weakness
A common strength of the studies was an acceptable number of animals per treatment condition. Strengths noted in several studies were examination of endpoints such as proliferative index of cells in terminal end buds, ducts, and lobules (Brown and Lamartiniere, 1995; Lamartiniere et al., 1995b; Murrill et al., 1996); estrous cycles, ovarian effects, and hormonal status (Lamartiniere et al., 1995b; Murrill et al., 1996); and mechanisms of action such as role of ER, progesterone receptor, TGF, or EGF (Brown et al., 1998; Cotroneo et al., 2002). A common weakness of all the studies included testing of only 1 high dose level that was not relevant to human exposures. Experimental designs were problematic because administration every other day for 3 days is not a mode of exposure that is applicable to humans. Dimethyl benzanthracene was administered only on PND 50, while PND 21 might have been a more susceptible age.
Utility (Adequacy) for the CERHR Evaluative Process
These studies are of limited utility to the evaluation process. Although the dose of genistein used was too high to be relevant for human exposure, the phenomenon examined, which was well described in the first paper (Lamartiniere et al., 1995b), may be relevant in search of the mechanism of action of genistein on breast cells. Three of the subsequent papers, two looking in more detail at possible molecular mechanisms (Lamartiniere et al., 1995a; Brown et al., 1998) and one comparing genistein to other compounds (Brown and Lamartiniere, 1995) might also provide information on mechanisms. Moreover, the data showed that the effects might not be protective at all ages. Considering that the full understanding of a phenomenon requires going beyond its description by identifying the cellular and molecular mechanisms mediating the effects observed, this work is of some interest.
Cabanes et al. (2004), supported by the Komen Breast Cancer Foundation, the American Institute for Cancer Research, and the Cancer Prevention Foundation of America, examined mechanisms of breast cancer inhibition following prepubertal genistein exposure in rats. Female Sprague-Dawley rat pups were cross-fostered to dams on PND 2. [The number of litters represented was not specified.] On PND 8–20 [day of birth not defined], the pups were s.c. injected with peanut oil (vehicle control), genistein [purity not specified] 50 μg/day, or 17β-estradiol 10 μg/day. Based on actual body weights of animals on the first and last days of treatment, the study authors estimated that the doses received were 1.25–3.3 mg/kg bw genistein and 0.25–0.67 mg/kg bw 17β-estradiol. [The dams were fed Purina 5001 chow, but the feed given to pups following weaning was not specified.] Rats were killed at 3 and 8 weeks of age (n = 6 or 7/group/time period) to obtain mammary glands for morphology evaluation and mRNA and protein isolation. Mammary gland expression of BRCA1, a tumor-suppressor gene involved in DNA damage repair, was determined by RNase protection assay. ERα expression in mammary gland was determined using immunocytochemistry and Western blot methods. Rats treated with 17β-estradiol were evaluated at more time periods and for more parameters, but because genistein is the focus of this report, 17β-estradiol results are only discussed for parameters and ages for which genistein was also evaluated. Data were analyzed by 1- or 2-way ANOVA.
Tumorigenesis following treatment with dimethyl benzanthracene was examined in the rats treated with 17β-estradiol. Similar to results noted in a previous study with genistein treatment of immature rats (Murrill et al., 1996), 17β-estradiol treatment decreased the risk of developing dimethyl benzanthracene-induced tumors. There were no detected effects on mammary structures at 3 weeks of age. At 8 weeks of age, genistein treatment significantly reduced mammary epithelial density and terminal end bud numbers and increased lobuloalveolar structures; 17β-estradiol treatment significantly reduced terminal end bud numbers. Expression of BRCA1was significantly up-regulated in the genistein and 17β-estradiol groups at 3 and 8 weeks of age [~1.5–1.75-fold increases in genistein compared to control group]. Genistein treatment induced a significant increase in ERα protein expression in lobules at 8 weeks of age [~1.5-fold increase compared to control group]. Expression of ERα protein in ducts was significantly decreased in 8-week-old rats that received 17β-estradiol treatment. The study authors concluded that increased expression of BRCA1 may be a mechanism of reduced mammary cancer risk in rats following prepubertal genistein exposure.
Strengths/Weaknesses
A strength of this study is that the number of animals per condition was acceptable. The genistein dose was relevant to human exposure although the s.c. route was not. Results were compared with those of 17β-estradiol. Endpoints evaluated included general reproductive parameters (organ weight, vaginal opening, 17β-estradiol levels). The study examined potential molecular targets (e.g., BRCA1, ERβ) of genistein in mammary gland but not at all time points. A weakness of the study is that only one dose level was tested. The study did not examine all endpoints (BRCA1, tumorigenesis, ERβ expression) in genistein-exposed rats. Because of data in other published reports, tumor incidence following genistein exposure should have been tested and data should have been presented for a few time points. Similarly, changes in mammary epithelial trees were not evaluated at 3 weeks, although previous studies showed that the response at that age differed from that of older rats. Although the abstract stated that both 17β-estradiol and genistein up-regulated BRCA1 expression at 3, 8, and 16 weeks, no data were shown for genistein at 16 weeks. Considering that 17β-estradiol and genistein were reported to have opposite effects on ERα expression, it is not possible to extrapolate that they would have the same effect on BRCA1 expression at all ages. Rats were maintained on Purina 5001 chow, which is an “open diet” with variable ingredients; thus, the proportion of genistein may have varied from batch to batch and could not be estimated.
Utility (Adequacy) for CERHR Evaluation Process
This study is of limited utility due to lack of dose–response information and missing critical time points for genistein-exposed rats. However, the study presents some additional mechanistic information to explain possible protective effects of prepubertal genistein exposure against breast tumor formation.
3.2.3 Brain structure/behavior
A number of studies examined the effects of genistein exposure on brain structure or behavior. Dietary exposure studies are followed by s.c. exposure studies. Studies where exposures began during prenatal development are presented before studies with exposures that began in the postnatal period.
Flynn et al. (2000a), supported by NIEHS and FDA, fed a soy- and alfalfa-free diet to female Sprague-Dawley rats for 2 weeks prior to mating. Dietary concentrations of genistein and daidzein were below the 0.5 ppm limit of detection. Genistein (99% purity) was added to the diet beginning on GD 7 (plug = GD 0) at concentrations of 0 (n = 12), 25 (n = 11), 250 (n = 12), or 1250 (n = 12) ppm. The authors estimated that a 250 g rat would consume 20 g feed/day, giving estimated genistein intakes of 0, 2, 20, and 100 mg/kg bw/day. Litters were culled to four males and four females on PND 2 (day of birth = PND 1). Fostering of pups was used rarely to maintain litter size and distribution; most pups were reared by their own dams. Offspring were weaned on PND 22 to the same diet fed to the dam until the offspring were killed on PND 77. Animals were housed with same-sex siblings, two to a cage. Behavioral testing was performed as follows:
Open-field activity: One male and 1 female per litter were tested on PND 22–24, PND 43–45, and PND 65–67 (a different pair was used at each age).
Play behavior: Two males and two females were individually housed on PND 34. After 24 hr of isolation, animals were reunited with their same-sex sibling, and number of pins was counted over 5 min.
Running-wheel activity: One male and one female from each litter were housed individually in a cage with a running wheel on PND 63. Number of wheel revolutions by 12-hr photoperiod was counted over the next 14 days.
Taste: One male and one female from each litter were given access to two drinking water options, one containing regular water and the other containing either 0.03% saccharin (PND 69–71) or 3% saline (PND 73–75). Fluid intake from each bottle was measured using bottle weight and expressed as mL/kg bw/day, using the PND 70 body weight determination.
Statistical analysis was performed using ANOVA or multivariate techniques for repeated measures. Post-hoc Dunnett test was used for comparisons with the control group.
Dam body weight was significantly decreased in the 1250 ppm group compared to the control on GD 21, and feed intake was significantly decreased in this dose group on PND 15–21 (during which time pups probably contributed to feed intake). There were no detected treatment-related effects on gestational duration, total pups/litter, live pups/litter, or sex ratio, but average weight per live pup was reduced at the 1250 ppm dose (mean± SEM 5.86± 0.18 g compared to the control weight of 6.52± 0.18 g, P < 0.05). [Benchmark dose4 calculations: BMD10 1226 ppm, BMDL10 912 ppm, BMD1 SD 1215 ppm, and BMDL1 SD 844 ppm.] Beginning on PND 42, offspring body weight until termination at PND 77 was reduced in both males and females at the high dose. [A benchmark dose was not calculated due to difficulty estimating the underlying data points from the figures.]
There was no detected effect of treatment on open field or running wheel activity either in the dark or light photo periods. The number of pins in 5 min showed a treatment effect using ANOVA, but there were no detected differences of any dose group from control on post-hoc testing. There was no detected treatment-related taste preference for saccharin-treated water, but saline ingestion was increased by treatment at the 1250 ppm genistein level. The authors found this effect to be consistent with the known role of perinatal estrogens in increasing adult salt consumption and postulated that the genistein exposure in this study feminized males and hyper-feminized females in this regard. They cited studies with similar effects on salt consumption after perinatal exposure to other estrogenic compounds. The lack of detected genistein effect on the other behaviors, which showed sexual dimorphism in control animals in this study or in other studies, was interpreted by the authors as possibly due to the relative weakness of genistein as an estrogen or to its primary activity at ERβ rather than the ERα. [Some of these data were presented again by Slikker et al. (2001).]
Strengths/Weaknesses
Strengths were adequate numbers of rats/group (11–12 dams/group), consideration of the dam as the experimental unit, and use of multiple behavior tests. A weakness of the study is uncertainty about exposures due to administration through feed without monitoring of feed consumption. The highest dose level was not relevant to human exposure. The very broad exposure period, occurring from GD 7 to adulthood, made data interpretation difficult.
Utility (Adequacy) for CERHR Evaluation Process
This study is of some utility in the evaluation process. Because the only clear effects were seen with a dose higher than is expected for human exposures, it is suggested that typical long-term human exposures will not induce adverse behavioral effects.
Scallet et al. (2004), supported by NIEHS, NTP, and NCTR, examined the effects of genistein on the sexually dimorphic nucleus of the hypothalamus. Sprague-Dawley rats were fed 5K96, a feed similar to the NIH 31 feed, except that it contains casein instead of soy meal and alfalfa and corn oil instead of soy oil. The feed was reported to contain genistein 0.54 μg/g and daidzein 0.48 μg/g. From 28 days prior to mating and during gestation and lactation, 10 dams/group were fed diets containing genistein (>99% purity) at 0, 5, 100, or 500 ppm. Litters were culled to four males and four females on PND 2. On weaning, 10 male offspring/group and 5 female offspring/group from different litters were given the same diets as dams until they were killed on PND 140. Brains were removed, sectioned, and labeled with calbindin. Volume of calbindin-positive cells in the SDN-POA was measured using a 3-D imaging system. Data were analyzed by 2-way ANOVA, followed by post-hoc Fisher least significant difference test if significant interactions were observed. In control rats, the volume of calbindin-positive cells in the SDN-POA was higher in males versus females. Genistein treatment resulted in a significant increase in the volume of calbindin-positive cells in males from all dose groups [~2–2.5-fold increase]. No significant effects were observed in females.
Strengths/Weaknesses
Strengths of the study include adequate numbers of animals/group, use of several dose levels relevant to human exposure, and comparison with another estrogenic agent (p-nonylphenol). A weakness is that the broad time-frame of exposure, from 28 days before mating of females through PND 140 in the offspring, did not allow identification of sensitive developmental periods. The study is limited by examination of only one endpoint (size of sexually dimorphic nucleus by measuring calbindin-positive neurons).
Utility (Adequacy) for CERHR Evaluation Process
This study is of limited utility in the evaluation process. Increased calbindin-positive cells following life-long genistein exposure in male rats suggested an effect of genistein on brain development at doses relevant for human exposure. However, these data did not agree with earlier reports on adult exposure, and the life-long exposure paradigm used did not permit a clear explanation for the discrepancy.
Takagi et al. (2005), supported by the Ministry of Health, Labor, and Welfare of Japan, examined the effect of perinatal genistein exposure on gene expression in the hypothalamic preoptic area of rats. Pregnant Sprague-Dawley rats were received on GD 3 (day of vaginal plug = GD 0) and fed a soy-free diet containing corn and wheat in place of soybean meal and corn oil in place of soy oil. Dams randomly assigned to groups (n = 3/group) were fed the soy-free diet treated with genistein 0 or 1000 ppm (97% purity) from GD 15 to PND 10. Dose selection was based on a previous study that demonstrated reduced body weight but no effect on endocrine-related parameters in male rats following perinatal exposure to ≤1000 ppm genistein. Pups were killed on PND 10 and RNA was extracted from the hypothalamic preoptic area. An RT-PCR technique was used to measure expression of mRNA for ERα, ERβ, progesterone receptor, and steroid receptor coactivator in 6 pups/group. [It is not certain if the authors meant 6 pups/sex/group, and the number of litters represented was not stated]. Data were analyzed by Bartlett test, ANOVA, Dunnett test, Kruskal-Wallis H-test, or Student t-test. Genistein treatment had no detected effect on gene expression in the hypothalamic preoptic area of PND 10 rat offspring. In the same study, perinatal treatment of rats with 0.5 ppm ethinyl estradiol resulted in sexually dimorphic expression of ERα and progesterone receptor. The study authors concluded that genistein exerted no clear effect on gene expression in the hypothalamic preoptic area of perinatally exposed rats.
Strengths/Weaknesses
The dosing period, while limited, covered a critical period for brain sexual differentiation. According to the authors, the purity of genistein was >97%. Soy-free diet was used. Expression of target gene mRNA was normalized to two housekeeping genes (hypoxanthine-guanine phosphoribosyl transferase and glyceraldehyde-3-phosphate dehydrogenase), as well as input amount of total RNA. The results were consistent with the authors’ previous findings with genistein in that exposure to 1000 ppm genistein using this exposure paradigm did not produced endocrine or reproductive effects in offspring of either sex. This study used a single dose level, but was conducted as a follow-up study to a genistein study that used multiple dose levels (Masutomi et al., 2003). Diets were not analytically characterized (e.g., concentration verification, stability, homogeneity). Feed consumption was not reported, so delivered dose cannot be determined. There was no adjustment to feed concentrations to account for the large increase in feed consumption that occurs during lactation. It is not clear whether the authors controlled for litter effect. Sample sizes were small (3 dams/treatment group). The authors reported using n = 6/group for real-time RT-PCR; however, it was difficult to discern whether “6 pups/group” refers to one male and one female pup from each litter or 6 pups/sex/group, which would equate to two males and two females from each litter (assuming all three dams delivered viable litters). The number of litters was not given, nor was there any litter information provided (e.g., litter sizes, pup body weights). There was no indication that litters were culled.
Utility (Adequacy) for CERHR Evaluation Process
This study is of limited utility and is useful only in conjunction with previous Masutomi et al. (2003) and Takagi et al. (2004) studies.
Levy et al. (1995), supported by Duke University and the Public Health Service, treated pregnant Charles River CD rats with s.c. genistein 25 mg/animal/day, genistein 5 mg/animal day, diethylstilbestrol 5 μg/animal/day, estradiol benzoate 50 μg/animal/day, or corn oil vehicle (n = 4 animals/treatment) on GD 16–20 (or GD 15–20 for two of the diethylstilbestrol-treated animals). [Chemical purities were not specified; plug day was not specified. Estimated maternal weight-adjusted doses were 75 and 15 mg/kg bw/day for genistein, 15 μg/kg bw/day for diethylstilbestrol, and 150 μg/kg bw/day for estradiol benzoate.] Dams were allowed to deliver their litters (PND 1 if observed before noon). Pups were weighed and anogenital distance measured on PND 1. Pups were presumably nursed by their own dams without culling and were weaned on PND 21. Litters were divided into two groups. [It was not stated whether whole litters were assigned to different groups or proportions of pups within each litter were assigned to different groups; it was also not stated whether the assignment to the two groups was random or resulted in equal numbers of litters or pups in the two groups.] One group underwent castration [possibly on the day of weaning; the text is not clear on this point], and on PND 42, the right heart was cannulated. Four hours later, blood was collected from the cannula for determination of LH, and GnRH was administered. Blood was collected 5, 10, 15, and 30 min later, and LH was determined by RIA. The animals were decapitated under anesthesia, and brains were removed and blocked. Sections were taken for determination of the volume of the SDN-POA. In the second group of animals, females were separated from males and monitored for vaginal opening. After vaginal opening, daily vaginal smears were taken for a characterization of the estrous cycle until PND 90.
Statistical comparisons were made by ANOVA with post-hoc Fisher least-significant difference test, except for age at vaginal opening (Kruskal-Wallis followed by Mann-Whitney U-test) and vaginal cyclicity (compared “qualitatively”). [Comparisons were made by treatment group without apparent regard to litter of origin.]
Diethylstilbestrol and estradiol benzoate were said to delay parturition and increase rates of stillbirth and pup death before PND 10 [data not shown]. There was a decrease in the birth weight of female pups after exposure to genistein 25 mg/dam/day [estimated from a figure as a 14% decrease in weight]. Diethylstilbestrol and estradiol benzoate were associated with a larger decrease in birth weight in both sexes. Anogenital distance was decreased by diethylstilbestrol, estradiol benzoate, and genistein at 5 mg/dam/day in males and females, but no effect of genistein at 25 mg/dam/day was detected. None of the treatments had an effect on the response of LH to GnRH in females. Diethylstilbestrol and estradiol benzoate increased the volume of the SDN-POA in females but not males, and no affect of either genistein treatment on the volume of this nucleus in either sex was detected. Vaginal opening was delayed an average of 1.8 days by genistein at 5 mg/dam/day, but was not shown to be influenced by any of the other treatments. The corn oil and genistein groups were described as having estrous cycles between 3–5 days in length.
The authors concluded that differences in responses to genistein, diethylstilbestrol, and estradiol benzoate demonstrate that all estrogens do not share the same biologic properties. The authors could not explain the failure of the higher dose of genistein to exert the effects seen with the lower dose but indicated that there may have been kinetic issues or interactions with the corn oil vehicle. They also indicated that phytoestrogens in the Purina Laboratory chow given to their animals may have influenced the observed effects.
Strengths/Weaknesses
A strength of the study was the well-defined exposure period (4 gestation days). Genistein results were compared with those of estradiol benzoate and diethylstilbestrol. The numbers of animals used were small but adequate. Weaknesses of the study were that the diethylstilbestrol dose was too high and the s.c. dose route was not relevant to human exposure.
Utility (Adequacy) for CERHR Evaluation Process
This study has utility in demonstrating that genistein did not have much of an effect on sexual dimorphism. Because results were contrary to those obtained with estradiol benzoate and diethylstilbestrol, differences in mechanism of action between compounds were suggested. Genistein did affect anogenital distance, body weight, and onset of puberty.
Becker et al. (2005), supported by the University of Evansville and NIH, evaluated effects on neonatal behavior of dam treatment with a dietary phytoestrogen supplement during pregnancy. Female Sprague-Dawley rats were randomized to one of three diets from the beginning of the second week of pregnancy until weaning. Two of the diets were described as “normal” and consisted of commercial chows (Harlan-Teklad 8604, n = 4 dams, and Purina 5001, n = 8 dams). The third diet was a low-phytoestrogen chow (Harlan-Teklad 2014, n = 21 dams). Eleven of 21 dams receiving the low-phytoestrogen diet were given two daily phytoestrogen supplement tablets, which together contained daidzein 34 mg, glycitein 20 mg, and genistein 8 mg. Complete consumption of the supplement tablets was assumed based on failure to find tablet remnants in the cages. Daily genistein intakes were estimated based on mean daily feed intake and supplement composition to be 19.45 μg in the rats on the low-phytoestrogen diet, 322.26 μg in the rats given the “normal” diets, and 1287.30 μg in the rats given the low-phytoestrogen diet plus the phytoestrogen supplements. [Dam body weights were not given. Assuming a dam body weight of 250 g, genistein intakes would have been 0.08 mg/kg bw/day on the low phytoestrogen diet, 1.3 mg/kg bw/day on the “normal” diets, and 5.1 mg/kg bw/day on the phytoestrogen-supplemented diet.] Dams were permitted to litter, and pup anogenital distance and body weight were measured on the day pups were found (PND 1). At 24–48 hr of age, litters were standardized to five males and five females, with fostering of pups within treatment groups if necessary to achieve standard litters. Litters were eliminated from consideration if pup counts fell below 8. Righting reflex was assessed in one male and one female pup from each litter on PND 3, 5, and 7. Ultrasonic vocalizations on separation from the dam were counted on PND 5, 10, and 15. Litters were weaned on PND 21–22. Between PND 70 and 100, males were anesthetized and cardiac puncture used to obtain blood samples for measurement of plasma corticosterone and testosterone. Statistical analysis was performed with Dunnett t-test.
There were no detected treatment-related differences in length of gestation or number of male or female offspring. The groups that received the low-phytoestrogen diet had lower percentages of deliveries and of litters surviving to testing than did the groups that received the “normal” diets, attributed by the authors to the lower protein content of the low-phytoestrogen diet. Anogenital distance corrected for body weight was increased in males and females on the low-phytoestrogen diet without phytoestrogen supplementation compared to the “normal” diets. Pups in the “normal” diet groups gained more body weight during the lactation period than pups in the low-phytoestrogen group, with pups from the phytoestrogen-supplemented group intermediate in body weight between the other two treatment conditions. Righting reflex did not show significant treatment effects. Pups of both sexes from the low-phytoestrogen group emitted more ultrasonic vocalizations at most tested times, although not all of the apparent differences were statistically significant. When dams were given phytoestrogen supplements and the low-phytoestrogen diet, pup vocalizations were similar to those in the “normal” diet groups. There were no detected treatment-related changes in plasma corticosterone or testosterone.
The authors speculated that rats in the low-phytoestrogen group did not experience the anti-anxiety effects of dietary estrogens, resulting in increased ultrasonic vocalizations in pups after separation from the dam. The authors acknowledged that they could not separate estrogen exposure of the dam from exposure of the pups through milk or through direct consumption of supplement pills during the latter part of the lactation period.
Strengths/Weaknesses
A strength of the study is use of adequate numbers of animals. Two dose levels of genistein were tested, both in the relevant range, but mixed with other ingredients. Classic reproductive endpoints were examined (anogenital distance, body weight, plasma steroids) as well as two novel endpoints representative of behavior: the measure of ultrasonic vocalization (anxiogenic reflex) and righting reflex (motor development). A weakness is that actual exposure levels are uncertain due administration of genistein through feed and tablets.
Utility (Adequacy) for CERHR Evaluation Process
This study is of limited utility due to the uncertainty about doses. Speculation is required in interpretation of this study, but the results suggest caution regarding consumption of phytoestrogen tablets.
Faber and Hughes (1991), in a study funded by the Duke University Medical School Research Fund, examined the effects of genistein, estradiol, diethylstilbestrol, and zearalenone on the physiology and morphology of the hypothalamus and pituitary of rats. Male and female CD rats were s.c. injected with genistein [purity not specified] daily in corn oil at 0, 100, or 1000 μg on PND 1–10. [Pup weights were not given. Assuming pup body weights of 6 g at delivery and 15 g at PND 7, the genistein doses would have been 0, 17, and 167 mg/kg bw/day on PND 1 and 0, 7, and 67 mg/kg bw/day on PND 7. The isoflavone content of the feed was not specified.] Rats were castrated on PND 21. On PND 42, rats received cardiac catheters and were randomly given i.v. saline or GnRH. Blood samples were collected before and 5, 10, 15, and 30 min following GnRH or saline treatment. Fifteen minutes following collection of the last blood sample, animals treated with saline received GnRH and vice versa. Serum was analyzed for LH by RIA. Data were analyzed by 1-way ANOVA, Student t-test, Kruskal-Wallis 1-way ANOVA, or the Wilcoxon sign-rank test. Rats were killed on PND 49 and brains were fixed in formalin, sectioned, and stained with crystal violet acetate. SDN-POA volume was evaluated by an investigator blinded to treatment conditions, and data were compared by parametric analysis, confirmed by Kolmogorov-Smirnov testing. Serum LH levels in response to GnRH treatment were evaluated in 7–15 rats/sex/group.
In both males and females, treatment with 100 μg genistein significantly increased LH secretion compared to controls [~3.5-fold in males and 2-fold in females when evaluated as AUC]. No increase in serum LH levels was noted in rats from the 1000 μg genistein groups. LH responses in the 1000 μg genistein groups were similar to those in rats treated with ≥100 μg zearalenone. SDN-POA volumes were evaluated in 6–11 rats/sex in the control and 1000 μg genistein groups and in 3–4 rats/sex in the 100 μg genistein groups. SDN-POA volume was significantly increased in female rats from the 1000 μg genistein group. No other significant changes were noted for SDN-POA volume in rats treated with genistein, but the study authors noted that only three males were included in the 100 μg genistein group. SDN-POA volume effects in females from the 1000 μg genistein group were similar to those of females in the 0.1 μg diethylstilbestrol and 1000 μg zearalenone groups. The study authors concluded, “These data show that exposure to environmental estrogens early in development alters postpubertal response to GnRH and ‘androgenizes’ the SND-POA.”
Strengths/Weaknesses
Strengths of this study include use of adequate numbers of animals, a well-defined window of exposure (PND 1–10), and comparison of results with two other compounds (diethylstilbestrol and zearalenone). The s.c. route of administration is not relevant to human exposure.
Utility (Adequacy) for CERHR Evaluative Process
This study is of some utility in the evaluation process. It showed that a relatively low genistein dose triggered an increase in LH secretion, while a high dose (not relevant to humans) triggered changes in SDN-POA of females, a morphologic marker of central nervous system differentiation. These changes could have repercussions for reproductive behavior and function.
Faber and Hughes (1993), funding source not identified, treated female CD rat pups with s.c. oil vehicle or genistein [purity not given] from the day of delivery (PND 1) through PND 10. Daily genistein doses were 0 (n = 9), 1 (n = 5), 10 (n = 6), 100 (n = 9), 200 (n = 5), 400 (n = 9), 500 (n = 6), or 1000 (n = 7) μg. [Pup weights were not given. Assuming pup body weight of 6 g at delivery and 15 g at PND 7, genistein doses would have been 0, 0.17, 1.7, 17, 33, 67, 83, and 167 mg/kg bw/day at delivery and 0, 0.07, 0.7, 7, 13, 27, 33, and 67 mg/kg bw/day on PND 7.] All females from each of two litters were represented in each dose group. Animals were ovariectomized on PND 21, and on PND 42 right atrial cannulas were placed under ketamine anesthesia. Four hours later, animals were injected through the cannulas with saline or GnRH. Blood samples were collected for measurement of LH prior to saline/GnRH, and 5, 10, 15, and 30 min after injection of saline/GnRH. On PND 49, animals were killed and the volume of the SDN-POA was estimated from cresyl-violet stained brain sections. LH concentrations and SDN-POA volumes were compared using ANOVA.
Basal LH concentrations were higher than the control value after treatment with 100 or 400 μg genistein. There was an increase in serum LH after GnRH in all groups except the group treated with genistein 1000 μg. The LH response to GnRH peaked at 5 or 10 min. There was an interaction of time from GnRH administration and genistein dose through 10 min. Thereafter, there was no detected relationship between LH concentration and treatment group. [The study abstract indicates that progressive exposure to genistein was associated with a suppression of LH response to GnRH; however, data were not presented in the paper to support this point, and the data figure did not appear to support this point.] The volume of the SDN-POA was significantly increased in the groups exposed to 500 and 1000 μg/day genistein. Volumes estimated from a graph in the paper are indicated in Table 59. [Benchmark dose5 calculations are BMD10 258 μg/pup/day, BMDL10 74 μg/pup/day, BMD1 SD 708 μg/pup/day, and BMDL1 SD 424 μg/pup/day.]
Table 59.
Volume of the SDN-POA in PND 49 Female Rats after Exposure to Genistein
| Daily genistein dose (μg/pup) | na | Volume (mm3 × 10−3) mean± SEMb |
|---|---|---|
| 0 | 9 | 4.2± 1.2 |
| 1 | 5 | 4.3± 1.2 |
| 10 | 6 | 5.1± 0.4 |
| 100 | 9 | 6.5± 0.8 |
| 200 | 5 | 5.9± 0.7 |
| 400 | 9 | 4.6± 0.8 |
| 500 | 6 | 7.5± 0.7c |
| 1000 | 7 | 9.2± 0.8c |
Assumed from data presented for LH response to GnRH.
Data were estimated from a graph by CERHR.
Significantly different from control.
From Faber and Hughes (1993).
Strengths/Weaknesses
Strengths of this study include use of adequate numbers of animals, relevant time-frame of treatment (PND 1–10), examination of several parameters (GnRH response, SDN-POA), and the large range of genistein doses, which were lower than in a previous study. The s.c. route of administration is not relevant to human exposure.
Utility (adequacy) for CERHR Evaluation Process
This study showed that low genistein doses had non-androgenic, pituitary-sensitizing effects, but higher doses mimicked typical estrogen effects in masculinizing the brain. Dose-dependent differences were illustrated in this study.
Patisaul et al. (2006), supported by the American Chemistry Council, evaluated the effect of neonatal genistein on the anteroventral periventricular nucleus of the Sprague-Dawley rat. Pregnant rats (n = 5) were fed a phytoestrogen-free diet (Purina 5K96) during the last week of gestation and were permitted to litter. Pups were cross-fostered among all dams so that four dams reared six females and six males and one dam reared five males. Pups (n = 5–8/group) were randomly assigned to receive s.c. injections every 12 hr of 17β-estradiol 50 μg/pup/injection, genistein 250 μg/pup/injection, bisphenol A 250 μg/pup/injection, or sesame oil vehicle. The authors estimated that the twice daily dosing with 250 μg/pup was approximately equivalent to 100 mg/kg bw/day. Injections began the morning of PND 1 (delivery = PND 0). On PND 19, the pups were transcardially perfused with ice-cold saline followed by paraformaldehyde. Brains were post-fixed in 20% sucrose in paraformaldehyde, sectioned coronally, and processed for immunohistochemistry for ERα and tyrosine hydroxylase. Sections were counterstained with Nissl stain. Cells of the anteroventral periventricular nucleus positive of ERα, tyrosine hydroxylase, or both were counted. Statistical analysis used 2-way ANOVA with sex and treatment as factors followed by 1-way ANOVA and post-hoc Fisher least significant difference test.
There was a significant effect of sex on tyrosine hydroxylase-positive cells in the anteroventral periventricular nucleus with the number in males about 29% that of females [estimated from a graph]. The effects of treatment are summarized in Table 60. The authors concluded that neonatal treatment with genistein interfered with the normal testosterone-associated masculinization of the anteroventral periventricular nucleus. Because 17β-estradiol is aromatized to testosterone in the brain, the authors interpreted this effect of genistein as anti-estrogenic. Cells staining for both ERα and tyrosine hydroxylase are not present in rodents after puberty, and the authors believed that these cells may play a role in the organization of the LH-surge. They postulated that the decrease in these cells with neonatal exposure to genistein may result in cycle disruption in adulthood.
Table 60.
Effect of Neonatal Treatments on the Rat Anteroventral Periventricular Nucleus
| Females
|
Males
|
|||
|---|---|---|---|---|
| Endpoint | 17β-Estradiol | Genistein | 17β-Estradiol | Genistein |
| Number of cells positive for: | ||||
| Tyrosine hydroxylase | ↓50% | ↔ | ↔ | ↑ 2.1-fold |
| ERα | ↔ | ↔ | ↔ | ↔ |
| Both | ↓38% | ↓31% | ↔ | ↔ |
| Percent of cells positive for ERα+tyrosine hydroxylase | ↔ | ↓48% | ↔ | ↓50% (P = 0.1) |
↑,↓,↔ Statistically increased, decreased, unchanged compared to within-sex sesame oil control; P < 0.05 except where noted.
Estimated from graphs in Patisaul et al. (2006).
Strengths/Weaknesses
Strengths include use of phytoestrogen-free chow and use of 17β-estradiol as a positive compound. Weaknesses include administration of genistein by s.c. injection, the use of only a single genistein dose level, lack of adjustment for body weight, and examination of only a small portion of postnatal development.
Utility (Adequacy) for CERHR Evaluation Process
This report is not useful for the CERHR evaluation process.
3.2.4 Other endpoints
Chang and Doerge (2000), from the FDA, examined the effects of in utero, postnatal, and adult exposure to genistein on thyroid function in rats. Sprague-Dawley rats were fed a soy- and alfalfa-free diet containing genistein (>99% purity) at concentrations of 0, 5, 100, or 500 μg/g feed [ppm] during gestation and lactation. From weaning until 20 weeks of age, 6 pups/sex/group were fed diets containing the same genistein doses as their mothers. [Based on assumed body weight (0.056 kg) and feed intake (0.0083 kg/day) of a weanling pup (EPA, 1988), genistein intakes were estimated at ~0.75, 15, and 75 mg/kg bw/day for weanlings. Based on adult weights and feed intake (0.204 kg and 0.0200 kg/day for females; 0.267 kg and 0.0230 kg/day for males), genistein intakes in adulthood were estimated at ~0.5, 10, and 50 mg/kg bw/day.] The study authors indicated that serum genistein levels in rats (discussed in Section 2) in the 0 and 5 ppm groups were equivalent to serum levels of humans consuming a typical Western diet. The 100 ppm concentration resulted in serum levels equivalent to individuals consuming a typical Asian diet or soy supplements. The 500 ppm level resulted in serum levels similar to those in infants fed soy formula. Genistein levels in blood and serum were measured by HPLC with electrospray MS detection. Microsomal thyroid peroxidase activity was determined by a spectrophotometric method measuring oxidation of guaiacol. Data were analyzed using 2-way ANOVA and Dunnett test.
As noted in greater detail in Section 2, dose-related increases in genistein were observed in both serum and thyroid. A dose-dependent and significant reduction in thyroid peroxidase activity was observed at all dose levels, with activity in the high-dose group reduced by ~80% compared to controls. Loss of activity was significantly greater in females than in males and was consistent with higher levels of serum and thyroid genistein levels measured in females. The study authors reported that genistein had no effect on serum levels of triiodothyronine, thyroxine, and thyroid-stimulating hormone. [Methods for analysis of thyroid hormones were not discussed and data were not shown.] An additional range-finding study was conducted to determine if genistein effects on thyroid peroxidase activity were dependent upon stage of development, and it was found that effects were similar if genistein exposures occurred during adulthood or from GD 5 through adulthood [data were not shown]. A reduction in thyroid peroxidase activity was also observed in rats fed a soy-based diet containing 30 ppm genistein in glycosidic form, as discussed in greater detail in the Expert Panel Report on Soy Formula. An in vitro study demonstrated that thyroid peroxidase activity was inactivated by genistein at concentrations similar to those measured in thyroids of rats exposed to genistein in diet. The study authors concluded that the remaining thyroid peroxidase activity following genistein exposure was sufficient to maintain thyroid homeostasis. The study authors suggested that consumption of isoflavones by humans could result in uptake by thyroid gland and inactivation of thyroid peroxidase.
Strengths/Weaknesses
Strengths of the study included use of soy- and alfalfa-free chow, determination of background genistein and daidzein levels in chow, use of three genistein doses (1, 100, and 500 mg/kg feed), and verification of genistein concentrations in chow. In addition, serum genistein levels were determined on PND 140.
Utility (Adequacy) for CERHR Evaluation Process
This study is of limited utility in determining developmental effects due to the endpoints analyzed, but data may be useful in interpreting other studies.
Guo et al. (2002), supported by the Jeffress Memorial Trust and NIEHS, examined the effects of genistein exposure on the immune system of developing and adult rats. Sprague-Dawley rats were fed a soy- and alfalfa-free diet. Rats were randomly placed into groups of eight that received genistein (95% purity) through diet during the entire gestation and lactation period at doses of 0, 300, or 800 ppm. [Based on dam body weights at necropsy and an assumed feed intake rate of 27 g/day (16% lower in the high-dose group) (EPA, 1988), genistein intake was estimated at 26 and 69 mg/kg bw/day in the low-and high-dose group.] Groups administered 300 ppm genistein+800 ppm methoxychlor and 800 ppm genistein +800 ppm methoxychlor were also examined. Concentrations of compounds in diet were verified. Dams and pups were killed on PND 22 [day of birth not defined]. Spleens and thymuses were collected for counting of thymocytes and splenocytes. Individual cell types were counted using monoclonal antibody labeling and flow cytometry. Natural killer cell activity was also determined. The numbers of animals examined for all parameters included 3–7 dams/group and 6–8 offspring/group. Statistical analyses included Bartlett test, 1-way ANOVA, Dunnett t-test, and Wilcoxon rank-test.
In dams of the 800 ppm genistein group, significant reductions were observed in terminal body weight [~10% lower than controls] and feed intake (16% lower than controls). Absolute thymus weight of dams was significantly reduced [~32%] in the 800 ppm group but thymus weight relative to body weight and absolute and relative spleen weights were not shown to be affected. No effects of genistein treatment were detected on numbers of maternal thymocyte subsets; spleen natural killer cell activity and percentage and number of splenic natural killer cells were also not shown to be affected [data not shown]. At 300 ppm genistein, the percentage of CD4−CD8+ cells in spleen was significantly reduced by 23% compared to controls. Significant effects on spleen cells at 800 ppm included a 36% decrease in numbers of CD4−CD8+ cells, a 58% increase in percentage of CD4+CD8+ cells, and a [39%] decrease in numbers of spleen cells. Additional effects observed in dams treated with 800 ppm genistein+800 ppm methoxychlor included decreases in relative thymus weight and in numbers of CD4+CD8− thymocytes.
Terminal body weights were significantly reduced in offspring of the 800 ppm genistein group [~14% in males and 10% in females compared to controls]. Genistein treatment alone had no detected effect on offspring spleen or thymus weights. Absolute spleen weight was reduced in male offspring exposed to 300 ppm genistein+800 ppm methoxychlor and 800 ppm genistein+800 ppm methoxychlor, and absolute thymus weight was reduced in male offspring exposed to 300 ppm genistein+800 ppm methoxychlor. Table 61 lists results of offspring thymocyte counts that were statistically significant at one or more genistein doses. Compared to controls, percentages of CD4+CD8− thymocytes were significantly reduced in both sexes exposed to 300 ppm genistein and males exposed to 300 and 800 ppm genistein (20–40% reduction in treated males and 35% reduction in treated females); numbers of CD4+CD8− cells were significantly reduced by 39–61% in males of both dose groups. Additional statistically significant effects on thymocytes in females of the 800 ppm group included a 14% increase in percentages of CD4+CD8+ cells and a 79% reduction in percentages and an 82% reduction in numbers of CD4−CD8− cells. Table 62 outlines natural killer cell activity at each effector:target cell ratio tested. Natural killer cell activity was increased in males but reduced in females exposed to genistein. No effects of genistein treatment alone were detected on the numbers and types of splenic cells in male or female offspring. Additional effects that were observed in offspring co-exposed to methoxychlor were significantly decreased numbers of CD4−CD8+, CD4+CD8+, and total thymocytes in males treated with 300 ppm genistein+800 ppm methoxychlor; decreased numbers of CD4+CD8− thymocytes in females treated with both combinations of genistein+methoxychlor; and increased numbers of natural killer cells and CD8+ ymphocytes in spleen of female offspring treated with 800 ppm genistein+800 ppm methoxychlor.
Table 61.
Significant Effects on Thymocytes of Rats Following Prenatal and Lactational Exposure to Genistein
| Genistein concentration in dam feed (ppm)
|
|||
|---|---|---|---|
| Cell type | 0 | 300 | 800 |
| Male offspring | |||
| CD4+CD8−, % | 6.0±0.5 | 4.1±0.2* | 3.9±0.4* |
| CD4+CD8−, n (×106) | 51.4±9.6 | 30.1±2.4* | 28.8±4.1* |
| Female offspring | |||
| CD4+CD8−, % | 8.3±1.2 | 5.4±0.3* | 5.8±0.9 |
| CD4+CD8−, n (×106) | 63.7±11.0 | 43.8±2.1 | 42.9±10.1 |
| CD4+CD8+, % | 74.2±3.5 | 75.1±1.9 | 84.7±1.2* |
| CD4+CD8+, n (×106) | 547.6±32.6 | 626.3±50.0 | 605.4±72.4 |
| CD4−CD8−, % | 9.4±2.4 | 9.7±1.5 | 2.0±0.4* |
| CD4−CD8−, n (×106) | 76.0±24.4 | 83.3±15.1 | 13.7±1.7* |
Table 62.
Effects of Prenatal and Lactation Exposure to Genistein on Spleen Natural Killer Cell Activity in Rats
| Effector:Target cells
|
||||
|---|---|---|---|---|
| Treatment (ppm genistein in feed) | 12.5:1 | 25:1 | 50:1 | 100:1 |
| Male offspring | ||||
| 0 | <1 | <1 | 1.4±0.7 | 3.7±0.9 |
| 300 | 1.0±0.4 | 1.7±0.7** | 3.1±0.6 | 5.4±0.9 |
| 800 | 1.4±0.3 | 1.7±0.4** | 3.9±0.7* | 6.7±1.0 |
| Female offspring | ||||
| 0 | 1.8±0.4 | 2.8±0.5 | 4.8±1.0 | 9.1±1.5 |
| 300 | <1** | <1** | 2.9±0.5 | 6.2±0.5 |
| 800 | <1** | <1** | 1.3±0.4** | 3.3±0.4** |
Data expressed as percentage of cell-specific lysis in mean±SE.
P≤0.05;
P≤0.01 compared to 0 ppm control.
From Guo et al. (2002).
The study authors concluded that genistein had immunomodulatory effects in rats that were dependent upon sex, age, and organ site, with greater effects observed in developing rats. It was noted that the lack of interaction between genistein and methoxychlor, which is also estrogenic, suggested that effects on the immune system involve mechanisms other than ER activation.
Strengths/Weaknesses
Strengths of the study included use of soy- and alfalfa-free chow and verification of genistein concentrations in chow. Weaknesses were that only two genistein doses (300, 800 mg/kg feed) were used, and data were not analyzed on a per litter basis.
Utility (Adequacy) for CERHR Evaluation Process
This study is of limited utility in determining developmental effects due to the endpoints analyzed, but data may be useful in interpreting other studies.
Guo et al. (2006), supported by NIH and NIEHS, evaluated the effects of dietary genistein on immune response in C57Bl/6 mice. Pregnant mice were obtained on GD 14 (plug = GD 0) and randomized to treatment groups of 4 or 5 mice/dose group. Animals received low-phytoestrogen chow (5K96, genistein and daidzein content determined to be ~0.5 ppm) to which genistein (>99% purity) was added at 0, 25, 250, or 1250 ppm [mg/kg feed; estimated by the study authors to provide genistein 0, 2, 20, or 100 mg/kg bw/day to a 25-g mouse]. The dams were continued on treated feed through the lactation period, and pups were weaned to their dams’ feed on PND 22. On PND 42, pups were killed and spleens and thymuses were removed from 1 or 2 pups/sex/litter for evaluation. Organs were disrupted between glass slides, and cells were suspended for Coulter counting. Immune cell types were stained with specific antibodies for quantification by flow cytometry. Natural killer cell activity was evaluated using release of tracer from 51Cr-labeled YAC-1 cells. Proliferation of splenocytes in response to anti-CD3 antibody was evaluated using 3H-thymidine incorporation. Statistical analysis was performed using 1-way ANOVA followed by Dunnett t-test or non-parametric ANOVA followed by Wilcoxon rank-test.
Dam body weights were increased at 250 and 1250 ppm genistein, and male pup body weights were increased at 25 and 250 ppm genistein. No effect of treatment on female pup body weight was detected. Spleen weight was increased by 250 ppm genistein in the dams and by 25 and 250 ppm in male pups. There were no detected alterations in dams or pups in relative spleen weight or in the pups in absolute or relative thymus weight. [Thymus weight was not determined in dams.] Immune cell results are summarized in Table 63. Because some effects were seen at a dietary genistein level of 25 ppm, an additional group of animals was exposed to 5 ppm genistein in the diet using the same protocol. [The number of animals was not given. The authors estimated genistein intake at 0.4 mg/kg bw/day for a 25-g mouse eating a diet containing 5 ppm genistein.] There were no detected effects on immune cell endpoints at this exposure level. The authors called attention to the sexually dimorphic effects of genistein on immune endpoints, attributing this dimorphism to pup endocrine differences. The lack of detected effect of the high dose on most pup endpoints was attributed possibly to other genistein activities such as tyrosine kinase inhibition that might be present only at high intake levels. The authors concluded that genistein could increase activities of natural killer cells and T cells in male pups and showed sex-specific modulation of immune development in mice.
Table 63.
Effect of Dietary Genistein on Immune Cell Endpoints in Mice
| Genistein level in diet (ppm)
|
|||||||||
|---|---|---|---|---|---|---|---|---|---|
| Dams
|
Male pups
|
Female pups
|
|||||||
| Cell type | 25 | 250 | 1250 | 25 | 250 | 1250 | 25 | 250 | 1250 |
| Splenocytes | |||||||||
| CD4+CD8− | |||||||||
| Number | ↔ | ↑1.7-fold | ↔ | ↔ | ↑1.9-fold | ↔ | ↔ | ↔ | ↔ |
| Percent | ↔ | ↓32% | ↔ | ↔ | ↔ | ↔ | 1.2-fold | ↔ | ↔ |
| CD4−CD8+ | |||||||||
| Number | ↔ | ↑1.7-fold | ↔ | ↑1.5-fold | ↑2-fold | ↔ | ↔ | ↔ | ↔ |
| Percent | ↔ | ↓33% | ↓12% | ↔ | ↔ | ↔ | ↔ | ↔ | ↔ |
| CD4+CD8+ | |||||||||
| Number | ↔ | ↑2-fold | ↔ | ↑1.4-fold | ↑1.8-fold | ↔ | ↔ | ↑1.7-fold | ↔ |
| Percent | ↔ | ↔ | ↓31% | ↑1.4-fold | ↔ | ↔ | ↔ | ↑1.6-fold | ↑1.4-fold |
| Natural killer cell | |||||||||
| Number | ↔ | ↑3.6-fold | ↔ | ↑1.7-fold | ↑1.2-fold | ↔ | ↔ | ↔ | ↔ |
| Percent | ↔ | ↔ | ↔ | ↑1.2-fold | ↑1.2-fold | ↔ | ↓30% | ↓19% | ↓30% |
| Activitya | ↔ | [↑1.6–2-fold]b | ↔ | [↑1.5–1.8-fold] | [↑1.7–2.1-fold]b | [↑1.7–2.2-fold]b | [↓36–62%] | ↔ | ↔ |
| Splenocyte | |||||||||
| Number | ↔ | ↑2.5-fold | ↔ | ↑1.3-fold | ↑1.8-fold | ↔ | ↔ | ↔ | ↔ |
| Proliferation | |||||||||
| Basal | ↔ | ↑2.1-fold | ↔ | ↔ | ↑1.5-fold | ↔ | ↔ | ↔ | ↔ |
| Stimulated | ↔ | ↔ | ↔ | [↑1.4-fold]b | [↑1.4-fold]b | [↑1.5-fold]b | ↔ | ↔ | ↔ |
| Thymocytes | |||||||||
| Number | ↔ | ↔ | ↔ | ↑1.7-fold | ↔ | ↔ | ↔ | ↓28% | ↔ |
| CD4+CD8− | |||||||||
| Number | ↔ | ↔ | ↔ | ↑1.5-fold | ↔ | ↔ | ↔ | ↔ | ↔ |
| Percent | ↔ | ↔ | ↔ | ↔ | ↔ | ↔ | ↔ | ↔ | ↔ |
| CD4−CD8+ | |||||||||
| Number | ↔ | ↔ | ↔ | ↑1.5-fold | ↔ | ↔ | ↔ | ↔ | ↔ |
| Percent | ↔ | ↔ | ↔ | ↔ | ↔ | ↔ | ↔ | ↑1.2-fold | ↔ |
| CD4+CD8+ | |||||||||
| Number | ↔ | ↔ | ↔ | ↔ | ↔ | ↔ | ↔ | ↓31% | ↔ |
| Percent | ↔ | ↔ | ↔ | ↑1.2-fold | ↔ | ↑1.3-fold | ↔ | ↓5% | ↔ |
| CD4−CD8− | |||||||||
| Number | ↔ | ↔ | ↔ | ↔ | ↔ | ↔ | ↔ | ↔ | ↔ |
| Percent | ↔ | ↔ | ↔ | ↓45% | ↓36% | ↓50% | ↑1.3-fold | ↑1.4-fold | ↔ |
| CD44+CD25− | |||||||||
| Number | ↑1.5-fold | ↔ | ↔ | ↔ | ↓42% | ↓44% | |||
| Percent | ↔ | ↔ | ↔ | ↔ | ↓18% | ↓25% | |||
| CD44+CD25+ | |||||||||
| Number | ↔ | ↔ | ↔ | ↔ | ↓62% | ↓75% | |||
| Percent | ↓42% | ↓35% | ↓44% | ↔ | ↔ | ↓64% | |||
| CD44−CD25+ | |||||||||
| Number | ↑1.3-fold | ↑1.4-fold | ↔ | ↔ | ↓34% | ↓41% | |||
| Percent | ↔ | ↔ | ↔ | ↔ | ↔ | ↔ | |||
↑, ↓, ↔ Statistically significant increase, decrease, or no change compared to 0 ppm control.
Range based on different effector:target cell ratios.
Estimated from a graph.
From Guo et al. (2006).
Strengths/Weaknesses
Strengths are that animals were maintained on a soy- and alfalfa-free diet, background concentrations of genistein and daidzein in the control diet were determined, genistein of high purity was administered in the diet, the route of exposure was relevant, genistein concentrations in the diet were confirmed analytically, and test diets were analyzed for stability. In an effort to control for litter effect, one or two mice per sex from each litter were randomly selected for evaluation. Genistein was used at multiple dose levels, which allows for an evaluation of dose–response relationships, and the exposure period included critical periods of development. Statistical analyses were appropriate. Weaknesses are that the day of birth was not specified as PND 0 or 1, the exposure estimates for the animals, which covered weaning through PND 42, were not well founded, and there were no data on maternal effects during gestation, litter parameters, or pup body weights prior to termination. In some cases, sample sizes were small and variability in some parameters was difficult to explain. Many of the parameters measured following genistein exposure do not follow traditional dose–response relationships. There was little consistency between effects on cell subpopulations in the spleen and thymus. In comparison with the earlier paper in rats (Guo et al., 2002), there were some cross-species (rat vs. mouse) differences in the immune response with perinatal genistein exposure.
Utility (Adequacy) for CERHR Evaluation Process
While low-dose effects and gender-specific immune effects may be possible, the lack of a clear pattern of effects across these studies make these data difficult to use. This paper is of limited utility in the evaluation process.
Guo et al. (2005), supported by NTP, examined the effect of developmental and adult exposure to genistein on myelotoxicity in rats. Two weeks prior to mating, Sprague-Dawley rat dams were switched from the standard NIH-31 diet to a soy- and alfalfa-free diet that contained casein as the protein source instead of soy and alfalfa, corn oil, and a vitamin mix adjusted for irradiation. The genistein concentration in the soy- and alfalfa-free diet was measured at 0.5 ppm [mg/kg feed]. Dams were assigned to treatment groups based on body weight. Starting on GD 7 (day of plug not specified) and continuing through the gestation and lactation period, 10 dams/group were given diet containing 0, 25, 250, or 1250 ppm genistein. The study authors estimated genistein doses at 0, 2, 20, and 100 mg/kg bw/day. The goal was to select a high dose that altered the reproductive system or endocrine-sensitive tissues but caused no major overt maternal or offspring toxicity. Dams were allowed to litter, and the day of birth was designated PND 1. Litters were randomly culled to 4 pups/sex/dose on PND 2. Some pups were fostered within the same treatment groups to maintain sex ratios. Pups were weaned on PND 22 and were fed the same diets as their dams until PND 64. Animals were killed for collection of bone marrow. [The age at which animals were killed was not specified and is therefore assumed to be shortly after treatment.] DNA synthesis in bone marrow was determined by 3H-thymidine incorporation. Colony forming units (CFU) were determined following incubation of bone marrow cells with colony-stimulating factors that stimulate formation of non-lymphoid cells (granulocyte macrophage [GM]), monocytes (macrophage [MP]), and erythrocyte development and production (erythropoietin). Ten offspring/sex/dose were examined for each parameter. [Distribution of litters was not discussed, but it is most likely that 1 pup/sex/litter was examined.] Data were analyzed by Bartlett test for homogeneity, ANOVA, Dunnett t-test, Wilcoxon rank-test, or Jonckheere test.
Genistein treatment had no detected effect on body weight of male rats, but terminal body weights of high-dose females were reduced by 11% [data were not shown]. Results for myelotoxicity parameters are summarized in Table 64. As noted in Table 64, genistein treatment resulted in non-dose-related decreases in DNA synthesis, CFU-GM/105 cells, and CFU-MP/105 cells in male offspring. In female offspring, the number of recovered bone marrow cells was reduced at the high dose. A non-dose-related increase in CFU-GM/105 cells was observed in females from the low-dose group. The study authors noted the non-dose-related responses and speculated that genistein might be producing U-shaped responses proposed to occur with exposure to estrogenic substances. CFU/femur were also reported in the text of the study, and the study authors stated that statistically significant effects included 33–40% decreases in CFU-GM and 28–35% decreases in CFU-MP in all treated males. In high-dose female rats there was a 38% decrease in CFU-GM/femur, a 43% decrease in CFU-MP/femur, and a 42% decrease in CFU-erythropoietin/femur. [No data were presented for CFU/femur results, and it is therefore not possible to determine if dose–response relationships occurred.] The study authors concluded that genistein is myelotoxic and noted sex-specific and dimorphic effects. Other compounds with possible endocrine-mediating activity were examined, and the study authors concluded the most potent myelotoxic compound was genistein>methoxychlor>nonylphenol>vinclozolin in males. In females, myelotoxicity was greatest for genistein>nonylphenol>vinclozolin.
Table 64.
Myelotoxicity in Rats Exposed to Genistein During Development and Adulthood
| Genistein dose in diet (ppm)
|
|||
|---|---|---|---|
| Parameter | 25 | 250 | 1250 |
| Males | |||
| DNA synthesis | ↓26% | ↔ | ↔ |
| CFU-GM/105 cells | ↔ | ↓33% | ↓26% |
| CFU-MP/105 cells | ↔ | ↓26% | ↔ |
| Females | |||
| Recovered bone marrow cells | ↔ | ↔ | ↓41% |
| CFU-GM/105 cells | ↑17% | ↔ | ↔ |
↑, ↓, ↔ Statistically significant increase, decrease, or no change. From Guo et al. (2005).
Strengths/Weaknesses
Strengths are that animals were maintained on a soy- and alfalfa-free diet, genistein was administered in the diet, a relevant route of exposure, and concentrations of genistein in the diet were confirmed analytically, dams were assigned to treatment groups based on body weight, genistein was used at multiple dose levels, and the exposure period included critical periods of development. Litters were culled on PND 2 to standardize growth rates. Weaknesses include lack of clarity on whether the authors controlled for litter effect in either their sampling methodology or statistical analyses and lack of adjustment for the increased feed consumption/kg bw that occurs shortly after weaning. With the exception of decreased number of recovered bone marrow cells in high-dose females and CFU/femur values, the parameters measured following genistein exposure did not follow traditional dose–response relationships (e.g., DNA synthesis only affected in low-dose males; there were greater decreases in CFU with GM at the middle dose than the high dose in males, whereas this value was significantly increased in females, but only at the low dose; and CFU with M was significantly decreased only in middle-dose males). The authors mentioned that the number of bone marrow cells obtained was a more variable parameter due to inherent variability in cutting the femurs and flushing the medullary cavities; thus, the measures that followed a more traditional dose–response relationship were less reliable. While low-dose effects and gender-specific myelotoxicity may be possible, there were no consistent patterns of effects in these results; thus, it would be useful to replicate this experiment.
Utility (Adequacy) for CERHR Evaluation Process
This study is of limited utility in the evaluation process.
Klein et al. (2002), supported by NIH and the National Aeronautics and Space Administration, evaluated the effects of pregnancy and lactation exposure on the immune system of male Long-Evans rats. Adult female rats were placed on a soy- and alfalfa-free diet to which genistein [purity not specified] was added at 0, 5, or 300 mg/kg feed. After 2 weeks, the females were bred to males on an unspecified diet and were maintained on their assigned diets through weaning. Based on measured feed consumption, the authors estimated mean genistein intake in the supplemented groups at 0.42 and 25 mg/kg bw/day, stated to be equivalent to human isoflavone intakes on Western and Asian diets, respectively. Males were weaned on PND 21 and housed 3/cage. Half the genistein-exposed males were weaned to their dam’s diet and half were weaned to the soy- and alfalfa-free diet. [Because there were no significant differences by diet at weaning, these groups were collapsed for analysis and evaluated only by the diet to which the dam was assigned.] On PND 70, blood was collected for measurement of plasma testosterone and thymuses and spleens were harvested. Lymphocytes were collected from both tissues and counted by CD4 and CD8 status. Splenic B cells were counted using a CD45R marker. Lymphocytes cultured with concanavalin A were evaluated for production of interleukin-4 and interferon-γ. Data analysis was performed using ANOVA with post-hoc Tukey test or Pearson product-moment analysis for correlations.
There were no detected effects of maternal diet on adult body weight or relative spleen weight. Relative thymus weight was increased 25% [estimated from a graph] in the high-dose genistein group. There was no detected effect of diet on splenic B cell number. Effects on T cell populations are shown in Table 65. There were no observed significant diet effects on production of interleukin-4 or interferon-γ by cultured lymphocytes. Plasma testosterone levels were 45–52% lower [estimated from a graph] in animals exposed to genistein, without an apparent dose-related effect. Plasma testosterone was negatively correlated with thymus CD4+CD8+ ell count and positively correlated with thymus CD4+CD8− and CD4−CD8− cell counts. The authors concluded that genistein may augment cellular immunity through a reduction in testosterone, which has immunosuppressant effects.
Table 65.
T Cell Counts in Male Rats Exposed Through the Dam to Genistein in the Diet
| Genistein exposure level mg/kg feed (mg/kg bw/day)
|
||
|---|---|---|
| 5 (0.42) | 300 (25) | |
| Spleen | ||
| CD4+ | ↔ | ↔ |
| CD8+ | ↔ | ↑1.2-fold |
| Total T cells | ↑1.1-fold | ↑1.2-fold |
| Thymus | ||
| CD4−CD8− | ↓59% | ↓61% |
| CD4+CD8− | ↔ | ↔ |
| CD4−CD8+ | ↔ | ↔ |
| CD4+CD8+ | ↑1.1-fold | ↑1.1-fold |
↑, ↓, ↔ Significant increase, decrease, or no change compared to control diet.
Strengths/Weaknesses
Strengths are that the dosing period covered in utero, postnatal, and adult stages, genistein was administered in a soy-free diet, and the dose levels did not alter the number of pups per litter at birth, sex ratio, pup birth weights, or adult body weights of the male offspring. The use of two dose levels is a strength in permitting evaluation of dose–response relationships but is less than ideal. Sample sizes were small (only four litters per treatment group) with each litter contributing one to three pups for sample collection; thus, there was limited control for litter effects. Other weaknesses were the use of only male offspring, the lack of indication of the purity of the genistein, the lack of information on how dams were assigned to treatment groups, the lack of analytic characterization of diets, and the lack of determination of feed consumption against actual measured body weight. Given the variance in maternal feed consumption during gestation and lactation and pup feed consumption post-weaning, it seems unlikely that the dose estimates adequately reflected genistein dose levels over the exposure period. There were no data presented on maternal or pup body weights during the dosing period. Litters were not culled until Day 21, which likely resulted in differences in offspring weight and nutrition during the lactational period. In many cases, the results did not exhibit dose–response relationships, which is unusual given the 60-fold difference in dose levels.
Utility (Adequacy) for CERHR Evaluation Process
This study is not useful in the evaluation process
Csaba and Inczefi-Gonda (2002), supported by the National Research Fund of Hungary, examined the effects of a single neonatal treatment with genistein on organ glucocorticoid receptor and ERs. Within 24 hr of birth, male and female Wistar rats (10 g bw) were given a single s.c. dose of 20 μg genistein [2 mg/kg bw] or 20 μg genistein+20 μg benzpyrene. Controls were treated with the saline/DMSO vehicle. Animals were killed at 5 months of age, 8 days following ovariectomy for females. Glucocorticoid receptor fractions were prepared from liver and thymus, and ER fractions were prepared from uterus. Receptor-binding affinity and density were determined in each organ. For each measurement, organs were pooled from five animals. Four measurements were used in statistical analyses, which were conducted by the McPherson method. The only significant effect of genistein treatment was a reduction in density of liver glucocorticoid receptors in males. A significant increase in density of liver glucocorticoid receptors was observed in males and females treated with genistein+benzpyrene. Other significant effects in rats treated with genistein+benzpyrene included increased affinity of liver receptors in males and reduced affinity and density of thymus receptors in females. The study authors concluded that imprinting of the glucocorticoid and ERs was weak following a single injection of genistein. They noted that caution is required in the extrapolation of the single dose results to humans because human exposure to genistein is chronic.
Strengths/Weaknesses
Weaknesses of the study includes use of a single genistein dose (2 mg/kg bw), the s.c. route of administration, and lack of indication of the type of chow used.
Utility (Adequacy) for CERHR Evaluation Process
This study is of limited utility in determining reproductive effects due to endpoints analyzed, but data may be useful in interpreting other studies.
Chen et al. (2005), supported by the State of Illinois, examined the effect of genistein intake on the intestines of piglets. Groups of eight piglets [obtained within 48 hr of birth, but exact age at the start of dosing was not specified] were fed medicated sow-milk replacer formula [composition of formula not specified] to which genistein [purity not specified] was added at 0, 1, or 14 mg/L. Piglets received the control or genistein-containing formulas at a rate of 360 mL/kg bw/day for 10 days by self-feeding from a tube. [Based on body weights provided for piglets on the last day of the experiment and reported body weight gain during the course of the study, genistein intake was estimated at ~0, 0.1–0.4, and 2–3 mg/kg bw/day.] On Day 10, the piglets received one-third of their daily formula allotment before being killed. Parameters examined in piglets included growth, serum isoflavone levels by LC/MS, intestinal lactase, sucrase, and disaccharose activity, intestinal cell migration, proliferation, apoptosis, electro-physiology, and histomorphology, intestinal expression of ERα, ERβ, and trefoil factor mRNA, and expression of phospho-src Tyr 416 protein. Data were analyzed by 1-way ANOVA.
Mean±SD levels of serum genistein were reported at 0.01±0.02, 0.07±0.07, and 2.36±2.26 μM [2.7±5.4, 19±19, and 637±610 μg aglycone equivalents/L] in the respective dose group. No genistein treatment effects were detected on body weight gain of piglets or piglet intestinal weight or length. Jejunal villous height, width, and crypt depth did not differ significantly by dose group. There were no detected treatment-related effects on electrophysiological measurements, including ion, glucose, or glutamine transport, in jejunum or ileum. No effects of genistein on jejunal disaccharide, lactase, and sucrase activities were detected. Reduced enterocyte proliferation was observed in the 14 mg/L genistein group, as noted by PCNA levels that were about half those of the control group. A trend for reduced enterocyte migration was identified in the 14 mg/L genistein group, for which the migration distance was about 20% less than control values. No significant differences were observed for apoptosis in intestinal villi. No significant effects compared to control values were observed for ERα or ERβ expression in jejunum or ileum. There was no detected genistein effect on expression of trefoil factor mRNA in jejunum or ileum, but trefoil faction mRNA was significantly lower (by ~33%) in stomach in both treated groups. No significant effect of genistein treatment on phospho-src Tyr 416 protein expression in jejunum was detected. The study authors concluded that the data on inhibited jejunal enterocyte proliferation and migration provided compelling evidence of genistein bioactivity in the intestine following exposures equivalent to those received by infants fed soy formula.
Strengths/Weaknesses
Strengths of the study included use of eight piglets/group and the determination of serum genistein levels. A weakness of the study is the short exposure duration (10 days).
Utility (Adequacy) for CERHR Evaluation Process
This study is of limited utility in determining developmental effects due to the endpoints analyzed.
3.2.5 Abstracts
CERHR notes some studies currently available only as abstracts. The abstracts are briefly summarized for completeness. They will not be used in the evaluation process.
No reductions in litter size or offspring sex ratio were observed in Sprague-Dawley rats exposed to genistein (30 μg/kg feed) from the time they were born through the entire gestation period (West et al., 2003). Reduced litter size was observed in the positive controls exposed to diethylstilbestrol 10 μg/kg feed.
Changes in uterine gene expression following treatment of mice with genistein 0.5–50 mg/kg bw on days [assumed PND] 1–5 included increased ERα expression at the lowest dose and a dose-related increase in lactoferrin and c-fos expression on Day 5. The increase in lactoferrin expression was blocked by the anti-estrogen ICI 182,780 (Jefferson et al., 2003). In a second experiment, mice treated with genistein on Days 1–5 and challenged with three injections of diethylstilbestrol 10 μg/kg bw/day on GD 17 experienced an enhanced response to uterine weight at low genistein doses but a dampening of estrogen effects on puberty at higher doses. Reproductive alterations were reported for all genistein doses at 2, 4, and 6 months.
In a study by Jefferson et al. (2004), CD-1 mice were s.c. injected with 0 or 50 mg/kg bw/day genistein on PND 1–5, and ovaries were collected on PND 2–6. Number of single-oocyte follicles was reduced on PND 4–6 in the genistein-treated group, but there were no detected differences in oocyte numbers or apoptosis. When mated at 2 months of age, none of the genistein-treated mice delivered live pups. A second group of mice was treated with genistein 25 mg/kg bw on PND 1–5 and live pups were delivered by four of eight mice when mated at 2 months of age. Ovaries from 37% of F2 females of the genistein group contained multi-oocyte follicles, while no multi-oocyte follicles were observed in ovaries from F2 control females.
Luijten et al. (2004), in a study supported by the Commission of the European Communities, the FAIR program, and EU-FW5, examined the effects of isoflavones in a high-fat diet on mammary tumors in TG.NK (MMTV/c-Neu) mice. Onset of mammary adenocarcinoma was accelerated but tumor burden at necropsy was not observed to be increased in mice that were fed isoflavones in a high-fat diet from 4 weeks of age. Exposure to isoflavones during gestation and lactation increased mammary differentiation and increased tumor burden at necropsy but had no detected effect on onset of palpable mammary tumors. Onset of tumors was accelerated with exposure to a high-fat compared to a low-fat diet during perinatal development. [No details were provided about the types and doses of isoflavones administered.]
Panzica et al. (2005) briefly described the effects of genistein and other compounds on sexual behavior and the vasotocin system of Japanese quail. The amount and depth of information provided was equivalent to a study abstract, and this study is therefore being described in the abstract section. Additional information about study protocol for genistein was only available through an Italian report. In two different experiments, oil (control) or 10, 100, or 1000 μg genistein were injected into the albumin of fertilized quail eggs on the third day of incubation. Male copulatory behavior was tested at 7 weeks of age and immunocytochemical analyses of brain were conducted in males at 8 weeks of age. Some aspects of male copulatory behavior were reduced in the 1000 μg group. Treatment with 1000 μg genistein resulted in a significant reduction in the fractional area of vasotocin-immunoreactive neurons (sexually dimorphic cells) within the pars medialis and medial preoptic nucleus of male quail brains. The reduction in fractional area of vasotocin-immunoreactive neurons was of lower magnitude than that observed following treatment with 25 μg estradiol benzoate.
3.3 Utility of Data
3.3.1 Human data
There were no data identified for humans.
3.3.2 Experimental animal data
Developmental toxicity studies were conducted in rats and mice exposed through diet and by s.c. injection. In general, the most informative data were available from oral exposure studies in rats and s.c. exposure studies in mice. Prenatal endpoints such as offspring growth and survival were reported for rats exposed through diet (Flynn et al., 2000a; NCTR, 2005; You et al., 2002a). None of the studies examined genistein for possible teratogenicity. General postnatal endpoints such as growth, survival, and developmental milestones were examined in offspring of rats dosed through diet (Delclos et al., 2001; You et al., 2002a; NCTR, 2005) and in pups gavaged during the neonatal period (Nagao et al., 2001). Endocrine-mediated endpoints such as age of puberty, estrous cyclicity, spermatogenesis, or histopathology of male and female reproductive organs were examined in studies in which mice were exposed to genistein by s.c. injection or orally in prenatal or postnatal periods (Strauss et al., 1998; Newbold et al., 2001; Shibayama et al., 2001; Jefferson et al., 2002a; 2005a; Fielden et al., 2003; Jung et al., 2004; Lee et al., 2004a) and rats were exposed orally or by s.c. injection during gestation, lactation, or postweaning (Casanova et al., 1999; Delclos et al., 2001; Nagao et al., 2001; Fritz et al., 2002a; You et al., 2002a; Lewis et al., 2003; Masutomi et al., 2003; Takagi et al., 2004; NCTR, 2005). Effects on mammary development and susceptibility to chemically induced carcinogenesis were examined in mice and rats exposed orally or parenterally during prenatal or postnatal development (Lamartiniere et al., 1995a, b; Murrill et al., 1996; Fritz et al., 1998; Fielden et al., 2002; You et al., 2002b). Development of sexually dimorphic regions of the brain and sexually dimorphic behaviors were assessed in rats exposed orally or parenterally during prenatal or postnatal development (Faber and Hughes, 1991, 1993; Levy et al., 1995; Flynn et al., 2000a; Lewis et al., 2003; Scallet et al., 2004; Becker et al., 2005). A limited number of studies addressed the effects of genistein exposure during development on the thyroid (Chang and Doerge, 2000) and the immune system of rats (Guo et al., 2002, 2006; Klein et al., 2002). A common limitation of many studies was that exposures occurred during development and through adulthood, thus complicating the interpretation of the data.
The interpretation of some studies was hampered by the use of single dose levels, particularly when those dose levels were well above levels relevant to humans, use of treatment time periods that extended beyond development, the lack of reporting of litter data, and the lack of litter-based analysis. Route of exposure was a potentially important issue in the interpretation of studies. The Expert Panel noted the relevance of the oral route of dosing for human exposure; however, administration in the diet does not permit precise determination of dose, and gavage may be difficult for neonatal animals, particularly mice. Although s.c. administration of genistein results in a larger fraction of unconjugated (active) genistein than oral administration, pharmacokinetic data may permit interpretation of data from s.c. studies.
3.4 Summary of Developmental Toxicity Data
3.4.1 Human data
No human data were identified.
3.4.2 Experimental animal studies
Studies reporting the most sensitive and apparently treatment-related developmental effects are summarized in Table 66 for oral and parenteral exposures in mice, Table 67 for oral exposures in rats, and Table 68 for parenteral exposures in rats. In these tables, dose levels have been converted to mg/kg bw. In general, the most complete information was available from parenteral exposure studies in mice and oral exposure studies in rats. In cases where doses were converted to mg/kg bw/day values, ranges were often estimated over periods of gestation or lactation or in different stages of the offspring’s life. In order to simplify dose comparisons, exposure ranges were averaged in summaries of developmental toxicity effects.
Table 66.
Experimental Studies With Developmental Toxicity Endpoints in Orally- and S.C.-Exposed Mice
| Effect levels, mg/kg bw/day
|
||||||||
|---|---|---|---|---|---|---|---|---|
| Genistein doses and study design | Most sensitive endpoints | NOAEL | LOAEL | BMD10a | BMDL10 | BMD1 SD | BMDL1 SD | Reference |
| Oral | ||||||||
| B6D2F1, 0, 0.1, 0.5, 2.5, or 10 mg/kg bw/day by gavage on GD 12 through PND 20 | ↓Anogenital distance in males on PND 21 | 2.5 | 10 | Fielden et al., 2003 | ||||
| Fawn Farm, 0 or 2 mg/day genistein through diet [~180 mg/kg bw/day] for 21 days beginning at 18 days of age | Accelerated vaginal opening | – | 180 | East, 1955 | ||||
| ICR, 0 or 2.5 mg/kg bw/day by gavage for 5 weeks beginning on PND 21 | No effect on male reproductive organ weight and histopathology or sperm count and motility | 2.5 | Jung et al., 2004 | |||||
| ICR, 0, 2.5, or 5.0 mg/kg bw/day [assumed to be by gavage] for 5 weeks beginning on PND 21 | Slight histopathology changes in male reproductive organs | – | 2.5 | Lee et al., 2004a | ||||
| C57BL/6, 0, 0.1, 0.5, 2.5, or 10 mg/kg bw/day by gavage on GD 12 through PND 20, excluding PND 0 | No effect on mammary development in female offspring | 10 | Fielden et al., 2002 | |||||
| Parenteral | ||||||||
| CD-1, 0 or 50 mg/kg bw/day by s.c. injection on PND 1–5 | ↑Carcinogenic and non-carcinogenic histopathology in uterus and functional and histopathologic changes in ovary | – | 50 | Newbold et al., 2001 | ||||
| CD-1, 0, 1, 10, or 100 mg/day (0, 0.5, 5, or 50 mg/kg bw/day) by s.c. injection on PND 1–5 | ↑Multi-oocyte follicles | 5 | 50 | 10 | 6 | Jefferson et al., 2002a | ||
| CD-1, 0, 0.5, 5, or 50 mg/kg bw/day) by s.c. injection on PND 1–5 | Disrupted estrous cycles at 2 months of age (values shown for extended estrus, since it had the best dose-related response) | – | 9 Based on trend | 6 Based on trend | Jefferson et al., 2005b | |||
| Disrupted estrous cycles at | – | 17 Based on | 10 Based | |||||
| 6 months of age (values shown for persistent estrus, since it had the best dose-related response) | trend | on trend | ||||||
| ↓Pregnancies at 2/4/6 months of age | – | 4/5/1 | 2/2/0.6 | |||||
| ↓Live pups at 2/4/6 months of age | 0.5 at each period | 5 at each period | 2/2/1 | 1/1/0.7 | 4/8/4 | 2/3/2 | ||
| ↓Corpora lutea/dam at 4 months of age | 5 | 18 | 44 | 7 | 47 | 21 | ||
| – | 50 | 154 | 104 | 418 | 261 | Strauss et al., 1998 | ||
| Han-NMRI, 0, 0.1 or 1 mg/day (50 or 500 mg/kg bw/day by s.c. on first 3 days of life | ↓Ventral prostate weight in adulthood (Histologic changes observed) | |||||||
| ↓Coagulating gland weight | 50 | 500 | 112 | 94 | 174 | 132 | ||
| ICR, 0, 7, 71, and 714 mg/kg bw/day by s.c. injection for 5 days following birth | No change in testis weight, sperm count, or sperm motility at 12 weeks of age | ≥714 | Shibayama et al., 2001 | |||||
| ICR, 0 or 1000 mg/kg bw/day by injection for 5 days following birth | No change in testis weight and histologic changes at 12 weeks of age | ≥1000 | Adachi et al., 2004 | |||||
↑, ↓ Significant increase, decrease.
See the footnote to Table 33 for an explanation of the use of benchmark dose in this report.
Table 67.
Developmental Toxicity Studies in Orally-Exposed Rats
| Effect levels, mg/kg bw/day
|
||||||||
|---|---|---|---|---|---|---|---|---|
| Genistein doses and study design | Most sensitive endpoints and generation | NOEL/NOAEL | LOEL/LOAEL | BMD10a | BMDL10 | BMD1 SD | BMDL1 SD | Reference |
| Sprague-Dawley dams were fed diet containing 0 or 5 ppm genistein from GD 17 throughout the lactation period up to PND 70 in offspring. [Exposure in offspring estimated at ~0.68 mg/kg bw/day over the lifetime.] | Changes in ovarian histology at PND 21 and 70 | 0.68b | Awoniyi et al., 1998 | |||||
| Long-Evans, 0 or 15 mg/kg bw by gavage on GD 14 to PND 21. | Uterine histomorphometry endpoints | 15 | Hughes et al., 2004 | |||||
| Pregnant Sprague-Dawley rats were fed diets containing 0, 20, or 100 ppm genistein [0, 20, or 87 mg/kg bw/day]. | ↑Anogenital distance | 20 | 87 | 54 | 34 | 54 | 34 | Casanova et al., 1999 |
| ↓Weight at vaginal opening, | 20 | 87 | 55 | 36 | 59 | 36 | ||
| ↑Uterus weight on PND 21 | 20 | 87 | 5 | 3 | 24 | 17 | ||
| ↑Relative testis weight on PND 21 | 20 | 87 | 171 | 103 | 64 | 38 | ||
| ↑Relative testis weight on PND 56 | 20 | 87 | 180 | 81 | 118 | 54 | ||
| ↓Vental prostate weight | 20 | 87 | ||||||
| Sprague-Dawley, 0, 5, 25, 100, 250, 625, and 1250 ppm through diet during pregnancy and lactation and until PND 50 in offspring. [Mean doses: 0.31, 1.7, 5.7, 15, 34, 83 mg/kg bw/day in pregnant dams; 0.56, 2.8, 11, 30, 73, 138 in lactating dams; ~0.6, 3.0, 12, 30, 72, and 180 mg/kg bw/day in pups after weaning.] | ↓Dams delivering litters; delayed eye opening | Pregnancy: 34 | 83 | Delclos et al., 2001 | ||||
| Lactation: 73 | 138 | |||||||
| Pup: 72 | 180 | |||||||
| Accelerated vaginal opening | Pregnancy: 34 | 83 | 85 | 83 | 32 | 26 | ||
| Lactation: 73 | 138 | 141 | 138 | 68 | 55 | |||
| Pup: 72 | 180 | 184 | 180 | 67 | 55 | |||
| ↓Relative vental prostate weight at PND 50 | Pregnancy: 34 | 83 | 32 | 22 | 37 | 25 | ||
| Lactation: 73 | 138 | 68 | 48 | 79 | 53 | |||
| Pup: 72 | 180 | 67 | 47 | 78 | 53 | |||
| ↑Relative vaginal weight | Pregnancy: | 6 | 17 | 80 | 35 | |||
| Lactation: | 13 | 36 | 132 | 78 | ||||
| Pup: | 13 | 36 | 173 | 77 | ||||
| Histopathology in ovaries, uterus, and vagina at PND 50 | Pregnancy: 34 | 83 | ||||||
| Lactation: 73 | 138 | |||||||
| Pup: 72 | 180 | |||||||
| Prostate inflammation | Pregnancy: 34 | 83 | ||||||
| Lactation: 73 | 138 | |||||||
| Pup: 72 | 180 | |||||||
| Alveolar proliferation in mammary of females at PND 50 | Pregnancy: 5.7 | 15 | ||||||
| Lactation: 15 | 30 | |||||||
| Pup: 12 | 30 | |||||||
| Hypertrophy of mammary alveoli and ducts in males at PND 50c | Pregnancy: 1.7 | 5.7 | ||||||
| Lactation: 2.8 | 11 | |||||||
| Pup: 3.0 | 12 | |||||||
| ↓Postnatal body weights (females) | Pregnancy: 34 | 83 | 6 | 48 | 28 | 17 | ||
| Lactation: 73 | 138 | 13 | 102 | 59 | 36 | |||
| Pup: 72 | 180 | 13 | 102 | 58 | 36 | |||
| Sprague-Dawley 0, 5, 100, 500 ppm (males: 0, 0.3, 7, 35 mg/kg bw/day; females: 0, 0.4, 9, 44 mg/kg bw/day; females during lactation: 0.7, 15, and78 mg/kg bw/day) in diet, multi-generational design. | ↓Live pups (F2 females) | Sire: 7 | 35 | 9 | 7 | 32 | 23 | NCTR, 2005 |
| Dam: 9 | 44 | 12 | 9 | 41 | 29 | |||
| ↓Pup weight at birth, F5 (no exposure) | – | Sire: 0.3 | 183 | 37 | 169 | 38 | ||
| Dam: 0.4 | 236 | 47 | 217 | 47 | ||||
| ↓Anogenital distance in males and F1 females | Sire: 7 | 35 | 82 | 40 | 57 | 28 | ||
| Dam: 9 | 44 | 46 | 46 | 54 | 30 | |||
| ↓Pup weight during lactation (F1 males) | Sire: 0.3 | 7 | 27 | 20 | 30 | 22 | ||
| Dam: 0.4 | 9 | 35 | 26 | 39 | 28 | |||
| ↓Body weight at vaginal opening | Sire: 7 | 35 | 20 | 11 | 35 | 26 | ||
| Dam: 9 | 44 | 25 | 15 | 44 | 33 | |||
| Disrupted estrous cycles following vaginal opening | Sire: 7 | 35 | ||||||
| Dam: 9 | 44 | |||||||
| Mammary gland hyperplasia in males (F1, F2, F3) | Sire: 0.3 | 7 | ||||||
| Dam: 0.4 | 9 | |||||||
| Accelerated vaginal opening (F1) | Sire: 7 | 35 | 36 | 29 | 37 | 35 | ||
| Dam: 9 | 44 | 46 | 38 | 47 | 44 | |||
| CD®SD IGS, 0 or 1250 ppm in diet [mean 147 mg/kg bw/day] from GD 15 to PND 11. | Decreased litter size, disrupted estrous cycles, endometrial, vaginal and mammary hyperplasia, and atretic ovarian follicles. | – | 147 | Takagi et al., 2004 | ||||
| Sprague-Dawley, 0 or 5 (n = 16) ppm in feed [0.12 mg/kg bw/day] in feed from GD 17 to PND 21. | Transient decreases in serum LH and testosterone on PND 21 and ↓testis and epididymis weight in adulthood | – | 0.12b | Roberts et al., 2000 | ||||
| Sprague-Dawley, 0, 5, 100, or 500 ppm in diet during pregnancy and lactation; half of offspring were given control diets at weaning and evaluated in adulthood; multigenerational design. [Intakes assumed to be similar to those in NCTR, 2005) of which this study was a part.] | ↑Serum testosterone levels in F1 males | Male: 7 | 35 | Dalu et al., 2002 | ||||
| Female: 9 | 44 | |||||||
| Sprague-Dawley, 0, 300, or 800 ppm genistein in diet during pregnancy and lactation and up to PND 90 in offspring; [mean exposures: 25 and 53 mg/kg bw/day in dams and 30 and 84 mg/kg bw/day in pups.] | ↓Birth weight of female offspring | – | 25 | 812 ppm | 765 ppm | 751 ppm | 378 ppm | You et al., 2002a |
| Accelerated vaginal opening | – | Dam: 25 | ||||||
| Pup: 30 | ||||||||
| Lower body weights during lactation (values for females given) | Dam: 25 | 53 | 50 | 25 | 50 | 27 | ||
| Pup: 30 | 84 | 60 | 30 | 60 | 32 | |||
| CD®SD IGS, 0, 20, 200, or 1000 ppm in diet [mean: 1.7, 18, and 90 mg/kg bw/day] from GD 15 to PND 10. | ↓Body weight gain in males on PND 21–42 | 18 | 90 | Masutomi et al., 2003 | ||||
| Sprague-Dawley, 0, 25, or 250 ppm in diet (2.2 and 22 mg/kg bw/day) during gestation and lactation, male offspring were fed same diets as dams from PND 21–70. | ↑Serum testosterone | – | 2.2 | 13 | 6 | 29 | 14 | Fritz et al., 2002b |
| Long-Evans, 0, 5, or 300 ppm in feed during pregnancy and lactation [~mean of 3 and 150 mg/kg bw/day, although there is some uncertainty due to an apparent error by authors.] | ↓Testis size, delayed preputial separation, and compromised mating performance | – | 3b | Wisniewski et al., 2003 | ||||
| ↑Prostate weight on PND 70 | – | 3b | 240 | 70 | 282 | 142 | ||
| ↓Plasma testosterone on PND 70 | – | 3b | 76 | 27 | 302 | 66 | ||
| Sprague-Dawley, 0, 12.5, 25, 50, or 100 mg/kg bw/day by gavage on PND 1–5. | Lower body weights of males at week 18 | – | 12.5 | 78 | 52 | 112 | 73 | Nagao et al., 2001 |
| Lower body weights of females at week 9 | – | 12.5 | 107 | 74 | 102 | 69 | ||
| ↓Epididymal weight | – | 12.5 | 217 | 92 | 299 | 124 | ||
| ↓Pregnant females | – | 12.5 | 20 | 15 | 91 | 63 | ||
| Polyovular follicles | – | 12.5 | ||||||
| Sprague-Dawley, 0, 250, or 1000 ppm in feed [37 and 147 mg/kg bw/day] on PND 21–35. | ↓5α-reductase activity in prostate | – | 37 | Fritz et al., 2002a | ||||
| ↓Bud perimeter of the type 1 lateral prostate lobe | 37 | 147 | ||||||
| Sprague-Dawley, 0, 250, or 1000 ppm in feed [37 and 147 mg/kg bw/day] on PND 21–35. | No adverse testicular effects | 147 | Fritz et al., 2003 | |||||
| Strain not indicated, 0, 0.2, or 2 mg/kg bw/day by s.c. injection during PND 1–6 and 4 and 40 mg/kg bw/day by gavage on PND 7–21 (s.c. doses were determined to be equivalent to gavage doses of 4 and 20 mg/kg bw/day); one part of the study examining SDN-POA dosed animals during the same period with s.c. and oral doses equivalent to 4 and 40 mg/kg bw/day by oral exposure. | Advanced vaginal opening, persistent vaginal cornification, and ↓serum progesterone | 4 | 20–40 | Lewis et al., 2003 | ||||
| ↑SDN POA volume in females | 4 | 40 | ||||||
| Sprague-Dawley, 0, 25, or 250 ppm in diet [~0, 2.2, and 22 mg/kg bw/day] during pregnancy and lactation. | No adverse effects on chemically-induced tumorigenesis or reproductive development in males or females (apparently non-adverse changes in proportion of mammary cells) | 22 | Fritz et al., 1998 | |||||
| Sprague-Dawley, 0, 300, or 800 ppm in diet during gestation and lactation. | Apparently non-adverse changes in proportion of mammary cells | You et al., 2002b | ||||||
| Sprague-Dawley, 0 or 500 mg/kg bw by s.c. injection on PND 2, 4, and 6. | No adverse effects on chemically-induced tumorigenesis; (apparently non-adverse changes in proportion of mammary cells) | 500 | Lamartiniere et al., 1995a, b | |||||
| Sprague-Dawley, 0 or 500 mg/kg bw by s.c. injection PND 16, 18, 20. | Apparently non-adverse changes in proportion of mammary cells) | 500 | Murrill et al., 1996 | |||||
| Sprague-Dawley, 0, 25, 250, or1250 ppm (0, 2, 20, and 100 mg/kg bw/day) in diet from GD 7, during gestation and lactation, until PND 77 in offspring. | Increased saline ingestion in both males and females | 20 | 100 | Flynn et al., 2000a | ||||
| ↓Pup birth weight | 20 | 100 | 102 | 73 | 97 | 68 | ||
| Sprague-Dawley, 0, 5, 100, and 500 ppm [0, 0.31, 5.7, 34 mg/kg bw/day] in diet through gestation and lactation and in offspring until PND 140 | ↑Calbindin-positive cells in SDN-POA in males | – | 0.3 | Scallet et al., 2004 | ||||
↑, ↓ Significant increase, decrease.
See the footnote to Table 33 for an explanation of the use of benchmark dose in this report. When doses were given in ppm, benchmark doses were calculated in ppm and converted to mg/kg bw/day using author or CERHR estimates and interpolation.
The Expert Panel has limited confidence in the accuracy of the dose determination in this study.
Mammary gland hypertrophy is not a clear adverse outcome.
Table 68.
Developmental Toxicity Studies in Parenterally-Exposed Rats
| Lowest effect levels, mg/kg bw/day
|
||||||||
|---|---|---|---|---|---|---|---|---|
| Genistein doses and study design | Most sensitive endpoints | NOAEL | LOAEL | BMD10a | BMDL10 | BMD1 SD | BMDL1 SD | Reference: |
| 0 or 500 mg/kg bw by s.c. injection on PND 16, 18, and 20 | ↑Uterine weight, ↑serum 17β-estradiol, and ↓ serum progesterone on PND 21 | – | 500 | Cotroneo et al., 2001 | ||||
| 0 or 500 mg/kg bw by s.c. injection on PND 2, 4, and 6 | Did not identify adverse effects on chemically-induced tumorigenesis; (apparently non-adverse changes in proportion of mammary cells) | 500 | Lamartiniere et al., 1995a, b | |||||
| 0 or 500 mg/kg bw by s.c. injection on PND 16, 18, 20 | Apparently non-adverse changes in proportion of mammary cells) | 500 | Murrill et al., 1996 | |||||
| 0, 5, or 25 mg/animal/day by s.c. injection from GD 16–20 [15 and 75 mg/kg bw/day] | ↓Birth weight of females | 15 | 75 | Levy et al., 1995 | ||||
| Non-dose-related ↓ in anogenital distance in males and females and delayed vaginal opening | – | 15 | ||||||
| 0, 0.1, or 1, mg/day by s.c. injection on PND 1–10. [Mean≈12 and 117 mg/kg bw/day] | Non-dose-related ↑ in LH secretion | – | 12 | Faber and Hughes, 1991 | ||||
| ↑SDN-POA volume in females | 12 | 117 | ||||||
| 0, 0.001, 0.01, 0.1, 0.200, 0.4, 0.5, or 1.0 mg by s.c. injection on PND 1–10. [Mean≈0.12, 1.2, 12, 23, 47, 58, and 117 mg/kg bw/day.] | ↑GnRH-induced LH secretion | – | 0.12 | Faber and Hughes, 1993 | ||||
| ↑SDN-POA volume | 47 | 58 | 31 | 9 | 85 | 51 | ||
↑, ↓ Significant increase, decrease.
See the footnote to Table 33 for an explanation of the use of benchmark dose in this report. Benchmark doses calculated in mg/animal and converted to mg/kg bw/day using author estimates and interpolation.
3.4.2.1 Pre- and postnatal survival, growth, and general development endpoints
Oral exposure studies conducted in rats suggested that genistein exposures can adversely affect prenatal endpoints such as growth and possibly survival. The most consistent and sensitive prenatal endpoint was reduced pup birth weight, which was reported at ≥300 ppm genistein (≥25 mg/kg bw/day in dams during pregnancy) administered in diet (You et al., 2002a); reduced pup birth weight was seen in other studies at higher dose levels (Flynn et al., 2000a; NCTR, 2005). A reductions in the number of mated dams delivering litters was reported in one study at 1250 ppm genistein in diet (83 mg/kg bw/day in dams during pregnancy) (Delclos et al., 2001). Decreased live litter size was reported in two studies at ≥500 ppm in diet (44 mg/kg bw/day in dams during pregnancy) (Takagi et al., 2004; NCTR, 2005). In rats gavaged with genistein during the neonatal period, reduced pregnancy rate was observed at ≥12.5 mg/kg bw/day and decreased numbers of implants were observed at 100 mg/kg bw/day (Nagao et al., 2001). None of the studies assessed structural malformations.
Oral exposure studies examining postnatal development in rats suggested that genistein exposures can result in reduced growth and delayed development. In well-designed multiple dose-level studies, decreased pup weight or weight gain during the lactation period were observed with exposures in diet given to dams from early-to-mid gestation through lactation (Delclos et al., 2001; You et al., 2002a; NCTR, 2005). The lowest effect level in these studies was of ≥100 ppm genistein (≥11 mg/kg bw/day in dams during lactation) in the NCTR multigenerational study (NCTR, 2005). Similar effects were shown with gavage dosing of pups with ≥100 mg/kg bw/day during the lactation period (Nagao et al., 2001). One multiple-dose level study with gestational and lactation exposure reported trends for developmental delay and significant delays in eye and ear opening at 1250 ppm genistein (≥138 mg/kg bw/day in dams during lactation) (Delclos et al., 2001). None of the studies reported adverse effects on postnatal survival.
3.4.2.2 Reproductive endpoints
3.4.2.2.1 Mouse
There is some evidence that genistein affects endocrine-mediated endpoints in female mice. Disrupted estrous cycles were reported in one study where mice were s.c. injected with genistein during the neonatal period [BMD10 = 9 mg/kg bw/day and BMDL10 = 6 mg/kg bw/day] (Jefferson et al., 2002b). Following neonatal s.c. exposures, absence of corpora lutea and abnormal oviduct histology in adulthood were observed at 50 mg/kg bw/day genistein (Newbold et al., 2001) and increased numbers of multi-oocyte follicles were observed on PND 19 [BMD10 = 10 mg/kg bw/day and BMDL10 = 6 mg/kg bw/day] (Jefferson et al., 2002a). Increases in uterine metaplasia and adenocarcinoma were observed following s.c. injection with 50 mg/kg bw/day genistein during the neonatal period (Newbold et al., 2001). When female mice were mated following neonatal s.c. exposure, there were decreased pregnancies, decreased live pups, and decreased corpora lutea at ≥5 mg/kg bw/day (Jefferson et al., 2005b). Effects of genistein on uterine weight are reported in Table 28, which describes estrogenicity studies.
In male mice, hyperplasia of Leydig cells and irregularities in epididymal epithelium were observed following oral dosing of pups with ≥2.5 mg/kg bw/day genistein for 5 weeks, beginning at weaning (Lee et al., 2004a). Hyperplasia in prostate and seminal vesicle was reported in one multiple-dose level study with s.c. dosing at 500 mg/kg bw/day during the neonatal period (Strauss et al., 1998). No effects on sperm count or motility or in vitro fertilization were reported following oral or s.c. exposures of dams or developing offspring (Shibayama et al., 2001; Fielden et al., 2003; Jung et al., 2004; Lee et al., 2004a). There were no consistent effects reported for anogenital distance in male mice exposed to genistein during development (Fielden et al., 2003). There were also no consistent effects on organ weight changes following oral or s.c. exposure of male mice. 3.4.2.2.2 Rat: Oral exposures studies suggested that genistein can affect endocrine-mediated reproductive endpoints in female rats. Trends or significant effects on accelerated vaginal opening were observed in some studies; generally, accelerated vaginal opening was observed in studies that included postweaning exposure of pups (Casanova et al., 1999; Delclos et al., 2001; You et al., 2002a; NCTR, 2005) and not in studies with exposures occurring only during the gestational, lactational, or first 5 days of the neonatal periods (Nagao et al., 2001; Masutomi et al., 2003; Takagi et al., 2004). The lowest genistein effect level for alterations in vaginal opening was ≥300 ppm (≥30 mg/kg bw/day in pups) in the study of You et al. (2002a). One study reported increased numbers of polyovular follicles in 21-day-old rats following direct gavage dosing with ≥12.5 mg/kg bw/day genistein during the neonatal period (Nagao et al., 2001). Ovarian atresia was reported in offspring of dams given 1250 ppm in diet (138 mg/kg bw/day in lactating dams, 83 mg/kg bw/day in pregnant dams, and 180 mg/kg bw/day in offspring) from mid to late gestation through at least half of the lactation period (Delclos et al., 2001; Takagi et al., 2004). Another study (Awoniyi et al., 1998) also reported ovarian atresia at a maternal dietary dose level of 5 ppm (0.68 mg/kg bw/day); however, the Expert Panel has limited confidence in the reliability of the dose determination. Changes in uterine or vaginal cells, such as hypertrophy, hyperplasia, or abnormal maturation were reported with dietary exposures ≥625 ppm (34 mg/kg bw/day in pregnant dams and 72 mg/kg bw/day in offspring) occurring during gestation and at least part of the lactation period (Delclos et al., 2001; Takagi et al., 2004) and direct exposure of pups to ≥40 mg/kg bw/day by gavage during the lactation period (Nagao et al., 2001; Lewis et al., 2003). Disruption of estrous cycles, consisting of prolonged diestrous or estrous stages, was observed with direct or indirect dietary exposure to ≥500 ppm (≥44 mg/kg bw/day) from gestation through adulthood (You et al., 2002a; NCTR, 2005) or indirect exposure to 1250 ppm (≥147 mg/kg bw/day) given from late gestation through mid lactation (Takagi et al., 2004). Effects of genistein on uterine weight are reported in Table 28. No other consistent effects on female reproductive organ weights were reported.
Fewer effects of genistein were reported in reproductive systems of male rats. Delayed preputial separation was reported in a study at doses of 5–300 ppm administered to dams or offspring (You et al., 2002a); however, the majority of studies reported no effect on age at preputial separation at doses up to 1250 ppm in diet (≥180 mg/kg bw/day in offspring) (Casanova et al., 1999; Delclos et al., 2001; Masutomi et al., 2003; Takagi et al., 2004) or 100 mg/kg bw/day by gavage (Nagao et al., 2001) following direct or indirect exposure during the gestational, lactational, or postweaning periods. Prostate was the only male reproductive organ said to be affected in oral dosing studies that reported histologic evaluations. Chronic inflammation of the dorsolateral prostate on PND 50 was reported following mid-gestational, lactational, and postweaning exposure to dietary genistein at 1250 ppm (≥180 mg/kg bw/day in offspring) (Delclos et al., 2001); reduced bud perimeter of the Type 1 lateral prostate lobe on PND 35 was reported with postweaning dietary exposure to 1000 ppm genistein (~147 mg/kg bw/day in weanlings) (Fritz et al., 2002a). There were no consistent effects on male reproductive organ weights. With the exception of one study reporting greater severity of abnormal spermatogenesis at 1250 ppm genistein (180 mg/kg bw/day in offspring), which may have been related to the peripubertal status of the rats (Delclos et al., 2001), no other studies reported adverse effects on sperm count or motility at genistein doses up to 500 ppm in diet (35 mg/kg bw/day) and exposure during gestation, lactation, or postweaning (NCTR, 2005) or 100 mg/kg bw/day by gavage during the neonatal period (Nagao et al., 2001). A multigenerational study that included exposures in males during prenatal and postnatal development reported no adverse effects on fertility at doses up to 500 ppm in diet (NCTR, 2005). Variable effects on male sexual performance were reported (Nagao et al., 2001).
Effects reported for anogenital distance in males and females were variable (Casanova et al., 1999; NCTR, 2005), and most oral exposure studies reported no effects at genistein doses up to 1250 ppm (≤83 mg/kg bw/day) administered during gestation, lactation, or postweaning development (Delclos et al., 2001; You et al., 2002a; Masutomi et al., 2003). A limited number of studies examined effects of genistein exposure during development on hormone levels, but the results were variable in males and females.
3.4.2.3 Mammary endpoints
3.4.2.3.1 Mouse
No effects on mammary growth or differentiation in adult mice were reported following gavage exposure of their dams with up to 10 mg/kg bw/day during mid gestation through lactation (Fielden et al., 2002).
3.4.2.3.2 Rat
Hypertrophy/hyperplasia of mammary structures was reported following dietary genistein exposure during periods including mid-to-late gestation or the neonatal stage, at doses ≥100 ppm in males (≥5.7 mg/kg bw/day in dams and 7–12 mg/kg bw/day in offspring) (Delclos et al., 2001; NCTR, 2005) and 1250 ppm in females (≥83 mg/kg bw/day in dams and 180 mg/kg bw/day in offspring) (Delclos et al., 2001; Takagi et al., 2004).
Decreased numbers of terminal end buds/ducts and increased numbers of lobules in mammary gland were reported in adult female rats that received genistein by s.c. injection during development (Lamartiniere et al., 1995a, b; Murrill et al., 1996). Inconsistent effects on mammary structures were observed in adult rats that were exposed to genistein through diet during the developmental period, with one study reporting decreased numbers of terminal end buds and lobules (Fritz et al., 1998) and another study reporting no effects on mammary structures of females (You et al., 2002b). Numbers of chemically induced mammary tumors were reduced in rats s.c. treated during postnatal development with 500 mg/kg bw/day genistein (Lamartiniere et al., 1995a, b; Murrill et al., 1996). In the only oral dose study examining the effects of genistein exposure on chemically-induced mammary tumors, dietary exposure to ≥25 ppm genistein (~2.2 mg/kg bw/day) during gestation and lactation reduced dimethyl benzanthracene-induced tumors in adult females (Fritz et al., 1998).
3.4.2.4 Nervous system endpoints
3.4.2.4.1 Rat
An increase in the size of the sexually dimorphic nucleus of the preoptic area of females was reported following oral/s.c. administration of genistein during the lactation period at an equivalent genistein oral dose of 40 mg/kg bw/day (Lewis et al., 2003) and following s.c. dosing during the lactation period at doses ≥0.5 mg/day (≥58 mg/kg bw/day) (Faber and Hughes, 1991, 1993). No effect on volume of the SDN-POA was reported following s.c. dosing with up to 25 mg/rat/day [75 mg/kg bw/day] on GD 16–20 (Levy et al., 1995). A dietary exposure study reported an increase in calbindin-positive cells in sexually dimorphic nucleus of adult males following exposure to ≥5 ppm during gestation through adulthood (Scallet et al., 2004).
3.4.2.5 Other systems
One study reported reductions in thymocyte subsets and changes in natural killer cell activity in rats on PND 22 following dietary exposure of dams during gestation and lactation (Guo et al., 2002). A second study found changes in thymocyte numbers suggesting augmented cell-mediated immunity in PND 70 rats the dams of which had been given dietary genistein during pregnancy and lactation (Klein et al., 2002). The inconsistency in the data detracts from the utility of the developmental immunotoxicology data set.
3.4.2.6 Mechanistic studies
Most of the mechanistic studies employed high subcutaneous dose levels. The most widely studied mechanistic effect was expression of estrogen, progesterone, and androgen receptors in reproductive organs of rodents. In studies with gestational and lactational exposure of dams, effects on offspring were only observed with s.c. dosing. Decreases in ERα and androgen receptor and an increase in progesterone receptor expression were observed following s.c. injection of rats with 500 mg/kg bw/dose on 3 days during the late lactation period (Cotroneo et al., 2001). In mouse ovary, increases in ERα expression were noted at lower doses (≤10 μg/day) and reductions in expression were noted at a higher dose (100 μg/pup/day) following neonatal s.c. exposure (Jefferson et al., 2002a).
Two studies in which mice were s.c. injected with genistein in the neonatal period reported reductions in expression of testicular ERα (≥7 mg/kg bw) and androgen receptor (≥71 mg/kg bw/day) (Adachi et al., 2004), but no effect was reported following maternal dietary genistein exposure during gestation and lactation at up to 10 mg/kg bw/day (Fielden et al., 2003). Reduction in testicular androgen receptor expression was also reported in rats exposed to 1000 ppm genistein in diet from weaning to PND 35 (Fritz et al., 2003). In two studies examining androgen receptor expression in rats exposed through diet from gestation through weaning or adulthood, results were somewhat variable in different generations and often not dose-related, but reductions in expression were noted for ERα (≥25 ppm) and ERβ (≥100 ppm); (Dalu et al., 2002; Fritz et al., 2002b); one of the studies also reported reduced expression of androgen receptor (Fritz et al., 2002b).
Results of estrogen or progesterone receptor expression in mammary gland following oral or s.c. exposure in rats were variable, with no obvious patterns related to dose or period of exposure observed (Cotroneo et al., 2002; You et al., 2002b; Cabanes et al., 2004). One series of studies was interpreted by authors as suggesting that acute s.c. exposure of immature animals to genistein 500 mg/kg bw results in increased differentiation of immature terminal end buds, leading to a greater number of lobules, thought to be more resistant to carcinogens, during adulthood (Lamartiniere, 2000). It appeared that the effects were mediated through ERs, which regulate progesterone receptor and EGF receptor. Upregulation of EGF receptor in immature rats does not occur through tyrosine phosphorylation. EGFR is down-regulated in adult rats, and it has been hypothesized that a less active EGF-signaling pathway in adulthood suppresses mammary cancer development. A third study reported upregulated expression of BRCA1, a tumor suppressor gene involved in DNA damage repair, following s.c. exposure of rats to genistein during the lactational period (Cabanes et al., 2004).
Conclusions of the Expert Panel
There are no data on human genistein exposure during pregnancy.
There are no data on genistein exposure during childhood.
Evidence is sufficient to conclude that genistein produces developmental toxicity in rats manifested as transient decreased F1 and F3 pup body weight following dietary exposure to a BMDL10 of 20–26 mg/kg bw/day (LOAEL 7–9 mg/kg bw/day) in a multi-generational study.Other studies showed developmental effects including decreased litter size, decreased pregnancy rate, decreased mated dams delivering litters, disrupted estrous cycles, altered ovarian histopathology, prostate tissue changes, and accelerated vaginal opening at LOAELs ranging from 12.5–83 mg/kg bw/day. Some of these effects were seen at similar doses in mice.
Other findings of possible significance include hyperplasia of the male mammary tissue at a LOAEL of 7 mg/kg/day in the multigenerational study and alveolar proliferation in female mammary tissue at LOAELs of 15 mg/kg bw/day (prenatal exposure) and 30 mg/kg/day (lactational/post-pubertal exposure).
The experimental animal data are assumed relevant to the assessment of human risk.
Note: The definitions of the term sufficient and the terms assumed relevant, relevant, and not relevant are in the CERHR guidelines at http://cerhr.niehs.nih.gov/news/guidelines.html.
4.0 REPRODUCTIVE TOXICITY DATA
4.1 Human Data
Bajpai et al. (2003), supported by the US Agency for International Development, evaluated the effects of genistein and other tyrosine phosphorylase inhibitors on tyrosine phosphorylation and motility in human sperm in vitro. Sperm were collected by masturbation and incubated for 6 hr in Hams F10/human serum albumin with or without genistein 400 μM [108 mg/L; purity not specified]. Viability of sperm at this concentration was verified using the hypo-osmotic swelling test and the mitochondrial tetrazolium salt test. Motility parameters were assessed using CASA. Fixed sperm were permeabilized with methanol and incubated with a phosphotyrosine antibody detected using a fluorescein isothiocyanate-labeled second antibody. Western blot was also performed on whole sperm and solubilized proteins to identify and quantify phosphotyrosine-containing proteins by molecular weight. Sperm kinase activity was measured using a commercial kit. Statistical comparisons with control sperm were made using the Wilcoxon sign-rank test, paired t-test, and Welch test.
Hourly monitoring of incubated control samples showed a time-dependent increase in tyrosine phosphorylation with an increase in sperm velocity and amplitude of lateral head displacement. There was no detected change in percent motility, sperm linearity, or flagellar beat frequency over time. Incubation with genistein resulted in significantly decreased percentages of motile and progressively motile sperm and a decrease in hyperactivated sperm compared to control. There were also significant decreases in sperm velocity, linearity, and amplitude of lateral head displacement. Sperm phosphotyrosine residues and kinase activity were significantly decreased by genistein. The authors concluded that genistein exhibited a broad range of tyrosine kinase inhibitory activities consistent with cited competition with adenosine triphosphate (ATP) in the kinase reaction. [A second study from this laboratory (Bajpai and Doncel, 2003) used similar methods and obtained similar results. In this second study, the effects of genistein on sperm in vitro were also shown when samples were co-incubated with cyclic adenosine monophosphate (cAMP) and pentoxifylline.]
Strengths/Weaknesses
Strengths include the use of subjects as their own controls, the multiple sperm motion parameters and tests of viability, and the use of a concentration of genistein that did not impair viability. The authors did not show, however, that in vitro exposure of sperm to genistein at this concentration is a model of human exposure to this compound; genistein was selected as an inhibitor of tyrosine phosphorylation, which was the principal focus of these studies. These studies do not provide information on the men who provided semen samples, and it is not clear how many different ejaculates were collected. It is not known if the Western blot data were normalized for differences in loading. Use of a single concentration of genistein prevented any dose–response modeling. There were no controls for normal human variation.
Utility (Adequacy) for CERHR Evaluation Process
These reports are somewhat useful as ancillary information.
4.2 Experimental Animal and In Vitro Data
This section addresses reproductive effects following genistein exposure of adult animals. Reproductive effects after exposure to genistein during development are addressed in Section 3.2.1.
4.2.1 Female reproduction
4.2.1.1 In vivo studies
Studies are presented in order of mice followed by rats and oral exposures followed by parenteral exposures.
Moersch et al. (1967), from Parke, Davis and Company, tested a series of isoflavones and related compounds for litter prevention in mated mice. A compound was considered positive if no litters were produced. Genistein was negative at an oral dose of 10 mg/kg. [This report contains few details on the preparation of genistein or the conduct of the experiment.]
Strengths/Weaknesses
The strength of this study is the oral exposure route, which is relevant to humans; however, there is inadequate detail for an evaluation of the methods and results of the study.
Utility (Adequacy) for CERHR Evaluation Process
This study is not useful in the evaluation process.
Milligan et al. (1998), in a study supported by the UK Medical Research Council, used an in vivo method to examine the short-term estrogenic effects of genistein and nine other compounds. Three-month-old female albino mice were ovariectomized at least 2 weeks prior to receiving single s.c. injections of genistein ≥10−8 mol [2.7 μg; purity not stated] in saline. [Although the specific number of animals treated with genistein was not provided, 6–12 animals/group were used for all treatments.] Radiolabeled albumin was injected into the jugular vein 3.5 hr after genistein exposure, and permeability of uterine vasculature was measured 4 hr after exposure by determining uterine extravascular albumin volume. Data were analyzed by ANOVA. The genistein dose required to induce a marked increase in uterine vascular permeability (~10−6 mol [270 μg]) was about 1000–10,000-fold higher than the 17β-estradiol dose and about 10-fold higher than the dose of coumestrol, the most potent phytoestrogen tested. Prior treatment of the mice with the anti-estrogen, ICI 182,780, blocked the increase in uterine weight and uterine vascular permeability induced by 10−6 mol genistein and other estrogenic compounds.
Strengths/Weaknesses
Strengths include the use of uterine vascular permeability as a sensitive endpoint, the comparison to other estrogens, including other xenoestrogens, the use of an anti-estrogen to suggest a receptor-mediated mechanism, and the inclusion of 17β-estradiol as a positive control. Weaknesses include the lack of statistical analysis of uterine weight effects, which prevents a comparison of the sensitivity of this endpoint with vascular permeability, the use of mol instead of mg/kg bw to express dose levels, and the unexplained finding of a greater effect of estriol than of 17β-estradiol on uterine weight. The latter finding suggests that variability in the results may preclude rigorous interpretation of these data.
Utility (Adequacy) for CERHR Evaluation Process
This study is useful in showing that genistein is relatively weak at producing uterine effects, reducing the likelihood that genistein exposure is a reproductive risk. The uterine vascular permeability effects are difficult to use in the evaluation without a clear indication of the relative sensitivity of this endpoint compared to uterine weight.
Hughes (1987), funding not identified, iv administered vehicle, genistein, coumestrol, or 17β-estradiol [purity not specified for any chemical] to ovariectomized adult female rats [age not specified; probably about 6 weeks old based on body weight of 125–150 g]. GnRH 50 ng/kg bw or an equal volume of saline was administered, and blood was obtained 15 min later for measurement of serum LH. Treatments were administered and blood samples drawn using intra-atrial cannulas that had been placed under ketamine anesthesia 4 hr before the experiments. Serum LH was compared by 1-way ANOVA with least significant difference multiple comparison procedure. Results are summarized in Table 69. In the vehicle-treated group, injection of GnRH was followed by a 2.3-fold increase in serum LH. A comparable increase was seen in animals treated with 17β-estradiol at either 10 or 100 ng/kg bw, although after 17β-estradiol 10 ng/kg bw, baseline and stimulated LH concentrations were both higher than in the vehicle-treated group. The response to GnRH was suppressed by 17β-estradiol at a dose of 1000 ng/kg bw. Coumestrol was described as modestly blunting the response to GnRH at all doses based on the lack of significant increase in LH over baseline. [The increase may not have reached statistical significance due to the large variance and small number of animals; it appears unlikely that 10 and 100 ng/kg bw coumestrol would blunt the response to GnRH when the same doses of 17β-estradiol were without effect.] Genistein at 10 ng/kg bw inhibited the response to GnRH, an effect characterized by the author as “enigmatic.” Inhibition of the response to GnRH was also seen after a genistein dose of 10,000 ng/kg bw. Genistein 100 ng/kg bw caused a greater increase in LH in response to GnRH than did vehicle pretreatment. The author concluded that the effects of genistein in this model were similar to those of 17β-estradiol with a 10-fold difference in potency; that is, genistein 100 ng/kg and 17β-estradiol 10 ng/kg accentuated the response to GnRH and this response was inhibited by genistein at 10,000 ng/kg bw and by 17β-estradiol at 1000 ng/kg bw. The author indicated that comparisons of estrogenic potency can vary depending on the estrogenic endpoint being considered.
Table 69.
Response to GnRH in Ovariectomized Adults Female Rats Treated with 17β-Estradiol, Coumestrol, or Genistein
| Intra-atrial treatment ng/kg bw | Change in serum LH (fold change over baseline value 15 min after GnRH; estimated from figure in the original paper) |
|---|---|
| Vehicle (n = 3–8) | 2.3a |
| 17β-Estradiol (n = 3–8/dose group) | |
| 10 | 2.0a,b |
| 100 | 2.4a |
| 1000 | 1.3 |
| Coumestrol (n = 3 or 4/dose group) | |
| 10 | 2.2 |
| 100 | 1.9 |
| 1000 | 1.6 |
| Genistein (n = 2–4/dose group) | |
| 10 | 1.6 |
| 100 | 3.7a,b |
| 1000 | 3.3a |
| 10,000 | 1.3 |
Significant increase from baseline LH concentration.
Significantly greater response than occurred after vehicle pretreatment, based on absolute level of LH rather than fold-difference over baseline level.
From Hughes (1987).
Strengths/Weaknesses
Strengths of this study include the comparison of effects at high and low exposure levels and the use of 17β-estradiol as a positive control. Use of LH as an endpoint without assessment of reproductive parameters (ovulation, cyclicity, fertility) is a weakness. The effects of 17β-estradiol, and therefore of genistein, on LH are difficult to understand given the expectation that high-dose estrogens should stimulate the LH surge and low-dose estrogens should suppress LH.
Utility (adequacy) for CERHR Evaluation Process
This study is useful in suggesting hypothalamic-pituitary sensitivity to genistein, but the experimental approach makes it difficult to interpret mechanistic information due to the dual role of 17β-estradiol in regulating hypothalamic-pituitary function.
Hughes et al. (1991b), support not indicated, ovar-iectomized adult female rats within 5 days of receiving them [age not specified; probably about 6 weeks old based on body weight of 125–150 g]. Intra-atrial cannulas were placed under ketamine anesthesia. These animals were used in three experiments. Rats in the first experiment were given single doses of propylene glycol vehicle, 17β-estradiol, or genistein by gavage at doses of 0, 0.1, 1, or 10 mg/kg bw. Blood was drawn through the cannula every 15 min, beginning 15 min before the treatment and for 150 min thereafter for measurement of serum LH. 17β-Estradiol decreased LH concentration from 60 min after treatment until the end of the experiment at all tested doses. By contrast, genistein had no effect by gavage at any dose. In the second experiment, the same doses were given through the intra-atrial cannula. 17β-Estradiol suppression of LH was again seen. Genistein suppression of LH was noted only in the low-dose group (0.1 mg/kg bw) beginning 60 min after administration. [The Panel noted that the LH concentrations in the three genistein dose groups were similar to one another; however, there were large variances, particularly among the controls, and the large variances may have contributed to the lack of statistical significance.] At 120 min after the administration of vehicle, 17β-estradiol, or genistein, a dose of GnRH was given, and serum LH was determined 15 and 30 min later. 17β-Estradiol blunted but did not eliminate the LH response to GnRH, whereas all three doses of genistein eliminated the LH response to GnRH. In the third experiment, rats were treated s.c. with vehicle, 17β-estradiol 90.32 mg/kg bw, or genistein 0.32 or 3.2 mg/kg bw 3 days prior to insertion of cannulas. Four hours later, progesterone was given s.c., and blood was sampled for LH every hour, with the expectation of a progesterone-induced LH surge in estrogen-primed animals. In the vehicle-treated group, progesterone administration resulted in a decrease in serum LH concentration. 17β-Estradiol suppressed serum LH concentration from the outset; there was no additional suppression after administration of progesterone, and there was no LH surge. Genistein had no detected effect on serum LH concentration in this experiment. [The authors noted one statistically significant difference in the low-dose group at a single time point; the Expert Panel judges this finding unlikely to be of biologic significance.]
The authors postulated a biologic basis for genistein effects in Experiment 2 only at the low dose. They also attempted to explain their inability to induce an LH surge in Experiment 3 by invoking possible estrogenic effects of sesame oil or lab chow.
Strengths/Weaknesses
The comparison of oral and injected exposure routes is a strength, and the inclusion of multiple dose levels permits evaluation of the dose–response relationship. That genistein appears to be more potent than 17β-estradiol in suppressing GnRH-stimulated LH release suggests a non-ER-mediated effect. Attempts at comparing acute and chronic effects failed due to the inconsistent experimental design. The progesterone response (positive effect on LH release) was contrary to its known negative feedback effects. The figures did not contain results of statistical analysis, making it difficult to interpret the data. As was the case for Hughes et al. (1987), the dual action of 17β-estradiol on the hypothalamus/pituitary makes the results difficult to interpret, and no biologic endpoints of reproductive capacity were measured. There were no compelling data to support genistein effects after oral exposure.
Utility (Adequacy) for CERHR Evaluation Process
This paper is useful in suggesting that genistein effects may be non-estrogenic.
Hughes et al. (1991a), support not indicated, performed a study as a follow-up to the unexpected results of Hughes et al. (1991b), in which priming of castrate female rats with 17β-estradiol or genistein failed to lead to an increase in LH after administration of progesterone. As in Hughes et al. (1991b), adult female rats were obtained at 125–150 g bw [estimated to be 6 weeks of age] and were ovariectomized within 5 days of receipt. Four experiments were conducted 2–5 weeks later. In the first experiment, sesame oil vehicle, estradiol benzoate 0.8 mg/kg bw, or genistein 0.8 mg/kg bw were given s.c. (n = 7/dose group [chemical purities not given]). Three days later, trunk blood was collected after decapitation for measurement of serum LH. There was a significant suppression of serum LH by estradiol benzoate, but no detected effect of genistein. In the second experiment, ovariectomized rats (10 per group) were treated with the same doses of sesame oil, estradiol benzoate, or genistein and 3 days later were given progesterone. Serum LH was measured 2 and 4 hr later. Estradiol benzoate pretreatment caused an increase in LH in response to progesterone, whereas sesame oil and genistein pretreatment did not result in a detected increase in LH in response to progesterone. The third experiment was identical to the second experiment, except that the doses of estradiol benzoate and of genistein were increased to 8 mg/kg bw, and zearalenol and zearalenone were also tested (8 rats/treatment group). Once again, genistein pretreatment failed to result in a detected increase in LH in response to progesterone. In the fourth experiment, ovariectomized rats were injected [route not stated, but believed to be s.c. based on the other experiments] with vehicle (sesame oil or corn oil), estradiol benzoate, genistein, or zearalenol, all at 0.8 or 8 mg/kg bw (8 rats/treatment group). Animals were monitored for cornified cells in the vaginal smear, and the number of days of cornified smears was reported. Estradiol increased the number of days of cornified cells in the vaginal smears, but none of the other treatments did so. As part of the same experiment, intra-atrial cannulas were implanted on the third post-treatment day, and serum LH was measured 15 min before treatment with GnRH and at 15 min thereafter for three more samples. The group pretreated with vehicle demonstrated the expected increase in LH in response to GnRH. A similar increase in LH after GnRH was seen after pretreatment with estradiol benzoate and genistein at 0.8 mg/kg bw but not after pretreatment with genistein 8 mg/kg bw or with either dose of zearalenone. [No information was given about the response to GnRH after the estradiol 8 mg/kg dose. Results include fewer than eight animals for some of the dose groups; no comment was made about missing animals.] The authors concluded that genistein may have greater activity on the pituitary (altering the response to GnRH) than on the hypothalamus (tonic LH secretion; priming for the progesterone stimulation of LH release).
Strengths/Weaknesses
The comparison of oral and injected routes, the comparison of low and high dose levels, and the use of 17β-estradiol as a positive control are strengths of this study. The effects of chronic exposure were investigated. Genistein was more potent than 17β-estradiol in inhibiting GnRH-stimulated LH release, but as in the two previous studies from this laboratory (Hughes, 1987; Hughes et al., 1991b), the results are difficult to interpret due to the dual effects of 17β-estradiol on hypothalamic-pituitary response. The design of the studies confounded the clear interpretation of the results in a mechanistic context, and no indication of the anticipated effects on reproductive function was provided.
Utility (adequacy) for CERHR Evaluation Process
This paper is useful in suggesting that genistein may have a potent hypothalamic-pituitary effect through a non-estrogenic mechanism.
Flynn et al. (2000b), supported by NIEHS and FDA, evaluated lactation behavior as part of a multigenerational study of genistein in Sprague-Dawley rats. The F0 animals were given soy- and alfalfa-free feed from weaning. At 42 days of age, males and females were given dietary genistein (<99% purity) 0, 5, 100, or 500 ppm, providing estimated daily genistein intakes of 0, 0.4, 8, or 40 mg/kg bw/day. The animals were mated beginning on PND 70. Subsequent generations were weaned to the same diet as their parents, except for the F3 generation, which was weaned to untreated feed. [The report indicates “n = 40” for parents of each generation; it is not clear whether this description means five mated animals/sex/treatment for each generation.] Litters were culled to four males and four females on PND 2, with rare fostering within treatment group to maintain litter size and sex distribution. Maternal lactation behavior was evaluated by observing each dam for <1 minute during the first hour of each light period on PND 3, 7, 10, 14, 17, and 21. Dams with an arched-back position over at least one pup were considered to be nursing. The percent of dams nursing within each group was evaluated by 3-way ANOVA with treatment, generation, and PND as between-group variables. Significant differences were further evaluated by 1-way ANOVA with Bonferroni or Bonferroni/Dunn post-hoc testing. There were no significant interactions between treatment, generation, or PND and percentage of dams nursing, and data were collapsed across generations and PND. No significant effect of genistein treatment on the collapsed percentage of dams nursing was detected. The authors concluded that altered maternal lactational behavior did not explain pup weight alterations noted in an unpublished genistein multi-generational study. They acknowledged that other maternal behaviors such as nest-building and pup-retrieval were not evaluated.
Strengths/Weaknesses
The evaluation of maternal lactational behavior and the use of soy- and alfalfa-free feed are strengths of this study. The failure to observe other behaviors is a weakness and prevents conclusions from being reached about the lack of detectable effect of treatment. It would have been useful to follow pup weight as an indicator of adequate nutrition, and an estrogenic positive control should have been included.
Utility (Adequacy) for CERHR Evaluation Process
This study is not useful in the evaluation process.
Okazaki et al. (2002), supported by the Japanese Ministry of Health, Labor, and Welfare, treated 7-week-old female Crj CD(SD)IGS rats with genistein [purity not specified] 0, 120, 400, or 1000 mg/kg bw/day by gavage for 28 days as part of an OECD Enhanced Test Guideline 407 oral dose toxicity study (n = 10/dose group). The animals were given a commercial diet that contained phytoestrogens at about 100 ppm, giving an estimated dietary phytoestrogen intake of <10 mg/kg bw/day. The authors considered this dietary exposure to be inconsequential. Estrous cycle stage was monitored by vaginal smear beginning on treatment day 23. Females were killed on the first diestrus following the last treatment, and blood was collected for serum hormone measurement. Necropsies included determination of reproductive organ weights and histologic assessment by light microscopy. Statistical analysis was performed using the Dunnett test or Dunnett-type mean rank test, χ2, Fisher, or Mann-Whitney U-test. There were no detected treatment effects on body weight, feed consumption, estrous cycles, or reproductive organ weights. Serum 17β-estradiol, testosterone, and prolactin were not found to differ by treatment group. Histologic evaluation showed “slight or mild” vacuolation and mucinification of the vaginal epithelium in 2/10 animals/group after genistein treatment with 400 and 1000 mg/kg bw/day. The authors concluded that although the frequency of the vaginal changes was low, these changes represented an endocrine effect of genistein.
Strengths/Weaknesses
This fairly thorough investigation of the effects of oral genistein evaluated uterine morphology and estrous cyclicity. A small effect of genistein on vaginal epithelial morphology was shown. There were, however, no compelling findings with respect to reproductive function. The use of intact, cycling adults would be expected to make it more difficult to detect genistein effects, and no positive control such as 17β-estradiol was used. The use of a genistein dose level high enough to cause generalized toxicity is an additional weakness.
Utility (Adequacy) for CERHR Evaluation Process
This study is useful in suggesting that uterine histologic evaluation is a more sensitive endpoint than is uterine weight or cyclicity. Oral genistein exposure does not appear to produce significant impact on reproductive parameters.
Cotroneo and Lamartiniere (2001), supported by NIH, evaluated the ability of genistein to support ectopic uterine implants in a rat model of endometriosis. Female Sprague-Dawley rats underwent surgery at 9 weeks of age. The procedure involved a midline laparotomy with removal of “a small piece of uterine tissue.” The tissue was cut into 3-mm squares, and two squares per rat were sutured to a blood vessel in the intestinal mesentery. [Further detail was not given. The Panel noted that other laboratories use a full-thickness of uterine wall to construct implants.] Three weeks later, rats underwent another laparotomy, at which time the condition and size of the implants were noted and some of the rats underwent bilateral ovariectomy. After this second operation, rats were given AIN-76A, a phytoestrogen-free diet [previous diet not specified].
In the first experiment, ovariectomized rats were given daily s.c. injections of estrone 1 μg/rat [estimated to be 3.5–4 μg/kg bw] (n = 7), genistein 5 mg/kg bw (n = 10), genistein 16.6 mg/kg bw (n = 8), or genistein 50 mg/kg bw (n = 7) [purity of estrone and genistein not given]. Vehicle-injected rats included six animals injected with sesame oil (control for estrone vehicle) and 14 rats injected with DMSO (genistein vehicle). Injections were given for 3 weeks. In the second experiment, ovariectomized rats were given untreated AIN-76A diet (n = 17), AIN-76A diet with genistein 250 mg/kg feed ([ppm] n = 12), or AIN-76A diet with genistein 1000 mg/kg feed ([ppm] n = 11) for 3 weeks. [Genistein intake was not estimated because feed consumption was not reported. In the Discussion section, the authors state that an average daily feed consumption of 15 g per 300 g-rat would give a daily genistein exposure of 16 mg/kg bw for the 250 ppm dietary treatment.] In the third experiment, 10 ovary-intact rats per dose group were placed on untreated AIN-76A diet or on AIN-76A+genistein 250 mg/kg feed for 3 weeks. [Genistein intake was not estimated because feed consumption was not reported.]
Animals in all three experiments were killed after 3 weeks on the respective treatments (ovary-intact rats were killed in estrus). Implants were assessed for viability, which was defined as being fluid-filled. In the ovary-intact rats in Experiment 3, implant size was measured and compared to the implant size prior to the diet intervention. Relative uterine weights were evaluated, and uteri were frozen for later evaluation by Western blot for ERα and progesterone receptor. Serum was frozen for later determination of 17β-estradiol and progesterone by RIA in ovary-intact animals, and genistein was determined by HPLC-MS (limits of detection 10 pM [2.7 ng/L]) in ovariectomized animals. Statistical comparisons were made using Student t-test, ANOVA [post-hoc test not indicated], and Fisher test.
In the injection study (Experiment 1), no ovariectomized rat given vehicle or genistein 5 mg/kg bw/day had surviving implants after 3 weeks. All of the rats given injections of estrone or either of the two higher doses of genistein had surviving implants. There were no surviving implants in ovariectomized rats given untreated AIN-76A diet or genistein-treated feed (Experiment 2). All ovary-intact rats in Experiment 3 had at least one surviving implant, but there was no detected difference between the groups (AIN-76A feed with or without added genistein) in the proportion with nonviable implants, the proportion of implants with increased or decreased growth, or the average size change of the implants. [The proportion of implants with size change and average size change were analyzed on a per implant basis, rather than a per rat basis.]
Relative uterine weight was increased in ovariectomized rats given daily s.c. injections of estrone or genistein at the two highest doses (16.6 and 50 mg/kg bw/day). The relative uterine weight [estimated from a graph] was 250% of control after estrone injections, and 175% and 325% of control after the 16.6 and 50 mg/kg bw/day doses of genistein. The group exposed to the low dose of genistein (5 mg/kg bw/day) had a mean relative uterine weight 150% of control, which was not statistically significant. There were reportedly no treatment-related effects on mean body weight at the end of the experiment; however, the high-dose genistein and the estrone injections produced a significant reduction in the percent body weight gain over the course of the experiment. In ovariectomized rats fed a diet containing genistein, relative uterine weight was increased to almost 200% of control [estimated from a graph] at a genistein level of 1000 mg/kg feed. No significant change in relative uterine weight at a genistein level of 250 mg/kg feed was detected. Neither dietary treatment was observed to produce a significant effect on mean body weight at the end of the experiment or on percent body weight gain.
The injection of estrone or of genistein at the two highest doses resulted in a decrease in ERα. Progesterone receptor isoform A was increased by the two lowest genistein injections, but not by the highest genistein dose or by estrone. Progesterone receptor isoform B was increased by all doses of injected genistein and by estrone. The addition of genistein to the diet was reported not to significantly change ERα levels. The higher dietary concentration of genistein resulted in an increase in both progesterone receptor isoforms. In ovary-intact rats, no effect of genistein in the diet on serum 17β-estradiol or progesterone levels was detected. Serum genistein levels are given in Table 13.
The authors concluded that genistein by s.c. injection is active in supporting endometriotic implants, reducing ERα, and increasing progesterone receptor at 16.6 mg/kg bw/day, but that dietary exposure was not effective in supporting endometriotic implants at either of the tested levels of exposure and produced estrogenic effects only at the 1000 mg/kg feed exposure level. This genistein exposure level produced serum concentrations of genistein well above those anticipated from a soy-rich diet. The authors believed the 16.6 mg/kg bw/day injection schedule to provide genistein in amounts similar to the 250 mg/kg feed diet, but believed that dietary genistein was considerably less available than injected genistein because of differences in absorption, protein binding, and conjugation by sulfation or glucuronidation.
Strengths/Weaknesses
The comparison of oral and injection routes of exposure and the comparison of ovariectomized and intact animals are strengths. Weaknesses include the use of estrone rather than 17β-estradiol as a positive control and the focus of the paper on results in the intact uterus rather than on endometriosis, the stated subject of the study.
Utility (Adequacy) for CERHR Evaluation Process
This study suggests that oral exposure to genistein does not produce a significant impact on reproductive parameters. Progesterone receptor expression may be a very sensitive endpoint for estrogenic effects.
4.2.1.2 In vitro studies
Whitehead et al. (2002), in a study supported by the Woolfson Foundation, examined the effects of genistein and other tyrosine kinase inhibitors on steroid synthesis by human granulosaluteal cells. Granulosa cells were obtained from patients undergoing assisted fertilization procedures. Basal progesterone and 17β-estradiol production were measured by RIA in cells cultured with genistein 1, 10, or 50 μM [0.27, 2.7, or 13.5 mg/L] for 48 hr. Progesterone and 17β-estradiol levels were also measured in cells cultured for 4 (acute) or 24 (chronic) hr in media containing genistein 50 μM [13.5 mg/L] and substrates for progesterone (pregnenolone) and 17β-estradiol (androstenedione, estrone, testosterone) synthesis. At least three independent experiments were conducted, and results were averaged. Statistical analyses included ANOVA, Gabriel test, or Student t-test.
Genistein at 1.0–50 μM induced a concentration-related inhibition of basal and chorionic gonadotropin-induced progesterone production. A reduction in basal 17β-estradiol production was observed following incubation with genistein 50 μM [13.5 mg/L]. Both 4- and 24-hr exposures to genistein inhibited progesterone production in the presence of pregnenolone. Production of 17β-estradiol was significantly inhibited following incubation with genistein in the presence of estrone for 4 or 24 hr and in the presence androstenedione for 24 hr. A non-statistically significant decrease in 17β-estradiol production was observed when testosterone was used as a substrate and cells were incubated with genistein for 24 hr. No effect on cell viability was detected in these studies. Similar effects were observed with tyrosine kinase inhibiters lavendustin A and tyrphostin A23, with the exception that acute (but not chronic) exposure to tyrphostin stimulated 17β-estradiol production in the presence of androstenedione and testosterone as substrates. According to study authors, the data suggest that exposure of human granulose cells to genistein results in inhibition of 3- or 17β-hydroxysteroid dehydrogenase activity but not aromatase activity.
Strengths/Weaknesses
This study on human granulosa cells shows that genistein effects differ somewhat from those of other tyrosine kinase inhibitors; however, the mechanistic information was limited. It was not stated whether granulosa cells cultures were from individual patients or pooled for each experiment; the n values were not clearly explained. There was no discussion of how estrogenic effects and tyrosine kinase inhibition may relate to one another or interact or of the role of ER.
Utility (Adequacy) for CERHR Evaluation Process
This paper is not useful for the evaluation process.
Whitehead and Lacey (2000), support not indicated, examined the effect of genistein on protein synthesis by rat ovarian cells. Granulosaluteal cell cultures were prepared from ovaries of adult Porton Wistar rats and incubated in media containing genistein 0 0.5–50 μM [0.14–13.5 mg/L] for 48 hr. Progesterone production was measured by RIA following incubation with genistein alone or in combination with forskolin (an adenyl cyclase inhibitor), FSH, or interleukin-1β. Nitrite secretion by cells was determined using Griess reagent. Results from 9–15 experiments were averaged, and statistical significance was determined by Student t-test, ANOVA, or Gabriel test. Treatment with genistein resulted in significant concentration-related reductions in basal progesterone production at ≥0.5 μM [0.14 mg/L]. A concentration-related reduction in forskolin-induced progesterone production by genistein attained statistical significance at the highest concentration level (50 μM [13.5 mg/L]). A later experiment indicated that genistein 10 μM [2.7 mg/L] inhibited forskolin-induced progesterone production in addition to FSH-induced progesterone production. No effect of genistein treatment on cell nitrite production was detected. Treatment with genistein 50 μM [13.5 mg/L] in combination with interleukin-1β further enhanced the inhibition of progesterone production observed following treatment of cells with interleukin-1β alone. Incubation of cells with genistein 5 or 50 μM [1.4 or 13.5 mg/L] together with forskolin and interleukin-1β further enhanced the reduction in progesterone production observed following treatment with forskolin in combination with interleukin-1β. Similar results were obtained with the tyrosine kinase inhibitor lavendustin A. The study authors concluded that genistein inhibition of ovarian steroidogenesis occurs independently of cytokines and may be related to its protein tyrosine kinase inhibitor activity.
Strengths/Weaknesses
It is a strength of this study that granulosa cell collection for culture was staged to estrous cycles and that interactions of genistein with the interleukin-β pathway were investigated by measuring nitrite production and cellular viability as end points. The lack of effect of genistein on cell viability provided some evidence for lack of estrogenic effects on granulosa cells. The co-culture of granulosa cells with macrophages provided a component of biologic evaluation. Weaknesses include the lack of a positive control using the interleukin-β in nitrite assay, the lack of reference to any reported in vivo effects of tyrosine kinase inhibition on ovarian function, and the lack of positive controls in evaluating the estrogenic/anti-estrogenic effects of genistein.
Utility (Adequacy) for CERHR Evaluation Process
Although apparent anti-estrogenic effects of genistein mediated by its tyrosine kinase inhibitory effects were suggested, further studies are required to establish this mechanism using controls for estrogenic effects and performing in vivo analyses. This paper is not useful for the evaluation process.
Haynes-Johnson et al. (1999), from the Johnson Pharmaceutical Research Institute, examined the effect of genistein on hormone-stimulated 17β-estradiol and progesterone production in rat granulosa cell cultures. Granulosa cell cultures were prepared from 21–25-day-old Wistar rats. Genistein was added to cultures at 0.01–100 μM [2.7 μg/L–27 mg/L] following treatment of the cells with FSH or FSH+EGF. 17β-Estradiol and progesterone production were measured by RIA. Data were assessed with the SuperAnova package of general linear models. Genistein inhibited FSH-induced 17β-estradiol production at ≥30 μM [8.1 mg/L]. Genistein did not reverse EGF-induced inhibition of 17β-estradiol production. Genistein enhanced FSH-induced progesterone secretion at 0.3–3 μM [81810 μg/L] but inhibited FSH-induced progesterone production at concentrations ≥30 μM [8.1 mg/L]. EGF-induced progesterone production was inhibited by genistein, with a median inhibitory concentration of ~6.5 μM [1.8 mg/L] reported. The study authors concluded that genistein as well as the tyrosine kinase inhibitor RG 50810 selectively reduced FSH- and EGR-induced progesterone production in rat granulosa cells.
Strengths/Weaknesses
This study provided mechanistic information using dose response studies on isolated granulosa cells and several tyrosine kinase inhibitors, including genistein. Comparisons with protein kinase A and protein kinase C inhibitors permitted separating tyrosine kinase effects from the other protein kinases. The effects of genistein were found to not involve protein kinase A or C pathways. Estrogen production was properly evaluated by adding androstenedione as a substrate. It is a weakness for the purposes of this evaluation that little information was provided on genistein itself. The complicated Results section did not present a clear interpretation of findings and it was not clear whether estrogen or progesterone was the best endpoint for evaluating possible estrogenic effects of genistein.
Utility (Adequacy) for CERHR Evaluation Process
This paper is not useful for the evaluation process. The observation that genistein has tyrosine kinase inhibitory effects is not new.
Myllymäki et al. (2005), supported by the Turku University Foundation, Maj and Tor Nessling Foundation, and the European Commission, conducted a study to examine the effect of genistein on rat ovarian follicle cultures. Ovarian follicles were obtained from 14-day-old Sprague-Dawley rats and cultured. Genistein was added to cultures at concentrations of 0 (DMSO vehicle) or 10−8–10−6 M [2.7–270 μg/L], and the cultures were incubated for 3–5 days. Production of 17β-estradiol, testosterone, and progesterone were determined by fluoroimmunoassay. FSH-stimulated cAMP production was determined using a protein binding assay. P450 aromatase activity was determined using a tritium incorporation method. Data were analyzed by ANOVA, Dunnett pairwise multiple comparison t-test, or the least significant difference test.
No effect of genistein treatment on follicle cell survival was detected. In control cultures, 17β-estradiol and testosterone were steadily accumulated during the 3- and 5-day culture period. No effect of genistein on 17β-estradiol production during the 3-day incubation period was detected, but 17β-estradiol production was significantly reduced following a 5-day exposure to genistein 10−7 M [27 μg/L]. Testosterone production was significantly decreased following a 3-day exposure to genistein 10−6 M [270 μg/L] or a 5-day exposure to genistein ≥10−7 M [27 μg/L]. Aromatase activity was significantly increased and cAMP activity was significantly decreased following a 5-day exposure to genistein ≥10−7 M [27 μg/L]. The study authors concluded that genistein interfered with testosterone production by inhibiting cAMP production; because genistein stimulated aromatase activity, it was able to sustain estrogen production in spite of decreased testosterone levels.
Strengths/Weaknesses
Strengths of this study are the use of a range of concentrations and the comparison of different estrogenic compounds Weaknesses include failure to examine the classical in vitro tyrosine kinase inhibitory effect of genistein, although genistein was used at concentrations known to have this effect, and lack of confirmation that genistein acted through the ER by co-treatment with an ER antagonist. Thus, the genistein effect in this system may have been independent of its estrogenic properties.
Utility (Adequacy) for CERHR Evaluation Process
The utility of this study is limited by the fact that genistein effects were not clearly characterized as estrogenic. However, with proper controls, the study could represent an interesting and sensitive in vitro system that may help in identifying direct ovarian target molecules at prepuberty and may find explanations for some of the effects observed in vivo. In vitro systems do not reflect the complexity of events occurring in vivo, although they provide a simplified paradigm that may help identify target molecules.
4.2.2 Male reproduction
4.2.2.1 In vivo studies
Strauss et al. (1998), supported by the European Community, evaluated genistein for estrogenic activity in the reproductive tracts of male Han-NMRI mice. Some of the mice had been “estrogenized” as neonates with s.c. injections of diethylstilbestrol 2 μg/day or had been given corn oil vehicle (controls). In the first experiment, control animals were castrated at 3–5 months of age and treated after a 7-day recovery period with a single s.c. injection of 17β-estradiol or genistein [purity not specified] in corn oil at 0, 0.025, 0.25, or 2.5 mg/kg bw (n = 2 per treatment). Six hours later, the prostatic urethras were dissected and RNA extracted. Northern blot analysis was used to estimate c-fos mRNA. A time-course experiment was performed with 3–5-month-old mice that had been estrogenized neonatally with diethylstilbestrol. These animals were given genistein 5.0 mg/kg bw after castration, and prostatic urethras were obtained for determination of c-fos mRNA 3, 6, 12, or 24 hr after injection (n = 2 per time point). In the second experiment, neonatally diethylstilbestrol-treated mice were castrated, after which they were treated by s.c. injection at 3–5 months of age with 17β-estradiol 0.25 mg/kg bw/day (n=5), genistein 2.5 mg/kg bw/day (n = 11), or vehicle (n = 4). Urethroprostatic blocks were harvested after 10 days for evaluation of squamous metaplasia by light microscopy. [The treatment was described as daily, but whether the duration of treatment was the full 10 days was not specified.] In the third experiment, control animals were s.c. injected at 10 months of age with 17β-estradiol 0.25 mg/kg bw/day, genistein 2.5 mg/kg bw/day, or vehicle for 7 days [9 days according to the Results section] (n = 5/treatment). Trunk blood was collected for determination of serum LH and FSH. Pituitary glands and one testis were used for determination of tissue LH and testosterone. Serum and pituitary LH were estimated using an immunofluorometric assay, and serum and testicular testosterone were estimated using RIA. Ventral prostates and coagulating glands were weighed. A fourth experiment, performed to evaluate the effects of neonatal treatments on adult mice, is discussed in Section 3.2. Statistical analysis was performed for the third experiment using ANOVA followed by Tukey least significant difference test. [In the other experiments, tissues were pooled within groups, and there was no indication of statistical analysis.]
Messenger RNA for c-fos was described as increased by all doses of 17β-estradiol and genistein, with the maximum effect obtained after the middle genistein dose (0.25 mg/kg bw). The time-course experiment using neonatally estrogenized mice showed a maximum expression of c-fos mRNA 6 hr after treatment with genistein 5 mg/kg bw. [Statistical analysis was not presented; the data figures represent pooled tissues within groups.] The second experiment demonstrated metaplasia of the prostatic urethra in 5/11 genistein-treated animals, 5/5 17β-estradiol-treated animals, and 0/4 vehicle-treated animals. In the third experiment, treatment of 10-month-old animals with 17β-estradiol 0.25 mg/kg bw/day or genistein 2.5 mg/kg bw/day resulted in decreased relative weight of ventral prostate and coagulating gland, decreased pituitary LH content, and decreased serum and testicular testosterone. [Pituitary LH and testicular testosterone were expressed as hormone content per gland; gland weights were not reported.]
The authors concluded that genistein exerted estrogenic effects in the male reproductive tract of mice. They contrasted their findings with the lack of estrogenic effects reported after feeding soybean-based diets to male mice (Mäkelä et al., 1995a,b) and suggested that there may be a difference based on route of administration (s.c. compared to dietary). In addition, they indicated that soybeans contain a number of constituents other than genistein, and that these other constituents may modify estrogenicity of the genistein in the diet.
Strengths/Weaknesses
The use of mice pretreated with diethylstilbestrol compromises the interpretation of the findings. Furthermore, there are too few animals per treatment group, and there is a lack of statistical analysis. The male mouse is not particularly useful in examining the effects of estrogen on the reproductive system. Prostate gland metaplasia is a common finding in estrogen-treated male mice.
Utility (Adequacy) for CERHR Evaluation Process
This study is not useful in the evaluation process.
Okazaki et al. (2002), supported by the Japanese Ministry of Health, Labor, and Welfare, treated 7-week-old male Crj CD(SD)IGS rats with genistein [purity not specified] 0, 120, 400, or 1000 mg/kg bw/day by gavage for 28 days as part of an OECD Enhanced Test Guideline 407 oral dose toxicity study (n = 10/dose group). The animals were given a commercial diet that contained phytoestrogens at about 100 ppm, giving an estimated dietary phytoestrogen intake of <10 mg/kg bw/day. The authors considered this dietary exposure to be inconsequential. Males were killed the day following the last treatment and blood was collected for serum hormone measurement. Necropsies included determination of reproductive organ weights and histologic assessment by light microscopy. Sperm were collected from the right epididymis [method not specified] for morphologic assessment after eosin Y staining. The remainder of the cauda was frozen for subsequent counting of homogenization-resistant sperm heads. Statistical analysis was performed using the Dunnett test or Dunnett-type mean rank test, χ2, Fisher, or Mann-Whitney U-test. No treatment effects on body weight, feed consumption, or reproductive organ weights were detected. Serum 17β-estradiol and testosterone were not found to differ by treatment group. Serum prolactin was significantly elevated (approximately doubled) in the group given genistein 1000 mg/kg bw/day. There were no detected histologic effects of treatment on reproductive organs and no detected effects on sperm morphology or epididymal sperm head number. The authors questioned the significance of the prolactin elevation, citing the large variability in this parameter and its influence by stress.
Strengths/Weaknesses
In spite of the very high dose levels of genistein, there were no reported histologic changes in the reproductive organs and no changes in rat sperm morphology.
Utility (Adequacy) for CERHR Evaluation Process
This study is useful in showing a general lack of genistein toxicity in the reproductive system of the adult rat.
4.2.2.2 In vitro studies
Kumi-Diaka et al. (1998, 1999), supported by Florida Atlantic University, evaluated the cytotoxicity of genistein in cultured mouse testicular cells [strain not indicated]. The cell lines were obtained commercially and included Sertoli (TM4), Leydig (TM3), and spermatogonium (GC-1 spg) cells. Cells were cultured in genistein [purity not specified] 0, 10, 20, 50, or 100 μg/mL [37, 74, 185, or 370 nM] in one set of experiments (Kumi-Diaka et al., 1998) and genistein 0, 10, 20, 30, 40, 50, 60, 80, and 100 μg/mL [0, 37, 74, 111, 148, 185, 222, 296, and 370 nM] in a second set of experiments (Kumi-Diaka et al., 1999) for 48 hr [culture for up to 72 hr produced results similar to 48 hr (Kumi-Diaka et al., 1998)]. Endpoints included viability using tetrazolium reduction or trypan blue exclusion, apoptosis using a TUNEL-based commercial kit or fluorescence microscopy of ethidium bromide/acridine orange-stained sections, and lactate dehydrogenase release as an index of cytotoxicity. There was a concentration-dependent decrease in viability with a 50% reduction in tetrazolium-reducing cells at 40–50 μg/mL genistein (Kumi-Diaka et al., 1998). At these concentrations, there was a 15–20% decrease in trypan blue exclusion and a 30–40% incidence of cytotoxicity (Kumi-Diaka et al., 1999). [Effect levels in both papers were estimated from graphs.] Tests for apoptosis in both reports were positive in a proportion of cells similar to those showing non-viability. The authors concluded that “at a concentration of >10–100 μg/mL, genistein progressively and significantly inhibited the growth and proliferation of the cells, and caused significant apoptosis in a dose-dependent manner.” [In both papers, the authors appear to interpret the viability tests as also being tests of growth and proliferation.]
Strengths/Weaknesses
The experiments described in these papers appear to have been adequately performed; however, the authors appear to have confused cytotoxicity with impaired growth and proliferation. The findings in this study do not generally agree with reports of estrogen-like activity of genistein in the male rodent reproductive system.
Utility (Adequacy) for CERHR Evaluation Process
This in vitro study can be used as supplemental information. It is not directly relevant to the evaluation process.
Adeoya-Osiguwa et al. (2003), support not indicated, evaluated mouse sperm after in vitro exposure to genistein. 17β-Estradiol, nonylphenol, and 8-prenaryl-naringenin were also evaluated. Cauda epididymal sperm from mature TO mice were released into culture media and processed through a Sephadex column for removal of immotile cells. Experiments involving un-capacitated sperm were performed immediately, and experiments involving capacitated sperm were performed after 90-min incubation under liquid paraffin. Genistein [purity not specified] was evaluated at concentrations of 0, 0.001, 0.01, 0.1, and 1 μM [0, 0.27, 2.70, 27.0, and 270 μg/L]. Suspensions of uncapacitated or capacitated sperm were exposed to the test compounds for 30 min, after which chlortetracycline fluorescence was used to evaluate the proportion of sperm that became capacitated and acrosome-reacted. Sperm were incubated with genistein 0.1 μM with or without the anti-estrogen hydroxytamoxifen (5 μM) to evaluate a possible estrogen-mediated mechanism of action. In another experiment, sperm were exposed to genistein 0 or 0.1 μM [0 or 27 μg/L] for 15 min, after which the genistein solution was diluted 1:10 and cumulus-oocyte complexes from super-ovulated mice were added for 60 min. Oocytes were fixed and stained for evaluation of fertilization as demonstrated by resumption of the second meiotic division and the presence of a decondensing sperm head. Statistical analysis was by the Cochran modification of the χ2 test.
Genistein exposure increased the proportion of sperm with staining patterns suggesting capacitation and acrosome reaction in uncapacitated sperm (at ≥0.001 μM) and acrosome reaction in capacitated sperm (at ≥0.01 μM [2.7 μg/L]). Motility was described as increased by subjective determination [methodology not described]. Co-incubation with hydroxytamoxifen was not shown to alter the effect of genistein 0.1 μM [27 μg/L] on capacitation or acrosome reaction. In vitro exposure to oocytes after incubation of mouse sperm with genistein 0.1 μM [27 μg/L] increased the proportion of fertilized oocytes to 79.5% from the control value of 35.4%. The responses to nonylphenol and 8-prenarylnaringenin were similar to those of genistein; however, 17β-estradiol did not affect capacitated sperm and required concentrations of 1 μM or higher to affect uncapacitated sperm. The authors suggested that the increases in capacitation, acrosome reaction, and fertilizing ability produced by in vitro exposure to genistein were not likely to be mediated by a genomic mechanism. They postulated that the effects on sperm function of genistein, nonylphenol, and 8-prenarylnaringenin might represent interaction with a sperm membrane receptor or an intracellular receptor the effect of which was not mediated through altered transcription.
Strengths/Weaknesses
This study suggested that several estrogen-like agents interact with mouse sperm membrane receptors. The description of increased motility was weakened by the lack of information on method of assessing motility. The biologic significance of incubating genistein-exposed mouse sperm with oocytes and showing an increase in fertilization is unknown and difficult to extrapolate.
Utility (Adequacy) for CERHR Evaluation Process
These findings have limited relevance to the action of genistein. This study is not useful in the evaluation process.
Norton et al. (1994), supported by NIH, evaluated the effect of genistein on the function of cultured rat Sertoli cells. This study focused on elucidation of the mechanism of PModS (peritubular factor that modulates Sertoli cell function), a paracrine factor produced by paratubal cells that affects Sertoli cell functions such as transferrin secretion. Genistein was evaluated because of its tyrosine kinase-inhibiting activity. Sertoli cells were isolated from 20-day-old rats [strain not specified] and grown on serum-free Ham F-12 medium. Transferrin concentration in the medium was measured after 72 hr of treatment with various factors in the presence or absence of genistein [purity not given] and normalized for DNA content of the cultures. In control cultures (no genistein added), FSH, PModS, and bovine calf serum caused an increase in transferrin secretion. In the presence of genistein 3.5 μM [946 μg/L], FSH was no longer effective in increasing transferrin secretion, and in the presence of genistein 35 μM [9.46 mg/L] neither FSH not PModS was effective in increasing transferrin secretion. The authors concluded that PModS can influence tyrosine phosphorylation in Sertoli cell proteins, and that inhibition of tyrosine phosphorylation abolishes PModS activity on Sertoli cells.
Strengths/Weaknesses
This study used an interesting molecular approach to examine the action of genistein on cultured rat Sertoli cells; however, the biologic endpoints are difficult to interpret relative to the overall action of genistein on testicular cells in vitro.
Utility (Adequacy) for CERHR Evaluation Process
The utility of these data is limited with respect to reproductive effects, and this study is not useful in the evaluation process.
Hinsch et al. (2000), supported by the German Academic Exchange Service and the Deutsche Forschungsgemeinschaft, conducted an in vitro study to examine the effects of genistein on bovine sperm. In studies of acrosomal reaction and viability, sperm were incubated in medium containing 1 μM progesterone, with or without addition of genistein 2 μg/mL [7.4 nM] for 25 min. Cells that underwent acrosomal exocytosis were identified by staining with fluorescein isothiocyanate conjugated with Pisum sativum (pea) agglutinin. Hoechst 33258 staining was used to determine cell viability. In an assay to determine spermatogenic penetration of the zona pellucida, bovine sperm and ova were incubated with genistein 0, 0.02, 0.2, or 2 μg/mL [0, 0.074, 0.74, or 7.4 nM] for 4 hr. [No details were provided about a motility assay or statistical methods.] No effect of genistein on sperm motility or viability was detected. Acrosome reaction was inhibited by genistein 2 μg/mL. A dose-related decrease in binding of the spermatozoa to the zona pellucida was observed at genistein concentrations ≥0.2 μg/mL. The study authors concluded that their methods can be used in reproductive toxicity screening. However, they urged caution in extrapolation of results to humans because bulls are selected for reproductive capacity and may be less susceptible to xenobiotics than humans.
Strengths/Weaknesses
This study was well designed but is weakened by the lack of information on experimental and analytic methods. The authors’ expression of caution in extrapolation of results to humans is well founded.
Utility (Adequacy) for CERHR Evaluation Process
This study may be useful as supplemental information, but it is not directly relevant to the evaluation process.
Iwase et al. (2005), support not indicated, examined the effect of genistein on intercellular communication in a mouse Leydig cell culture. In a series of experiments, Leydig TM3 cells were incubated in media containing genistein 0 or 10−6–50 μM [270 ng/L–13.5 mg/L]. DMSO was the vehicles used in the studies. A Lucifer yellow microinjection technique was used to determine effects on gap junctional intercellular communication. To examine mechanisms of effects, cell were treated with and without the addition of 5–10 μM ICI (an ER antagonist) or 200–400 nM calphostin C (a protein kinase C inhibitor). Cytotoxicity was determined using a staining method, and cell growth was monitored by measuring nucleic acid content. Data were statistically analyzed using the Wilcoxon test.
Following a 24-hr treatment period, genistein significantly inhibited gap junctional intercellular communication at ≥12.5 μM [3.4 mg/L]. No cytotoxicity was observed at the genistein concentration where inhibited gap junctional intercellular communication was first observed (12.5 μM [3.4 mg/L]) but cytotoxicity occurred at genistein concentrations ≥25 μM [6.8 mg/L]. No inhibition of gap junctional intercellular communication was observed following a 72-hr incubation with genistein concentrations up to 25 μM [6.8 mg/L]. A time-course experiment demonstrated that genistein 25 μM [6.8 mg/L] maximally inhibited gap junctional intercellular communication at 2 hr of exposure, and the effect continued until 24 hr of exposure. The weakening of the effect from 24–72 hr occurred in conjunction with an increase in cytotoxicity. A short-time (3-hr) treatment with genistein 20 μM [5.4 mg/L] also resulted in an inhibition of gap junctional intercellular communication. Incubation with genistein 25 μM [6.8 mg/L] together with 17β-estradiol 20 μM resulted in no additional inhibition of gap junctional intercellular communication than was observed following treatment with either compound alone. Low genistein concentrations of 10−12–10−6 M [270 ng/L–270 μg/L] for 72 hr had no significant effect on gap junctional intercellular communication. The genistein-induced inhibition of gap junctional intercellular communication was partially blocked when either ICI or calphostin C were added to media and completely blocked upon simultaneous addition of both compounds to the media. The study authors concluded that inhibition of gap junctional intercellular communication in mouse Leydig cells by genistein and 17β-estradiol appears to occur through the ER or the protein kinase C pathway, while the inhibitory effects of diethylstilbestrol appear to occur through the ER.
Strengths/Weaknesses
Strengths include the use of a range of concentration and the comparison of different estrogenic compounds. Weaknesses include the limited endpoints, lack of steroid production measured, although steroid production is the main function of Leydig cells, and lack of a test of phosphotyrosine protein levels to verify that genistein did not inhibit tyrosine kinases in these cells.
Utility (Adequacy) for CERHR Evaluation Process
In vitro tests do not reflect the complexity of events occurring in vivo, especially between different testicular cell types, but can provide mechanistic clues. This study is not useful in the present context because of the weaknesses mentioned above. It is not possible to imbue the results of this study with physiological significance.
4.2.3 Mating and fertility studies
East (1955), from the Australian National Institute for Medical Research, conducted a series of studies to examine reproductive endpoints in mice consuming synthetic genistein [purity not specified]. The first study examined vaginal opening and is discussed in Section 3.2.1.3. In the second study, 1-month-old female mice were castrated. At 2 months of age, 10 mice per group were treated with 0, 5, or 10 mg/day genistein through diet for 14 days and vaginal smears were conducted daily. [Based on EPA assumptions (EPA, 1988) for female B6C3F1 mouse body weight in subchronic studies (0.0246 kg), genistein intake was estimated at 200 and 400 mg/kg bw/day in the high- and low-dose group, respectively.] Leukocyte infiltration was comparable in smears from genistein-treated and control mice. However, cornified cells were seen in smears from five mice in the 10 mg/day Group 1 week after treatment. Cornification persisted for 2–5 days. [Although the study authors concluded that doses producing vaginal cell cornification were equivalent in immature and castrated animals on a body weight basis, the CERHR genistein estimate for castrated animals in the 10 mg/day group was twice that for immature animals.]
In the third study, fertility was evaluated in 2-month-old male and female mice. Males included in the study were demonstrated to be fertile and females had regular estrous cycles for 14 days. Ten male and female mice per sex were given genistein 15 mg/day through diet, and 20 male and female mice per sex were fed control diets for 10 days prior to mating. [Based on EPA assumptions for male and female B6C3F1 mouse body weight in subchronic studies (0.0316 and 0.0246 kg, respectively), genistein intake was estimated at 470 and 610 mg/kg bw/day in males and females.] Treated animals were paired one to one with untreated animals, and controls were paired together. Treated females were mated twice and treated males were mated once during the time period for which they continued to receive genistein. Genistein treatment lasted 31–55 days in females and 22–25 days in males. At the end of the treatment period, males and females were returned to stock diet and mated twice more with respective partners. Control animals were mated a total of three times. Litters born during the treatment period were discarded, while litters born after return to stock diet were left undisturbed until weaning. Parameters evaluated included fertility, matings, number of litters born, litter size, and pup mortality. [It does not appear that statistical analyses were conducted.] Sterility was defined as lack of mating, and infertile matings were defined at those resulting in pseudopregnancy, resorptions, or abortions. Treatment of female mice with genistein resulted in cornification of vaginal smears within 3 days, and mice remained in estrus during the remaining 7 days prior to mating. Results for breeding parameters are summarized in Table 70. The most prominent effect observed in treated female mice was an increased number of stillborn pups. The effect resolved after the treatment period ended. Genistein treatment adversely affected fertility in males as noted by increased sterility and infertility. There was some recovery, albeit incomplete, in male fertility after genistein treatment ended.
Table 70.
Breeding Performance in Male and Female Mice Exposed to Genistein
| Treated female × untreated male
|
Treated male × untreated female
|
||||
|---|---|---|---|---|---|
| Parameter | During treatment | After treatment | During treatment | After treatment | Untreated male × untreated female |
| Sterile pairs, n | 2 | 0 | 5 | 2 | 0 |
| Matings, n | 16 | 20 | 5 | 16 | 30 |
| Infertile matings, % | 25 | 35 | 60 | 38 | 17 |
| Litters born, n | 12 | 13 | 2 | 10 | 25 |
| Litters weaned, n | Not applicable | 13 | Not applicable | 10 | 21 |
| Pups born, n | 56 | 77 | 15 | 70 | 192 |
| Pups stillborn, n | 23 | 0 | 0 | 0 | 0 |
| Litter size at birtha | 4.7 | 5.9 | 7.5 | 7.0 | 7.7 |
| Litter size at weaninga | Not applicable | 5.4 | Not applicable | 5.6 | 7.0 |
| Weaning weight, ga | Not applicable | 8.2 | Not applicable | 6.8 | 7.3 |
| Pups weaned, % | Not applicable | 91 | Not applicable | 80 | 77 |
n = 10 pairs per mating condition. Females were mated twice during the treatment period and twice after returning to control diet. Males were mated once during the treatment period and twice after returning to control diet. Controls were mated three times.
Mean.
From East (1955).
Strengths/Weaknesses
The addition of genistein to feed and the lack of additional information on daily intake permit only an estimate of exposure. This study used very high dose levels of genistein that do not reflect human levels of exposure. The study is weakened by the lack of statistical analysis and the lack of examination of reproductive tissues. In spite of its limitations, this study is one of the few to examine effects of adult exposure to genistein on fertility.
Utility (Adequacy) for CERHR Evaluative Process
This study is useful in showing that high genistein exposure levels in the diet of mice can result in decreased fertility in males and increased stillborn pups in females. This information may be useful in considering possible mechanisms of genistein action.
Kyselova et al. (2004), supported by the Czech Republic, reported a multigenerational study in CD-1 mice exposed to genistein or diethylstilbestrol. The animals were dosed via drinking water with genistein dose levels given as 0, 2.5 or 25 “μg per animal’s weight per day.” [The doses should have been indicated as μg/animal. The mice weighed 20–25 g; therefore, these doses are equivalent to 0, 0.1–0.125, or 1–1.25 mg/kg bw/day (D. Buckiová, personal communication, April 27, 2005).] The diethylstilbestrol dose level was “0.5 μg per animal’s weight per day” [20–25 μg/kg bw/day]. The parental (F0) mice were exposed beginning at 2 months of age, F1 mice were exposed throughout their lives, either through their dams or directly, and F2 mice were exposed until termination at 30 days of age. Parental males were killed on PND 90 and females on PND 120. [It is not clear whether the dose was estimated based on water consumption or some other technique was used to ensure complete intake of the daily dose. The age at mating was not given. There are PND 30 data for F1 as well as F2 offspring, so some F1 animals must have been killed at the PND 30 time point. The number of animals used in each generation was not entirely clear but may have been 6/sex, at least for the F0 matings.] Body weight and weights of reproductive organs, kidneys, liver, and spleen were recorded. Cauda epididymal sperm were “extracted” [method not otherwise specified] and counted, and acrosome status was evaluated using immunohistochemical determination of the Hs-14 intra-acrosomal protein. The right testis and ovary were fixed in formaldehyde, paraffin-imbedded, and stained with hematoxylin and eosin for light microscopy. Blood was collected [method not specified] from males on PND 60 for determination of serum testosterone and FSH. Statistical analysis was performed with ANOVA and Student-Newman-Keuls test.
Results for genistein treatments are summarized in Table 71. Some of the results reflect developmental outcomes and are discussed in Section 3.2.1.1. The effects of the diethylstilbestrol treatment were generally more severe than those in the highest genistein treatment group. Testicular histology was normal in all genistein-exposed males except for one F2 animal [dose level and age not specified] with degenerative changes in the tubules. All diethylstilbestrol-exposed animals had abnormal testes by light microscopy. Genistein had no detected effect on ovarian histology, with the exception of corpus luteum hypertrophy in one F1 high-dose adult female. Diethylstilbestrol treatment was associated with absent corpora lutea in 2/3 evaluated adult F1 females. Genistein had no detected effect on serum testosterone or FSH levels in males, and did not alter litter size or sex ratio. Diethylstilbestrol depressed serum testosterone, increased serum FSH, and decreased litter size. None of the F1 matings in the diethylstilbestrol group resulted in production of a litter.
Table 71.
Effect of Genistein in Drinking Water in a Multigenerational Study in Mice
| Genistein treatment level μg/animal/daya[mg/kg bw/day] |
Benchmark doseb μg/animal/day[mg/kg bw/day] |
|||||
|---|---|---|---|---|---|---|
| Endpoint | 2.5 [0.1–0.125] | 25 [1–1.25] | BMD10 | BMDL10 | BMD1 SD | BMDL1 SD |
| Parental (F0) males evaluated on PND 90 | ||||||
| Body weight | ↔ | ↓5% | 70 [2.8–3.5] | Failed | 22 [0.9–1.1] | 12 [4.8–6] |
| Absolute organ weight | ||||||
| Testis | ↔ | ↔ | ||||
| Epididymis | ↔ | ↔ | ||||
| Prostate | ↔ | ↓17% | 18 [7.2–9] | 10 [4–5] | 22 [0.9–1.1] | 12 [4.8–6] |
| Seminal vesicles | ↔ | ↔ | ||||
| Liver | ↔ | ↔ | ||||
| Kidneys | ↔ | ↔ | ||||
| Spleen | ↔ | ↔ | ||||
| Relative organ weight | ||||||
| Testis | ↔ | ↔ | ||||
| Epididymis | ↔ | ↔ | ||||
| Prostate | ↔ | ↔ | ||||
| Seminal vesicles | ↔ | ↔ | ||||
| Liver | ↔ | ↔ | ||||
| Kidneys | ↔ | ↔ | ||||
| Spleen | ↔ | ↔ | ||||
| Sperm parameters | ||||||
| Concentration | ↔ | ↔ | ||||
| Acrosome labeling | ↓14% | ↓15% | 23c [9.2–11.5] | 14 [5.6–7] | 18 [7.2–9] | 10 [4–5] |
| Parental (F0) females evaluated on PND 120 | ||||||
| Body weight | ↔ | ↓9% | 26 [10.4–13] | 17 [6.8–8.5] | 26 [10.4–13] | 15 [6–7.5] |
| Absolute organ weight | ||||||
| Ovaries | ↔ | ↔ | ||||
| Liver | ↓22% | ↓25% | 19 [7.6–9.5] | 10 [4–5] | 14 [5.6–7] | 8 [3.2–4] |
| Kidney | ↔ | ↔ | ||||
| Spleen | ↔ | ↔ | ||||
| Relative organ weight | ||||||
| Ovaries | ↔ | ↔ | ||||
| Liver | ↓18% | ↓17% | 21 [8.4–10.5] | 9 [3.6–4.5] | 25 [10–12.5] | 10 [4–5] |
| Kidney | ↔ | ↔ | ||||
| Spleen | ↔ | ↔ | ||||
| F1 males evaluated on PND 30 | ||||||
| Body weight | ↔ | ↔ | ||||
| Absolute organ weight | ||||||
| Testis | ↓12% | ↓29% | 9 [3.6–4.5] | 6 [2.4–3] | 10 [4–5] | 5 [2–2.5] |
| Prostate | ↔ | ↓18% | 9 [3.6–4.5] | 7 [2.8–3.5] | 10 [4–5] | 7 [2.8–3.5] |
| Seminal vesicles | ↓18% | ↓31% | 9 [3.6–4.5] | 6 [2.4–3] | 14 [5.6–7] | 9 [3.6–4.5] |
| Liver | ↔ | ↔ | ||||
| Kidneys | ↔ | ↔ | ||||
| Spleen | ↓20% | ↓21% | 26 [10.4–13] | 13 [5.2–6.5] | 18 [7.2–9] | 10 [4–5] |
| Relative organ weight | ||||||
| Testis | ↔ | ↓19% | 14 [5.6–7] | 10 [4–5] | 12 [4.8–6] | 8 [3.2–4] |
| Prostate | ↔ | ↓17% | 24 [9.6–12] | 10 [4–5] | 24 [9.6–12] | 9 [3.6–4.5] |
| Seminal vesicles | ↔ | ↓21% | 23 [9.2–11.5] | 10 [4–5] | 25 [10–12.5] | 13 [5.2–6.5] |
| Liver | ↔ | ↔ | ||||
| Kidneys | ↑16% | ↔ | ||||
| Spleen | ↓15% | ↔ | ||||
| F1 females evaluated on PND 30 | ||||||
| Body weight | ↔ | ↔ | ||||
| Absolute organ weight | ||||||
| Ovaries | ↓11% | ↔ | ||||
| Liver | ↔ | ↔ | ||||
| Kidney | ↔ | ↔ | ||||
| Spleen | ↔ | ↔ | ||||
| Relative organ weight | ||||||
| Ovaries | ↔ | ↔ | ||||
| Liver | ↔ | ↔ | ||||
| Kidney | ↑10% | ↑6% | ||||
| Spleen | ↓9% | ↔ | ||||
| F1 males evaluated on PND 90 | ||||||
| Body weight | ↔ | ↔ | ||||
| Absolute organ weight | ||||||
| Testis | ↔ | ↔ | ||||
| Epididymis | ↔ | ↔ | ||||
| Prostate | ↔ | ↔ | ||||
| Seminal vesicles | ↔ | ↔ | ||||
| Liver | ↔ | ↔ | ||||
| Kidneys | ↔ | ↔ | ||||
| Spleen | ↔ | ↔ | ||||
| Relative organ weight | ||||||
| Testis | ↔ | ↔ | ||||
| Epididymis | ↔ | ↔ | ||||
| Prostate | ↔ | ↔ | ||||
| Seminal vesicles | ↔ | ↔ | ||||
| Liver | ↔ | ↔ | ||||
| Kidneys | ↔ | ↔ | ||||
| Spleen | ↔ | ↔ | ||||
| Epididymal sperm parameters | ||||||
| Concentration | ↔ | ↔ | ||||
| Acrosome labeling | ↓12% | ↓11% | 38c [15.2–19] | 20 [8–10] | 27 [10.8–13.5] | 14 [5.6–7] |
| F1 females evaluated on PND 120 | ||||||
| Body weight | ↔ | ↔ | ||||
| Absolute organ weight | ||||||
| Ovaries | ↔ | ↔ | ||||
| Liver | ↔ | ↔ | ||||
| Kidney | ↔ | ↔ | ||||
| Spleen | ↓26% | ↓25% | 15 [6–7.5] | 9 [3.6–4.5] | 23 [9.2–11.5] | 12 [4.8–6] |
| Relative organ weight | ||||||
| Ovaries | ↔ | ↔ | ||||
| Liver | ↔ | ↔ | ||||
| Kidney | ↔ | ↔ | ||||
| Spleen | ↓18% | ↓12% | 15 [6–7.5] | 9 [3.6–4.5] | 20 [8–10] | 11 [4.4–5.5] |
| F2 males evaluated on PND 30 | ||||||
| Body weight | ↔ | ↓34% | 8 [3.2–4] | 6 [2.4–3] | 9 [3.6–4.5] | 7 [2.8–3.5] |
| Absolute organ weight | ||||||
| Testis | ↔ | ↓45% | 6 [2.4–3] | 5 [2–2.5] | 6 [2.4–3] | 4 [1.6–2] |
| Prostate | ↓21% | ↓67% | 4 [1.6–2] | 3 [1.2–1.5] | 9 [3.6–4.5] | 6 [2.4–3] |
| Seminal vesicles | ↓22% | ↓78% | 3 [1.2–1.5] | 3 [1.2–1.5] | 7 [2.8–3.5] | 5 [2–2.5] |
| Liver | ↓13% | ↓32% | 8 [3.2–4] | 6 [2.4–3] | 13 [5.2–6.5] | 9 [3.6–4.5] |
| Kidneys | ↔ | ↓31% | 9 [3.6–4.5] | 6 [2.4–3] | 12 [4.8–6] | 8 [3.2–4] |
| Spleen | ↔ | ↓20% | 24 [9.6–12] | Failed | 27 [10.8–13.5] | Failed |
| Relative organ weight | ||||||
| Testis | ↔ | ↓22% | 24 [9.6–12] | 6 [2.4–3] | 25 [10–12.5] | 10 [4–5] |
| Prostate | ↓18% | ↓54% | 5 [2–2.5] | 4 [1.6–2] | 8 [3.2–4] | 6 [2.4–3] |
| Seminal vesicles | ↓10% | ↓67% | 4 [1.6–2] | 3 [1.2–1.5] | 6 [2.4–3] | 5 [2–2.5] |
| Liver | ↔ | ↔ | ||||
| Kidneys | ↔ | ↔ | ||||
| Spleen | ↔ | ↑21% | 25 [10–12.5] | 10 [4–5] | 25 [10–12.5] | 25 [10–12.5] |
| F2 females evaluated on PND 30 | ||||||
| Body weight | ↓13% | ↓19% | 16 [6.4–8] | 12 [4.8–6] | 11 [4.4–5.5] | 8 [3.2–4] |
| Absolute organ weight | ||||||
| Ovaries | ↑2% | ↓35% | 21 [8.4–10.5] | 5 [2–2.5] | 21 [8.4–10.5] | 5 [2–2.5] |
| Liver | ↓17% | ↓17% | ~1d [0.4–0.5] | Failed | ~1d [0.4–0.5] | Failed |
| Kidney | ↓16% | ↓12% | 40 [16–20] | 16 [6.4–8] | 42 [16.8–21] | 17 [6.8–8.5] |
| Spleen | ↔ | ↔ | ||||
| Relative organ weight | ||||||
| Ovaries | ↔ | ↔ | ||||
| Liver | ↔ | ↔ | ||||
| Kidney | ↔ | ↔ | ||||
| Spleen | ↔ | ↔ | ||||
↑, ↓, ↔ Increase, decrease, no change by the study authors’ statistical comparison with the control group.
Expressed in the paper as μg per “animal’s body weight,” but actually μg/20–25-g animal. Calculations assume n = 6/group and that the uncertainties in the study report are SEM (indicated in the figures but not the tables in the study report).
See the footnote to Table 33 for an explanation of the use of benchmark dose in this report.
SEM estimated from a graph for benchmark dose calculations.
Models failed; benchmark doses estimated by inspection.
From Kyselova et al. (2004).
The authors concluded that female mice were more sensitive than males to the reproductive effects of genistein. They also concluded that the alterations in acrosome protein staining associated with genistein treatment reflected some degree of sperm damage, although not a sufficient degree of damage to influence fertilization.
Strengths/Weaknesses
The estimated dose levels used were close to estimated levels of human dietary exposures, and the endpoints examined were relatively broad and directly relevant to an assessment of reproductive effects. The multigenerational design revealed an interesting “sensitization” effect in 30-day-old F2 animals, in which exposure to the high genistein dose level caused organ weight decreases greater than those seen in F1 animals of the same age. The use of diethylstilbestrol as a positive control was a strength; however, the diethylstilbestrol dose was too high and may have caused effects on reproductive tissues secondary to alterations in other organs. The study would have been strengthened by histopathologic examination and by evaluation of reproduction in the F2 animals. The most important problem is the lack of adequate information on genistein intake; it is not clear how the authors determined the amount of genistein consumed. The administration of genistein in drinking water would not be expected to permit determination of exact exposures, particularly if the mice were group housed.
Utility (Adequacy) for CERHR Evaluation Process
This study would be useful in showing the lack of impairment of fertility in the F0 and F1 mice and the transient nature of some of the observed effects. The observation of sperm abnormalities in F1 mice and the organ weight effects in F2 mice would also have been important for the evaluation process. Given the uncertainty about dosing, however, the Expert Panel has no confidence that the estimated dose levels are correct and cannot use this study in the evaluation process.
NCTR (2005) conducted a multigenerational reproductive toxicity study in rats. A preliminary study was first conducted to determine doses for the main study and that study is described in this report under Delclos et al. (2001). Based on the results of the preliminary study, a high dose of 500 ppm was selected for the multigenerational toxicity study because it was not expected to produce overt reproductive toxicity. The low dose was set at 5 ppm because no effects were expected to occur at that level.
The main reproductive toxicity study was conducted according to GLP. Six-week-old Sprague-Dawley rats were assigned to dose groups (n = 35/sex/group) using a stratified randomized procedure that resulted in similar body weights among groups. The rats were fed 5K96, a soy- and alfalfa-free diet to which genistein (≥99% purity) was added at 0, 5, 100, or 500 ppm. Dosing of F0 animals began at 6 weeks of age and was continued through 140 days, including gestation and lactation periods. Mean genistein levels in control diet were measure at 0.417 ppm. At 70–84 days of age, F0 rats were mated until a vaginal plug was detected or for up to 2 weeks. Day of plug detection was designated as GD 0. Twenty-five dams, sires, and litters/group were selected to continue in the study. Females were allowed to litter, and the day of birth was designated PND 1. On PND 2, litters were culled to 4 pups/sex/litter. Animals within the same dose group were fostered if needed to maintain litter size, but fostered animals were not mated or included in analyses. No more than 2 pups/sex/litter were randomly selected for breeding in the next generation. Parameters evaluated in adult rats included body weights, feed consumption, clinical observations, time for mating to occur, percentage of mated females delivering litters, and vaginal smears for 10 days prior to necropsy. On PND 1, pups were sexed, weighed, and evaluated for viability. Anogenital distance was measured on PND 2 in 10 litters/group. Body weight gain was measured during the postnatal period. All male pups were examined for retained nipples on PND 14. Onset of puberty was monitored. Vaginal cytology was assessed in one female offspring/litter for 14 days following vaginal opening and was also evaluated for 10 days prior to necropsy.
The same procedures were conducted in F1, F2, F3, and F4 rats, but there were differences in times of exposures. In F1 and F2 rats, dosing began upon weaning at 3 weeks of age versus 6 weeks of age in F0 rats. F3 rats, which were exposed to genistein indirectly during gestation and lactation, were not exposed to genistein in diet following weaning. F4 rats were not exposed to genistein at any time during their lives. The F0–F4 generations were killed at 140 days of age. Necropsy observations included examination of uteri for resorption sites in females who had vaginal plugs but did not litter, organ weights, and histopathology. In all dose groups, histopathologic examinations were conducted in tissues with gross lesions, reproductive organs (preserved in Bouin fluid), mammary glands, and kidneys of female rats and males rats of the F1 and F2 generations. Histopathologic examinations of other tissues were conducted in animals from the control and high-dose groups. Sperm counts, motility, and morphology were determined. Ovarian follicles were counted in 8 females/group/generation. Pups from the F5 generation, which received no direct or indirect genistein exposure, were monitored during the lactation period and killed at weaning. F5 pups were not subjected to necropsy or histopathologic evaluations. Statistical analyses included ANOVA, ANCOVA, Dunnett tests, Holm adjusted independent t-tests, Wilcoxon tests, Kruskal-Wallis tests, Jonckheere-Terpstra nonparametric test, Kaplan-Meier procedure, and Shirley test.
Mean genistein doses in treated F0, F1, and F2 male rats (as estimated by study authors and rounded by CERHR) were ~0.3, 7, and 35 mg/kg bw/day. Mean doses in F0–F2 females were estimated at ~0.4, 9, and 44 mg/kg bw/day during periods when they were not lactating and ~0.7, 15, and 78 mg/kg bw/day during lactation periods.
Treatment-related results in adult animals are listed in Table 72. For body weight effects, only the most relevant effects (e.g., body weights including the time of pregnancy and terminal body weights) are summarized in Table 72. Body weights prior to and during gestation (≤13 weeks of age) were lower than controls in F1 females exposed to ≥100 ppm and F0 and F2 females exposed to 500 ppm. Total body weight gain prior to delivery and terminal body weights of females were reduced in F0, F1, and F2 animals of the 500 ppm group. Body weights of untreated F4 females were slightly lower (<10%) but significantly different from controls during some periods before (8–11 weeks of age) and following (16–19 weeks of age) delivery of litters. The only consistent body weight effect in males was lower body weights compared to controls in F1 males from the 100 and 500 ppm groups during most time points in the post-weaning period. Total body weight gain throughout the study was decreased in F1 males exposed to ≥100 ppm and F3 males of the 500 ppm group; terminal body weight was significantly lower in F1 males of the 500 ppm group. Consistent reductions in feed consumption were observed in F0, F1, and F4 females of the 500 ppm group. No consistent effects on water intake were observed. In cases where organ weight effects were observed, the magnitude of effect was relatively small and there were no consistent effects across generations; therefore the biologic significance was questioned by study authors. A small increase (8–9%) in testes weights in F0 males of the 500 ppm group was the only effect on male reproductive organs; the study authors noted that the magnitude of effect was within variations observed in each dose group. Genistein had no detected effect on weights of female reproductive organs. Changes in weights of pituitary, thymus, and spleen in males and females were stated by study authors to be the only organ weight effects that differed by >10% from control values and were not related to body weight changes. A 17–18% increase in absolute and relative pituitary weight in the F2 males of the 500 ppm group was the only organ weight effect that appeared to be dose-related. The only treatment-related histopathologic findings included mammary hyperplasia and kidney effects in males. Incidence and severity of alveolar/ductal hyperplasia were increased in F0 males of the 500 ppm group and F1 and F2 males of the 100 and 500 ppm groups; increased trends were observed in F3 males of the 100 and 500 ppm groups. Kidney effects with increased incidence and severity (generation and doses at which effects occurred) included renal tubule mineralization (≥100 ppm in F1 and F2), renal cysts (500 ppm in F1 and F2), inflammation (500 ppm in F1), and regeneration of tubules (500 ppm in F1). All kidney lesions were rated minimal to mild.
Table 72.
Treatment-Related Results Observed in a Genistein Multigenerational Study in Sprague-Dawley Rats
| Dose in feed (ppm)
|
Benchmark dose (ppm)
|
||||||
|---|---|---|---|---|---|---|---|
| Parameter | 5 | 100 | 500 | BMD10 | BMDL10 | BMD1 SD | BMDL1 SD |
| Body weight of females at 13 weeks of age (prior to delivery) | |||||||
| F0 | ↔ | ↔ | ↓10.8% | 412 | 333 | 306 | 240 |
| F1 | ↔ | ↓6.7% | ↓20.5% | 265 | 220 | 275 | 220 |
| F2 | ↔ | ↔ | ↓9.8% | 501 | 431 | 487 | 327 |
| Terminal body weights of females | |||||||
| F0 | ↔ | ↔ | ↓8.6% | 515 | 416 | 309 | 241 |
| F1 | ↔ | ↔ | ↓13.8% | 374 | 309 | 272 | 218 |
| F2 | ↔ | ↔ | ↓5.8% | 700 | 508 | 516 | 368 |
| Terminal body weights of F1 males | ↔ | ↔ | ↓5.6% | 994 | 652 | 667 | 432 |
| Total pre-delivery body weight gain in females (from 6 weeks of age) | |||||||
| F0 | ↔ | ↔ | ↓16.2% | 281 | 224 | 336 | 259 |
| F1 | ↔ | ↔ | ↓28.2% | 193 | 154 | 341 | 262 |
| F2 | ↔ | ↔ | ↓16.3% | 362 | 250 | 368 | 248 |
| Total body weight gain of males throughout study (from 6 weeks of age) | |||||||
| F3 | ↔ | ↔ | ↓7.5% | 713 | 467 | 675 | 434 |
| Total body weight gain of males throughout study (from 3 weeks of age) | |||||||
| F1 | ↔ | ↓5.3% | ↓5.8% | 1160 | 523 | 770 | 474 |
| F3 | ↔ | ↔ | ↓4.7% | 1046 | 514 | 763 | 502 |
| Total feed consumption of females before delivery of litters (from 6 weeks of age) | |||||||
| F0 | ↔ | ↔ | ↓8.8% | 586 | 445 | 406 | 302 |
| F1 | ↔ | ↔ | ↓9.8% | 572 | 392 | 592 | 399 |
| F4a | ↔ | ↔ | ↓6.9% | 852 | 539 | 741 | 461 |
| No. male rats/no. treated with mammary alveolar or ductal hyperplasia | |||||||
| F0 | 3/24 | 2/23 | 5/24 ↑ | ||||
| F1 | 1/24 | 5/25 ↑ | 15/25 ↑ | ||||
| F2 | 0/25 | 8/25 ↑ | 18/25 ↑ | ||||
| F3 | 2/25 | 6/25 ↑T | 8/23 ↑T | ||||
| No. male rats/no. treated with renal tubule mineralization | |||||||
| F1 | 3/25 | 8/25 ↑ | 15/25 ↑ | ||||
| F2 | 1/25 | 4/25 ↑ | 6/25 ↑ | ||||
| No. male rats/no. treated with renal cysts | |||||||
| F1 | 3/25 | 0/25 | 3/25 ↑ | ||||
| F2 | 2/25 | 1/25 | 3/25 ↑ | ||||
| No. F1 male rats/no. treated with kidney inflammation | 15/26 | 19/25 | 22/25 ↑ | ||||
| No. F1 male rats/no. treated with regeneration of renal tubules | 6/25 | 8/25 | 19/25 ↑ | ||||
| Live pups born | |||||||
| Total F1 | ↔ | ↔ | T↓12.6% | 382 | 199 | 610 | 483 |
| Total F2 | ↔ | ↔ | ↓30.4% | 154 | 121 | 376 | 285 |
| Total F3 | ↔ | ↔ | T↓12.4% | 486 | 317 | 513 | 475 |
| Female F2 | ↔ | ↔ | ↓32.8% | 134 | 101 | 463 | 335 |
| Male F2 | ↔ | ↔ | ↓28.1% | 457 | 130 | 510 | 430 |
| Body weights of male pups at birth | |||||||
| F1 | ↔ | ↓6.3% | ↔ | 612 | 515 | 623 | 520 |
| F5a | ↓6.2% | ↓9.2% | ↓6.2% | 2171 | 920 | 1868 | 526 |
| Body weights of F5 female pups at birth | ↓8.2% | ↓8.2% | ↓6.6% | 2624 | 526 | 2408 | 524 |
| Body weights of female pups during the lactation period | |||||||
| F1 on PND 14 | ↔ | ↔ | ↓11.8% | 425 | 306 | 505 | 355 |
| F1 on PND 21 | ↔ | ↔ | ↓14.3% | 342 | 262 | 396 | 295 |
| F2 on PND 14 | ↔ | ↓8.6% | ↔ | 517 | 444 | 541 | 504 |
| F2 on PND 21 | ↔ | ↔ | ↓6.0% | 508 | 410 | 521 | 492 |
| F3 on PND 21 | ↔ | ↔ | ↓9.0% | 479 | 334 | 514 | 358 |
| F4 on PND 21a | ↔ | ↔ | ↓7.1% | 567 | 372 | 676 | 435 |
| Body weights of male pups during the lactation period | |||||||
| F1 on PND 14 | ↔ | ↓12% | ↓14.6% | 425 | 313 | 464 | 334 |
| F1 on PND 21 | ↓4.9% | ↓11.0% | ↓12.8% | 496 | 353 | 495 | 345 |
| F2 on PND 14 | ↔ | ↔ | ↓7.7% | 547 | 379 | 578 | 397 |
| F2 on PND 21 | ↔ | ↔ | ↓11.4% | 436 | 335 | 393 | 294 |
| F3 on PND 21 | ↔ | ↓6.4% | ↓10.5% | 549 | 373 | 587 | 391 |
| F4 on PND 21a | ↑8.0% | ↔ | ↓6.5% | 514 | 344 | 639 | 419 |
| Body weight gain of female pups during lactation period | |||||||
| F1 | ↔ | ↔ | ↓15.5% | 300 | 231 | 385 | 288 |
| F3 | ↔ | ↔ | ↓11.7% | 422 | 279 | 472 | 329 |
| F4a | ↔ | ↔ | ↓8.4% | 508 | 332 | 670 | 432 |
| Body weight gain of male pups during lactation period | |||||||
| F1 | ↔ | ↓10.9 | ↓14.8% | 389 | 289 | 431 | 312 |
| F2 | ↔ | ↔ | ↓14.9% | 336 | 266 | 338 | 260 |
| F3 | ↔ | ↔ | ↓14.1% | 400 | 290 | 479 | 338 |
| F4a | ↔ | ↔ | ↓7.0% | 452 | 301 | 637 | 416 |
| Anogenital distance of F1 male pups | ↔ | ↔ | ↓5.6% | 1174 | 578 | 819 | 398 |
| Anogenital distance of female pups | |||||||
| F1 | ↔ | ↔ | ↓6.9% | 1039 | 511 | 596 | 335 |
| F2 | ↔ | ↔ | ↓4.2% | 1767 | 520 | 678 | 360 |
| F3 | ↔ | ↓5.9% | ↔ | 1294 | 703 | 667 | 357 |
| F1 Female anogenital distance ratio | ↔ | ↔ | ↓5.6% | 1227 | 507 | 793 | 392 |
| Age at vaginal opening | |||||||
| F1 | ↔ | ↔ | ↓2.9 days | 510 | 421 | 522 | 500 |
| F2 | ↔ | ↔ | ↓2.8 days | 669 | 480 | 636 | 450 |
| F3 | ↓1.3 days | ↔ | ↔ | 628 | 531 | 599 | 519 |
| Body weight at vaginal opening | |||||||
| F1 | ↓10.5% | ↔ | ↓27.3% | 280 | 162 | 500 | 367 |
| F2 | ↔ | ↔ | ↓18.9% | 470 | 279 | 504 | 457 |
| F3 | ↔ | ↔ | ↓15.4% | 462 | 288 | 921 | 562 |
| Age at testicular descent, F3 | ↔ | ↔ | ↑1.9 days | 529 | 500 | 529 | 500 |
| No. cycles with abnormal diestrous stage (following vaginal opening), F1 | ↔ | ↔ | ↑1 cycle | 888 | 416 | ||
| No. cycles with abnormal estrous stage (following vaginal opening), F1 | ↔ | ↔ | ↑0.4 cycles | 821 | 501 | ||
| No. cycles with abnormal diestrous or estrous stage(following vaginal opening), F1 | ↔ | ↔ | ↑1.4 cycles | 681 | 375 | ||
| Length of estrous cycle following vaginal opening | |||||||
| F1 | ↔ | ↔ | ↑3.2 days | 91 | 63 | 393 | 293 |
| F2 | ↔ | ↔ | ↑0.83 days | 321 | 256 | 275 | 217 |
| No. cycles with abnormal diestrous or estrous stage(before sacrifice), F3 | ↔ | ↔ | ↑0.42 cycles | 1061 | 488 | ||
↔ No statistically significant effect;↑, ↓Statistically significant increase, decrease; T Trend.
Animals received no direct or indirect exposure.
From NCTR (2005).
Genistein treatment did not show a detectable effect on mating, fertility, or pregnancy indices in any generation. No genistein effect on duration of gestation was detected. There were no detected treatment-related effects on resorptions sites in animals that did not become pregnant. Ovarian follicle counts were not observed to be affected by genistein treatment. In male rats, genistein had no detected effect on sperm parameters. Treatment-related effects observed in developing pups are outlined in Table 72. Trends were observed for decreased numbers of live pups born in the F1, F2, and F3 generations at 500 ppm, but statistical significance was achieved only for the F2 generation. Significant and dose-related decreases in pup weight at birth were only observed in the F5 generation, which received no genistein exposure. Genistein treatment affected body weights of pups during the lactation period. At the mid-dose level, body weights were lower than controls in F2 females on PND 14 only. Lower body weights during the lactation period were also observed in F1, F2, F3, and F4 females of the 500 ppm group. [The text of the results section stated that body weights of mid dose F1 females were 12% lower on PND 14, but that statement could not be verified in the tables or figures of the report.] Body weight gain was reduced in F1, F3, and F4 female pups of the 500 ppm group during the lactation period. Body weights of male pups during the lactation period were lower than controls for F1 males from all dose groups, F3 males from the 100 and 500 ppm groups, and F2 and F4 pups from the 500 ppm groups. Body weight gain of male pups during the lactation period was decreased in F1 animals from the 100 and 500 ppm groups and in F2, F3, and F4 animals from the 500 ppm group. A significant decrease in anogenital distance was only observed in F1 males of the 500 ppm group; the study authors stated that the decrease was within variances observed within treatment groups, including the control group. Reduced anogenital distances were also observed in mid-dose F3 females and F1 and F2 females of the 500 ppm group. Again, study authors noted that the magnitude of effect was within variations noted in all dose groups. There were no detected significant or treatment-related effects observed for stillbirths, sex ratios, or postnatal survival.
Age of vaginal opening was accelerated in F1 and F2 females and body weight at vaginal opening was reduced in F1, F2, and F3 females of the 500 ppm group. A delay in testicular descent was only observed in F3 males of the 500 ppm group. Genistein treatment had no effect on preputial separation. In the 2 weeks following vaginal opening, the number of abnormal estrous cycles, characterized by extended estrus or diestrus, was increased in F1 rats of the 500 ppm group. Cycle lengths were increased in F1 and F2 females of the 500 ppm group. The increased number of cycles with abnormal diestrous or estrous stages in F3 rats of the 500 ppm group was the only significant and dose-related effect reported in rats examined during the 10 days prior to necropsy. Examination of ovaries, vaginas, and uteri at necropsy did not show an effect of genistein on estrous cycle synchrony.
The study authors concluded that there were no overt signs of toxicity, but the following effects in this study were related to genistein exposure:
reduced body weight gains, accelerated vaginal opening, slightly decreased anogenital distance, and altered estrous cyclicity in females continuously ingesting genistein at 500 ppm (~44 mg/kg/day);
some evidence of reduced litter size at 500 ppm in generations continuously exposed to genistein; and
hyperplasia of the male mammary glands and calcification of renal tubules at 100 and 500 ppm (~7 and 35 mg/kg bw/day); there were weaker effects on male mammary hyperplasia at 500 ppm in males exposed only as adults or exposed only in utero and through lactation.
Strengths/Weaknesses
The experimental protocol for a multigenerational reproductive study conducted under the auspices of the NCTR was thorough and undertaken using GLP guidelines. Because of the expense, logistics, and record-keeping requirements, few laboratories can efficiently complete these types of studies.
Utility (Adequacy) for CERHR Evaluation Process
This study is useful in the evaluation process. The multigenerational study in the rat, like that in the mouse, demonstrated no overt signs of toxicity. The highest dose of genistein, 500 ppm (about 35 mg/kg bw/day), caused some changes in selected reproductive system endpoints including accelerated vaginal openings, slight decreases in anogenital distance, and altered estrous cycles. Some hyperplasia of the male mammary gland and calcification of renal tubules was observed at the 500 ppm daily dose. These selected changes may represent major adverse effects caused by genistein and need further investigation.
The Expert Panel notes a study by Ferguson et al. (2002) in which male and female rats were exposed to dietary genistein as part of a multigenerational study from embryonic life through 100–200 days of age, at which time they were evaluated for amphetamine-stimulated striatal dopamine release. The Panel does not consider this study relevant because the length of the treatment period did not permit assessment of possible developmental effects and because the endpoint, striatal dopamine release, although sexually dimorphic, was not shown to have reproductive consequences.
4.3 Utility of Data
4.3.1 Human data
There are two reports from the same lab (Bajpai et al., 2003; Bajpai and Doncel, 2003) in which genistein was used in vitro as an inhibitor of tyrosine phosphorylation to assist in evaluating the role of tyrosine kinase in human sperm capacitation and motility. These studies did not evaluate fertility effects of genistein.
4.3.2 Experimental animal data
Several experimental animal studies included endpoints that could not be directly related to reproductive function. For example, Milligan et al. (1998) evaluated the effects of genistein treatment on uterine vascular permeability, Hughes (1987) and Hughes et al. (1991a,b) evaluated the effects of genistein on LH response to GnRH administration, and Cotroneo and Lamartiniere (2001) showed an increase in uterine progesterone-receptor expression in response to genistein. There were 3 rodent studies that contained information useful in assessing possible reproductive toxicity (East, 1955; Okazaki et al., 2002; NCTR, 2005). The most comprehensive and useful of these studies was a rat multigenerational study performed by NCTR (2005).
The Expert Panel noted the relevance of the oral route of dosing for human exposure; however, administration in the diet does not permit precise determination of dose, and gavage may be difficult for neonatal animals, particularly mice. Although s.c. administration of genistein results in a larger fraction of unconjugated (active) genistein than oral administration, pharmacokinetic data may be adequate to permit interpretation of data from s.c. studies.
4.4 Summary of Reproductive Toxicity Data
4.4.1. Human data
No clinical trials or in vivo studies were identified. In vitro studies (Bajpai and Doncel, 2003; Bajpai et al., 2003) showed that genistein at 400 μM [108 mg/L] results in a decrease in human sperm motility parameters without altering viability. This effect was attributed to the effects of genistein on tyrosine kinase. No evaluation of fertility was included in these reports. The solubility of genistein may prevent such concentrations from being achieved in solution.
4.4.2 Experimental animal data
The observation that genistein is very weak as an estrogen was supported by Milligan et al. (1998), who demonstrated potency in increasing mouse uterine vascular permeability to be three to four orders of magnitude lower than that of 17β-estradiol (see also Section 2.2.5). Hughes (1987) and Hughes et al. (1991a,b) reported that i.v. (but not oral) genistein is as effective or more effective than 17β-estradiol or estradiol benzoate in blunting the LH response to GnRH in rats; however, these results are difficult to interpret in light of the dual action of estrogens in stimulating LH release at high doses and inhibiting LH secretion at low doses. This effect of genistein may not be estrogenic, and the relevance of this effect to reproductive function is unknown.
The studies that used endpoints bearing most clearly on reproductive function are summarized in Table 73.
Table 73.
Experimental Animal Studies With Reproductive Endpoints
| Lowest effect levels mg/kg bw/day (endpoint)
|
||||||||||
|---|---|---|---|---|---|---|---|---|---|---|
| Sex and species | Genistein doses | Most sensitive endpoints | NOAEL | LOAEL | BMD10 | BMDL10 | BMD1 SD | BMDL1 SD | Reference | |
| Female rat | 0, 120, 4000, 1000 mg/kg bw/day by gavage for 28 days | Altered estrous cyclicity, reproductive organ weight
Histologic change in vagina |
1000
120 |
–
400 |
Okazaki et al., 2002 | |||||
| Female mouse | 15 mg/day [610 mg/kg bw/day] in feed for 10 days prior to mating | ↑Stillborn pups | – | 610 (only dose level) | East, 1955 | |||||
| Male rat | 0, 120, 400, 1000 mg/kg bw/day by gavage for 28 days | Altered reproductive organ histopathology, sperm morphology, sperm head number | 1000 | – | Okazaki et al., 2002 | |||||
| Male mouse | 15 mg/day [470 mg/kg bw/day] in feed for 10 days prior to mating | ↓ fertile matings | – | 470 (only dose level) | East, 1955 | |||||
| Mating rats | 0, 5, 100, 500 ppm (males: 0, 0.3, 7, 35 mg/kg bw/day; females: 0, 0.4, 9, 44 mg/kg bw/day) in diet, multigenerational design | ↓ Live pupsb | Male | 7 | 35 | 9 | 7 | 32 | 23 | NCTR, 2005 |
| Female | 9 | 44 | 12 | 9 | 59 | 29 | ||||
| ↓ Pup weight, F5b | Male | – | 0.3 | 184 | 37 | 169 | 37 | |||
| Female | – | 0.4 | 231 | 46 | 212 | 46 | ||||
| ↓Body weight at vaginal openingb | Male | 7 | 35 | 20 | 11 | 35 | 26 | |||
| Female | 9 | 44 | 25 | 14 | 44 | 32 | ||||
↓ Significant decrease.
For explanation of benchmark dose, see footnote to Table 33.
Although these endpoints are typically developmental, the multigenerational design does not permit a distinction between effects due to exposure during development and effects due to exposure of reproducing adults. The F5 animals had no genistein exposure.
Okazaki et al. (2002) treated male and female rats by gavage for 28 days with genistein 0, 120, 400, or 1000 mg/kg bw/day (n = 10/dose group). They ignored genistein intake from chow, which was estimated to be <10 mg/kg bw/day. Females were evaluated for serum hormone levels, estrous cyclicity, and reproductive organ weight, none of which were shown to be altered by treatment. There were mild histologic changes in the vaginas of 2/10 animals in the middle- and high-dose groups, which the authors considered treatment-related. Males in this study were evaluated for serum hormones, reproductive organ weight and histopathology, sperm morphology, and epididymal sperm head number. No treatment-related alterations were detected.
East (1955) treated male and female mice with genistein 15 mg/day in feed. [Male doses were estimated to be 470 mg/kg bw/day, and female doses were estimated to be 610 mg/kg bw/day.] Animals were mated with untreated mice while they were receiving genistein and twice after genistein was discontinued. Although the study was limited by a lack of statistical analysis, it appeared that treated males had a decrease in fertility, including a decrease in pups born, and females had an increase in stillborn pups. The female effect appeared to resolve during the post-treatment matings.
Two multigenerational studies were identified; however, one of these studies (Kyselova et al., 2004) did not specify dose levels adequately for evaluation. The other study was performed by NCTR (2005). In this study, Sprague-Dawley rats were fed a soy- and alfalfa-free diet to which genistein was added at 0, 5, 100, or 500 ppm (average intake for males: 0, 0.3, 7, 35 mg/kg bw/day; average intake for females: 0, 0.4, 9, 44 mg/kg bw/day). Treatment was started in the F0 animals at 6 weeks of age and was continued through weaning of F3 pups. The F3 pups were weaned to untreated feed. An F4 generation was not exposed directly to genistein (they would have been exposed as gametes during the fetal and neonatal lives of their parents). An F5 generation was monitored through lactation and killed at weaning. Adults in the F0–F4 generations were killed at 140 days of age. Evaluations included body weight and weights of reproductive organs, histopathology of reproductive organs, sperm parameters, and ovarian follicle counts. Adverse effects on body weight at some intervals were noted at the 100 ppm and 500 ppm genistein exposure levels. No adverse effects were seen on mating, fertility, or pregnancy indices, and there were no adverse effects on sperm parameters. Vaginal opening occurred at a younger age and lighter weight in 500 ppm group animals. A decrease in pup weight was noted in all dose groups of the F5 generation, but this generation had no genistein exposure. Treatment effects identified by the study authors included:
reduced body weight gains, accelerated vaginal opening, slightly decreased anogenital distance, and altered estrous cyclicity in females continuously ingesting genistein at 500 ppm (~44 mg/kg/day);
some evidence of reduced litter size at 500 ppm in generations continuously exposed to genistein; and
hyperplasia of the male mammary glands and calcification of renal tubules at 100 and 500 ppm (~7 and 35 mg/kg bw/day); there were weaker effects on male mammary hyperplasia at 500 ppm in males exposed only as adults or exposed only in utero and through lactation.
Conclusions of the Expert Panel
There are no human data.
Evidence is sufficient to conclude that genistein produces reproductive/developmental toxicity in the offspring (i.e., F1, F2, F3) of rats at 500 ppm (approximately 35 mg/kg bw/day in males and 44 mg/kg bw/day in females) via oral administration as manifested by decreased anogenital distance and body weight in male and female pups, abnormal estrous cyclicity and decreased age and body weight at vaginal opening in female pups, and increased age at testicular descent in male pups. These effects do not manifest themselves in the F0 generation. The multi-generational design does not permit determination of whether the adverse effects were due to exposures during reproductive or developmental ages.
The experimental animal data are assumed relevant to the assessment of human risk.
Note: The definitions of the term sufficient and the terms assumed relevant, relevant, and not relevant are in the CERHR guidelines at http://cerhr.niehs.nih.gov/news/guidelines.htm.
5.0 SUMMARIES, CONCLUSIONS, AND CRITICAL DATA NEEDS
5.1 Summary and Conclusions of Reproductive and Developmental Hazards
This evaluation refers to purified genistein and not to the genistein glucosides occurring in any natural food matrix.
5.1.1 Genistein developmental toxicity data
There are no data in humans on the effects of prenatal and childhood exposures to genistein. Developmental toxicity of genistein has been assessed in rats following oral exposure during gestation and lactation with exposures extended into the post-pubertal period in numerous studies. These data are sufficient to conclude that genistein is a developmental toxicant in rats as indicated by transient decreased F1 and F3 male pup body weights in a multigenerational study when rats were exposed to 100 ppm in the diet with a BMDL10 of 20 and 26 mg/kg bw/day (LOEL 7 and 9 mg/kg bw/day) in males and females, respectively (NCTR, 2005). It is unclear to the Expert Panel that a transient marginal body weight change in rat pups represents an adverse effect. Other developmental effects observed in this study at LOAELs of 35 mg/kg bw/day in males and 44 mg/kg bw/day in females included consistently decreased pup body weight, decreased anogenital distance in F1 males and F1 and F2 females, and accelerated vaginal opening and disrupted estrous cycles in females. Other oral studies in rats and mice confirmed female reproductive effects (accelerated vaginal opening, altered estrous cycles, mammary hyperplasia, persistent vaginal cornification, and alterations in uterine and ovarian histopathology), although at higher dose levels with shorter dose durations. A second dietary study (Delclos et al., 2001) with exposures from GD 7 to PND 50 (LOAELs of 83, 138, and 180 mg/kg/day, for gestation, lactation, and pup exposures, respectively) reported decreased dams delivering litters, delayed eye opening, altered prostate weight, and prostatic inflammation. Uterine weights were increased in PND 21 pups from dams exposed to 87 mg/kg bw/day in the diet during gestation and lactation (Casanova et al., 1999). In most cases, it is not possible to discern whether gestational or lactational exposure contributed to these developmental effects. Rats given 12.5 mg/kg bw/day by gavage on PND 1–5 exhibited effects in adulthood, which included decreases in body weights, epididymal weights, and numbers of pregnant females (Nagao et al., 2001). Females had polyovular follicles in this study. However, the relevance of these data to humans is difficult to determine due to the stress of direct dosing of neonates coupled with the altricial developmental state of neonatal rats. Oral studies were used in this assessment of developmental toxicity due to significant differences in genistein pharmacokinetics with subcutaneous exposures.
Other findings of possible significance include hyperplasia of male mammary tissue at 7 mg/kg bw/day and alveolar proliferation in female mammary tissue at 15–30 mg/kg/day (prenatal and lactational/post-pubertal exposures, respectively) (NCTR, 2005).
The experimental animal data are assumed to be relevant to the assessment of potential human hazard. The effect levels in the animal experiments extrapolate to a dose of genistein of approximately 200 mg/day (assuming the minimal dose of 20 mg/kg bw/day and a child body weight of 10 kg) to 6 g/day (assuming a dose of 86 mg/kg bw/day and an adult body weight of 70 kg). This dose estimate refers to only purified genistein and not to genistein glucosides occurring in any natural food matrix.
5.1.2 Genistein reproductive toxicity data
5.1.2.1 Male effects
Genistein has been shown to have effects on male reproduction in some but not all studies. In one study, male rats were treated by gavage for 28 days with genistein and evaluated for serum hormones, reproductive organ weights, histopathology, sperm morphology, and epididymal sperm head number (Okazaki et al., 2002). No treatment-related effects were observed on any of the selected endpoints, and the NOAEL was the highest dose level (1000 mg/kg bw/day). In another study, mice were gavaged with a high dose of genistein (470 mg/kg bw/day) and evaluated for fertility, sterility, and number of pups born (East, 1955). There was an increase in sterility and a decrease in fertility, including a decrease in the number of pups born. In a multigenerational study, rats were treated with different doses of genistein and evaluated for body weight, anogenital distance, and testicular descent (NCTR, 2005). Dietary exposure to genistein at an estimated level of 35 mg/kg bw/day decreased body weight and anogenital distance and increased the incidence of undescended testes. This study did not permit determination of whether the adverse effects were due to exposures during reproductive or developmental ages. It is estimated from these findings, however, that the LOAEL is 35 mg/kg bw/day.
5.2.1.2 Female effects
In both rats and mice, genistein has been shown to have effects on female reproduction. In one study, rats were treated with genistein, 17β-estradiol, or estradiol benzoate, and evaluated for LH responsiveness to GnRH (Hughes, 1987; Hughes et al., 1991a,b). The results indicated that genistein reduced LH responsiveness to GnRH when given intravenously, but this effect was not observed when genistein was given orally. In another study, mice were exposed in the diet to a high dose level of genistein (610 mg/kg bw/day) and evaluated for fertility, sterility, and number of pups born (East, 1955). There was an increase in the number of stillborn pups, but this effect resolved during the post-treatment matings. In a multigenerational study, rats were treated with different doses of genistein and evaluated for anogenital distance, vaginal opening, and estrous cyclicity (NCTR, 2005). Dietary exposure to genistein at an estimated dose level of 44 mg/kg bw/day decreased age at vaginal opening and anogenital distance and increased the incidence of abnormal estrous cycles. This study did not permit determination of whether the adverse effects were due to exposures during reproductive or developmental ages. It is estimated from this study, however, that the LOAEL is 44 mg/kg bw/day. While several studies indicate that genistein has effects on female reproduction, this finding was not uniform in all studies. In one study, rats were gavaged with genistein and evaluated for serum hormone levels, estrous cyclicity, and reproductive organ weight (Okazaki et al., 2002). At the highest dose level (1000 mg/kg bw/day) no effects were observed.
5.2 Summary of Human Exposure
Exposure to genistein, a phytoestrogen classified as an isoflavone (MAFF, 1998b; Setchell et al., 1998; UK Committee on Toxicity, 2003), can occur by consuming soy foods such as tofu, soy milk, soy flour, textured soy protein, tempeh, and miso (FDA, 2000). Soy oils or soy sauces contain little-to-no genistein (Setchell, 1998; ILSI, 1999). Soy protein can be used in baked goods, breakfast cereals, pasta, beverages, toppings, meat, poultry, fish products, and dairy-type products including imitation milk and cheese (United Soybean Board, 2004). Exposure to genistein can also occur through soy supplements marketed for the treatment of menopausal symptoms (Drugstore.com, 2004).
In most soy products, minor amounts of genistein and other isoflavones (daidzein and to a smaller extent glycitein) are present unconjugated as aglycones unless the foods are fermented as in tempeh and miso. Most genistein and other isoflavones in unfermented soy products are conjugated to a sugar molecule to form glycosides such as genistin, acetylgenistin, and malonylgenistin (UK Committee on Toxicity, 2003). Because glycosides are deconjugated in the gut to form the biologically active aglycone, exposure to a particular isoflavone (e.g., genistein) is theoretically the sum of the aglycone and respective glycoside concentrations converted on the basis of molecular weight (MAFF, 1998a; Setchell et al., 1998; UK Committee on Toxicity, 2003). However, the aglycone is reconjugated in the gut wall leaving approximately 1–2% free aglycone to enter the portal circulation.
Soy infant formulas are a source of genistein glycoside exposure in infants (Rozman et al., 2006). Levels of total isoflavone, but not genistein, have been reported for breast milk. (MAFF, 1998a). Levels of total isoflavones (aglycone+glycoside) were higher in breast milk from vegans and vegetarians than omnivores but still orders of magnitude lower than concentrations in soy formula.
Table 74 lists total genistein (aglycone+glycoside) intakes reported for various populations. Genistein intake was not reported separately for vegans, but total isoflavone intake in vegans in the UK was about an order magnitude higher than the total genistein intakes reported in Table 74. Total genistein intake is highly variable in the adult population; evidence supports the notion that this variability is not due to differences in study methods. Total genistein intake is estimated at 1–8 mg/kg bw/day in infants fed soy formula (Rozman et al., 2006).
Table 74.
Estimated Total Genistein Intakes for Selected Adult Populations
| Population | Total genistein intake (mg genistein equivalents/kg bw/day)a |
|---|---|
| Patients in clinical studies (US) | <0.014 |
| Omnivores or semivegetariansb (US) | 0.1 |
| Vegetariansb (US) | 0.14 |
| Japanese | 0.21–0.43 |
| Korean | 0.23 |
| Chinese | 0.03–0.26 |
Based on an average weight of 70 kg. From Table 4 in Section 1.
Faculty and staff at a naturopathic university
Urinary total genistein levels were measured in 2794 Americans age 6 years and older, who were selected to represent the US population, as part of the 2001–2002 National Health and Nutrition Examination Survey (Centers for Disease Control and Prevention, 2005). Urinary total genistein concentrations were provided by age, sex, and race/ethnicity. These data can be used to estimate daily urinary excretion of total genistein for comparison to other study populations.
5.3 Overall Conclusions
There are no human data available on developmental or reproductive toxicity of purified genistein. Available experimental data are sufficient to conclude that purified genistein can produce reproductive or developmental toxicity in rats and mice.
LOAELs for various developmental endpoints (e.g., histologic vs. non-histologic) in available rat and mouse studies were highly variable with some biomarkers being very sensitive and others less sensitive.
In a single multigenerational study, a developmental BMDL10 of 20–26 mg/kg bw/day (LOEL 7–9 mg/kg bw/day) was reported for a non-consistent decrease in body weight in male Sprague-Dawley rat pup weight during lactation in the F1 and F3 generations. This marginal decrease was restored by the time the study terminated and was not seen in the F2 and F4 generations. Pup body weights were consistently decreased in F1 and F2 generations at estimated dietary doses of 35–44 mg/kg bw/day.
A LOAEL of 35 mg/kg bw/day (male) and 44 mg/kg bw/day (female) for reproductive/developmental toxicity was identified based on decreased anogenital distance in male and female rat pups, abnormal estrous cyclicity, decreased age and body weight at vaginal opening in female pups, and increased age at testicular descent in male pups.
In a large multigenerational study, exposure to purified genistein occurred throughout fetal development as well as during adulthood. This experimental design made it extremely difficult for the Expert Panel to clearly separate developmental toxic effects from reproductive toxic effects. The Expert Panel viewed some of these diverse endpoints as a continuum from the maternal exposure (oral) to the effects observed in multigenerational offspring.
Even though there is a paucity of available human data on exposure to purified genistein, the Expert Panel expresses negligible concern for reproductive and developmental effects from exposure of adults in the general population. The most highly reported exposed human population is Japanese adults with ingestion of approximately 0.43 mg/kg bw/day. However, adverse effects in rodent studies were not observed at levels below 35–44 mg/kg bw/day. Therefore, the Expert Panel feels that under current exposure conditions, adults would be unlikely to consume sufficient daily levels of genistein to cause adverse reproductive or developmental effects.
The Expert Panel expresses negligible concern6 for adverse effects in neonates and infants who may consume up to 0.01–0.08 mg/kg bw/day of genistein aglycone contained in soy formula (it is noteworthy that about 1% of total genistein in soy formula is present as the aglycone; see Table 6 in the CERHR Soy Report).
5.4 Critical Data Needs
Critical data needs are defined as tests or measurements that could provide information to substantially improve an assessment of human reproductive and developmental risks. The items listed below underline exposure and effects considered by the Panel as critical data needs:
Subpopulation differences in exposures need to be characterized if genistein dietary supplements become available.
Accurate exposure and pharmacokinetic data in humans are needed, including volume of distribution, half-life, and protein binding. The degree of variability in the currently available data is not suitable for accurate calculations.
Previous studies in rats and mice have not allowed discrimination between developmental and reproductive outcomes. However, no human studies were identified and some end points were not identified in animal models:
Animal studies are needed to assess pregnancy, lactation, and postnatal exposure to genistein with regard to neurodevelopmental endpoints.
Animal study to assess structural alterations with prenatal exposures.
Human studies to evaluate endpoints identified from animal studies including effects on weight, reproductive indices and developmental outcomes.
Human longitudinal studies from prenatal exposure to age 18 to evaluate neurodevelopmental outcomes.
Case control studies of congenital malformations to assess developmental risk.
Footnotes
Following the Expert Panel meeting, some panel members reconsidered research needs 2–5 (Drs. Bhatia, Calafat, Flaws, Hansen, Hoyer, Jeffery, Rozman, Thomas) or research need 2 alone (Dr. Marty) and concluded that they/it would not be critical to a future evaluation of genistein.
This article is a U.S. Government work and, as such, is in the public domain in the United States of America.
This report is prepared according to the Guidelines for CERHR Panel Members established by NTP/NIEHS. The guidelines are available on the CERHR web site (http://cerhr.niehs.nih.gov/). The format for Expert Panel Reports includes synopses of studies reviewed, followed by an evaluation of the Strengths/Weaknesses and Utility (Adequacy) of the study for CERHR evaluation. Statements and conclusions made under Strengths/Weaknesses and Utility evaluations are those of the Expert Panel and are prepared according to the NTP/NIEHS guidelines. In addition, the Panel often makes comments or notes limitations in the synopses of the study. Bold, square brackets are used to enclose such statements. As discussed in the guidelines, square brackets are used to enclose key items of information not provided in a publication, limitations noted in the study, conclusions that dif fer from those of the authors, and conversions or analyses of data conducted by the Panel.
The findings and conclusions of this report are those of the Expert Panel and should not be construed to represent the views of the National Toxicology Program.
Benchmark doses are used commonly in a regulatory setting; however, they are used in this report when the underlying data permit their calculation, and are only supplied to provide one kind of description of the dose–response relationship in the underlying study. Calculation of a benchmark dose in this report does not mean that regulation based on the underlying data is recommended, or even that the underlying data are suitable for regulatory decision-making.
See the footnote to Table 33 for an explanation of the use of BMD in this report.
See the footnote to Table 33 for an explanation of the use of BMD in this report.
See footnote to Table 33 for an explanation of benchmark dose.
See the footnote to Table 33 for an explanation of the use of benchmark dose in this report.
Dr. Ruth Etzel did not concur with the Expert Panel’s “negligible concern” for developmental effects in the infant population. Dr. Etzel concluded that a higher level of concern, i.e., “concern”, was justified based on the expectation that genistein induced body weight changes could exhibit a linear dose–response relationship at low exposure levels, the fact that infants may receive no other foods than soy infant formula for up to 6 months, and the fact that exposure occurs during a critical time in infancy when any exposure may have the greatest potential to affect later neurologic status and reproductive competency.
Prepared With the Support of CERHR Staff: NTP/NIEHS, Michael Shelby, Ph.D. (Director, CERHR), Paul M.D. Foster, Ph.D. (Deputy Director, CERHR), Allen Dearry, Ph.D. (Interim Associate Director, NTP), Kristina Thayer, Ph.D. (NTP Liaison and Scientific Review Office); Sciences International, Inc., Anthony Scialli, M.D. (Principal Scientist), Annette Iannucci, M.S. (Toxicologist), Gloria Jahnke, D.V.M. (Toxicologist), Vera Jurgenson, M.S. (Research Associate).
References
- Adachi T, Ono Y, Koh KB, Takashima K, Tainaka H, Matsuno Y, Nakagawa S, Todaka E, Sakurai K, Fukata H, Iguchi T, Komiyama M, Mori C. Long-term alteration of gene expression without morphological change in testis after neonatal exposure to genistein in mice: toxicogenomic analysis using cDNA microarray. Food Chem Toxicol. 2004;42:445–452. doi: 10.1016/j.fct.2003.10.012. [DOI] [PubMed] [Google Scholar]
- Adeoya-Osiguwa SA, Markoulaki S, Pocock V, Milligan SR, Fraser LR. 17beta-Estradiol and environmental estrogens significantly affect mammalian sperm function. Hum Reprod. 2003;18:100–107. doi: 10.1093/humrep/deg037. [DOI] [PubMed] [Google Scholar]
- Adlercreutz H. Phytooestrogens and cancer. Lancet Oncol. 2002;3:364–373. doi: 10.1016/s1470-2045(02)00777-5. [DOI] [PubMed] [Google Scholar]
- Adlercreutz H, Fotsis T, Lampe J, Wahala K, Makela T, Brunow G, Hase T. Quantitative determination of lignans and isoflavonoids in plasma of omnivorous and vegetarian women by isotope dilution gas chromatography-mass spectrometry. Scand J Clin Lab Invest Suppl. 1993a;215:5–18. doi: 10.3109/00365519309090693. [DOI] [PubMed] [Google Scholar]
- Adlercreutz H, Markkanen H, Watanabe S. Plasma Concentrations of PhytoOestrogens in Japanese Men. Lancet. 1993b;342:1209–1210. doi: 10.1016/0140-6736(93)92188-y. [DOI] [PubMed] [Google Scholar]
- Adlercreutz H, Yamada T, Wahala K, Watanabe S, Businco L, Bruno G, Giampietro PG, Cantani A, Ferrara M, Ragno V. Maternal and neonatal phytoestrogens in Japanese women during birth. Am J Obstet Gynecol. 1999;180:737–743. doi: 10.1016/s0002-9378(99)70281-4. [DOI] [PubMed] [Google Scholar]
- Anderson D, Dobrzyänska MM, Basaran N. Effect of various genotoxins and reproductive toxins in human lymphocytes and sperm in the Comet assay. Teratog Carcinog Mutagen. 1997;17:29–43. doi: 10.1002/(sici)1520-6866(1997)17:1<29::aid-tcm5>3.0.co;2-h. [DOI] [PubMed] [Google Scholar]
- Anderson JJ, Ambrose WW, Garner SC. Biphasic effects of genistein on bone tissue in the ovariectomized, lactating rat model. Proc Soc Exp Biol Med. 1998;217:345–350. doi: 10.3181/00379727-217-44243. [DOI] [PubMed] [Google Scholar]
- Arai Y, Uehara M, Sato Y, Kimira M, Eboshida A, Adlercreutz H, Watanabe S. Comparison of isoflavones among dietary intake, plasma concentration and urinary excretion for accurate estimation of phytoestrogen intake. J Epidemiol. 2000;10:127–135. doi: 10.2188/jea.10.127. [DOI] [PubMed] [Google Scholar]
- Atanassova N, McKinnell C, Turner KJ, Walker M, Fisher JS, Morley M, Millar MR, Groome NP, Sharpe RM. Comparative effects of neonatal exposure of male rats to potent and weak (environmental) estrogens on spermatogenesis at puberty and the relationship to adult testis size and fertility: evidence for stimulatory effects of low estrogen levels. Endocrinology. 2000;141:3898–3907. doi: 10.1210/endo.141.10.7723. [DOI] [PubMed] [Google Scholar]
- Awoniyi CA, Roberts D, Veeramachaneni DN, Hurst BS, Tucker KE, Schlaff WD. Reproductive sequelae in female rats after in utero and neonatal exposure to the phytoestrogen genistein. Fertil Steril. 1998;70:440–447. doi: 10.1016/s0015-0282(98)00185-x. [DOI] [PubMed] [Google Scholar]
- Badger TM, Ronis MJ, Hakkak R, Rowlands JC, Korourian S. The health consequences of early soy consumption. J Nutr. 2002;132:559–565. doi: 10.1093/jn/132.3.559S. [DOI] [PubMed] [Google Scholar]
- Bajpai M, Asin S, Doncel GF. Effect of tyrosine kinase inhibitors on tyrosine phosphorylation and motility parameters in human sperm. Arch Androl. 2003;49:229–246. doi: 10.1080/01485010390196715. [DOI] [PubMed] [Google Scholar]
- Bajpai M, Doncel GF. Involvement of tyrosine kinase and cAMP-dependent kinase cross-talk in the regulation of human sperm motility. Reproduction. 2003;126:183–195. doi: 10.1530/rep.0.1260183. [DOI] [PubMed] [Google Scholar]
- Barnes S, Peterson TG, Coward L. Rationale for the use of genistein-containing soy matrices in chemoprevention trials for breast and prostate cancer. J Cell Biochem Suppl. 1995;22:181–187. doi: 10.1002/jcb.240590823. [DOI] [PubMed] [Google Scholar]
- Becker LA, Kunkel AJ, Brown MR, Ball EE, Williams MT. Effects of dietary phytoestrogen exposure during perinatal period. Neurotoxicol Teratol. 2005;27:27. doi: 10.1016/j.ntt.2005.05.007. [DOI] [PubMed] [Google Scholar]
- Bickoff E, Livingston A, Hendrickson A, Booth A. Forage estrogens: relative potencies of several estrogen-like compounds found in forages. J Agric Food Chem. 1962;10:410–412. [Google Scholar]
- Bloedon LT, Jeffcoat AR, Lopaczynski W, Schell MJ, Black TM, Dix KJ, Thomas BF, Albright C, Busby MG, Crowell JA, Zeisel SH. Safety and pharmacokinetics of purified soy isoflavones: single-dose administration to postmenopausal women. Am J Clin Nutr. 2002;76:1126–1137. doi: 10.1093/ajcn/76.5.1126. [DOI] [PubMed] [Google Scholar]
- Boettger-Tong H, Murthy L, Chiappetta C, Kirkland JL, Goodwin B, Adlercreutz H, Stancel GM, Makela S. A case of a laboratory animal feed with high estrogenic activity and its impact on in vivo responses to exogenously administered estrogens. Environmental Health Perspectives. 1998;106:369–373. doi: 10.1289/ehp.98106369. [DOI] [PMC free article] [PubMed] [Google Scholar]
- Boos G, Stopper H. Genotoxicity of several clinically used topoisomerase II inhibitors. Toxicol Lett. 2000;116:7–16. doi: 10.1016/s0378-4274(00)00192-2. [DOI] [PubMed] [Google Scholar]
- Borghoff S, Williams CC, Parkinson HD, Upmeier A. Transplacental transfer of genistein and conjugated metabolites in Sprague-Dawley rats. Toxicologist. 2003;72:147. [Google Scholar]
- Bouker KB, Hilakivi-Clarke L. Genistein: does it prevent or promote breast cancer? Environ Health Perspect. 2000;108:701–708. doi: 10.1289/ehp.00108701. [DOI] [PMC free article] [PubMed] [Google Scholar]
- Brown NM, Lamartiniere CA. Xenoestrogens alter mammary gland differentiation and cell proliferation in the rat. Environ Health Perspect. 1995;103:708–713. doi: 10.1289/ehp.95103708. [DOI] [PMC free article] [PubMed] [Google Scholar]
- Brown NM, Wang J, Cotroneo MS, Zhao YX, Lamartiniere CA. Prepubertal genistein treatment modulates TGF-alpha, EGF and EGF-receptor mRNAs and proteins in the rat mammary gland. Mol Cell Endocrinol. 1998;144:149–165. doi: 10.1016/s0303-7207(98)00106-3. [DOI] [PubMed] [Google Scholar]
- Busby MG, Jeffcoat AR, Bloedon LT, Koch MA, Black T, Dix KJ, Heizer WD, Thomas BF, Hill JM, Crowell JA, Zeisel SH. Clinical characteristics and pharmacokinetics of purified soy isoflavones: single-dose administration to healthy men. Am J Clin Nutr. 2002;75:126–136. doi: 10.1093/ajcn/75.1.126. [DOI] [PubMed] [Google Scholar]
- Cabanes A, Wang M, Olivo S, DeAssis S, Gustafsson JA, Khan G, Hilakivi-Clarke L. Prepubertal estradiol and genistein exposures up-regulate BRCA1 mRNA and reduce mammary tumorigenesis. Carcinogenesis. 2004;25:741–748. doi: 10.1093/carcin/bgh065. [DOI] [PubMed] [Google Scholar]
- Carter MW, Matrone G, Smart WWGJ. Effect of genistein on reproduction in the mouse. J Nutrition. 1955;55:639–645. doi: 10.1093/jn/55.4.639. [DOI] [PubMed] [Google Scholar]
- Casanova M, You L, Gaido KW, Archibeque-Engle S, Janszen DB, Heck HA. Developmental effects of dietary phytoestrogens in Sprague-Dawley rats and interactions of genistein and daidzein with rat estrogen receptors alpha and beta in vitro. Toxicol Sci. 1999;51:236–244. doi: 10.1093/toxsci/51.2.236. [DOI] [PubMed] [Google Scholar]
- Centers for Disease Control and Prevention. Report nr NCEH Pub No. 05–0570. Atlanta: Department of Health and Human Services, Centers for Disease Control and Prevention; 2005. Third National Report on Human Exposures to Environmental Chemicals. [Google Scholar]
- Chang HC, Churchwell MI, Delclos KB, Newbold RR, Doerge DR. Mass spectrometric determination of Genistein tissue distribution in diet-exposed Sprague-Dawley rats. J Nutr. 2000;130:1963–1970. doi: 10.1093/jn/130.8.1963. [DOI] [PubMed] [Google Scholar]
- Chang HC, Doerge DR. Dietary genistein inactivates rat thyroid peroxidase in vivo without an apparent hypothyroid effect. Toxicol Appl Pharmacol. 2000;168:244–252. doi: 10.1006/taap.2000.9019. [DOI] [PubMed] [Google Scholar]
- Chemfinder. Genistein. 2004 Available at http://chemfinder.cambridge-soft.com/result.asp.
- ChemIDplus. Genistein. 2004 Available at http://chem.sis.nlm.nih.gov/chemidplus/ProxyServlet?objectHandle=DBMaint&actionHandle=default&nextPage=jsp/chemidlite/ResultScreen.jsp&TXTSUPERLISTID=000446720. National Library of Medicine.
- Chen A, Rogan WJ. Isoflavones in soy infant formula: a review of evidence for endocrine and other activity in infants. Annu Rev Nutr. 2004;24:33–54. doi: 10.1146/annurev.nutr.24.101603.064950. [DOI] [PubMed] [Google Scholar]
- Chen A-C, Berhow MA, Tappenden KA, Donovan SM. Genistein inhibits intestinal cell proliferation in piglets. Pediatr Res. 2005;57:192–200. doi: 10.1203/01.PDR.0000150723.87976.32. [DOI] [PubMed] [Google Scholar]
- Chen Z, Zheng W, Custer LJ, Dai Q, Shu XO, Jin F, Franke AA. Usual dietary consumption of soy foods and its correlation with the excretion rate of isoflavonoids in overnight urine samples among Chinese women in Shanghai. Nutr Cancer. 1999;33:82–87. doi: 10.1080/01635589909514752. [DOI] [PubMed] [Google Scholar]
- Cheng EW, Yoder L, Story CD, Burroughs W. Estrogenic activity of some naturally occurring isoflavones. Ann NY Acad Sci. 1955;61:652–658. doi: 10.1111/j.1749-6632.1955.tb42518.x. discussion, 658–659. [DOI] [PubMed] [Google Scholar]
- Coldham NG, Sauer MJ. Pharmacokinetics of [(14)C]Genistein in the rat: gender-related differences, potential mechanisms of biological action, and implications for human health. Toxicol Appl Pharmacol. 2000;164:206–215. doi: 10.1006/taap.2000.8902. [DOI] [PubMed] [Google Scholar]
- Constantinou A, Huberman E. Genistein as an inducer of tumor cell differentiation: possible mechanisms of action. Proc Soc Exp Biol Med. 1995;208:109–115. doi: 10.3181/00379727-208-43841. [DOI] [PubMed] [Google Scholar]
- Cotroneo MS, Fritz WA, Lamartiniere CA. Dynamic profiling of estrogen receptor and epidermal growth factor signaling in the uteri of genistein- and estrogen-treated rats. Food Chem Toxicol. 2005;43:637–645. doi: 10.1016/j.fct.2004.12.022. [DOI] [PubMed] [Google Scholar]
- Cotroneo MS, Lamartiniere CA. Pharmacologic, but not dietary, genistein supports endometriosis in a rat model. Toxicol Sci. 2001;61:68–75. doi: 10.1093/toxsci/61.1.68. [DOI] [PubMed] [Google Scholar]
- Cotroneo MS, Wang J, Eltoum IA, Lamartiniere CA. Sex steroid receptor regulation by genistein in the prepubertal rat uterus. Mol Cell Endocrinol. 2001;173:135–145. doi: 10.1016/s0303-7207(00)00405-6. [DOI] [PubMed] [Google Scholar]
- Cotroneo MS, Wang J, Fritz WA, Eltoum IE, Lamartiniere CA. Genistein action in the prepubertal mammary gland in a chemo-prevention model. Carcinogenesis. 2002;23:1467–1474. doi: 10.1093/carcin/23.9.1467. [DOI] [PubMed] [Google Scholar]
- Coughtrie MW, Burchell B, Leakey JE, Hume R. The inadequacy of perinatal glucuronidation: immunoblot analysis of the developmental expression of individual UDP-glucuronosyltransferase iso-enzymes in rat and human liver microsomes. Mol Pharmacol. 1988;34:729–735. [PubMed] [Google Scholar]
- Csaba G, Inczefi-Gonda A. Effect of a single treatment (imprinting) with genistein or combined treatment with genistein+benzpyrene on the binding capacity of glucocorticoid and estrogen receptors of adult rats. Hum Exp Toxicol. 2002;21:231–234. doi: 10.1191/0960327102ht242oa. [DOI] [PubMed] [Google Scholar]
- Csaba G, Karabélyos C. Effect of single neonatal treatment with the soy bean phytosteroid, genistein on the sexual behavior of adult rats. Acta Physiol Hung. 2002;89:463–470. doi: 10.1556/APhysiol.89.2002.4.6. [DOI] [PubMed] [Google Scholar]
- Dalu A, Blaydes BS, Bryant CW, Latendresse JR, Weis CC, Barry Delclos K. Estrogen receptor expression in the prostate of rats treated with dietary genistein. J Chromatogr B Analyt Technol Biomed Life Sci. 2002;777:249–260. doi: 10.1016/s1570-0232(02)00346-x. [DOI] [PubMed] [Google Scholar]
- de Kleijn MJ, van der Schouw YT, Wilson PW, Adlercreutz H, Mazur W, Grobbee DE, Jacques PF. Intake of dietary phytoestrogens is low in postmenopausal women in the United States: the Framingham study(1–4) J Nutr. 2001;131:1826–1832. doi: 10.1093/jn/131.6.1826. [DOI] [PubMed] [Google Scholar]
- de Pascual-Teresa S, Hallund J, Talbot D, Schroot J, Williams CM, Bugel S, Cassidy A. Absorption of isoflavones in humans: effects of food matrix and processing. J Nutr Biochem. 2005;15:15. doi: 10.1016/j.jnutbio.2005.04.008. [DOI] [PubMed] [Google Scholar]
- Delclos KB, Bucci TJ, Lomax LG, Latendresse JR, Warbritton A, Weis CC, Newbold RR. Effects of dietary genistein exposure during development on male and female CD (Sprague-Dawley) rats. Reprod Toxicol. 2001;15:647–663. doi: 10.1016/s0890-6238(01)00177-0. [DOI] [PubMed] [Google Scholar]
- Di Virgilio AL, Iwami K, Watjen W, Kahl R, Degen GH. Genotoxicity of the isoflavones genistein, daidzein and equol in V79 cells. Toxicol Lett. 2004;151:151–162. doi: 10.1016/j.toxlet.2004.04.005. [DOI] [PubMed] [Google Scholar]
- Doerge DR, Chang HC, Churchwell MI, Holder CL. Analysis of soy isoflavone conjugation in vitro and in human blood using liquid chromatography-mass spectrometry. Drug Metab Dispos. 2000;28:298–307. [PubMed] [Google Scholar]
- Doerge DR, Churchwell MI, Chang HC, Newbold RR, Delclos KB. Placental transfer of the soy isoflavone genistein following dietary and gavage administration to Sprague Dawley rats. Reprod Toxicol. 2001;15:105–110. doi: 10.1016/s0890-6238(01)00108-3. [DOI] [PubMed] [Google Scholar]
- Doerge DR, Twaddle NC, Banks EP, Jefferson WN, Newbold RR. Pharmacokinetic analysis in serum of genistein administered subcutaneously to neonatal mice. Cancer Lett. 2002;184:21–27. doi: 10.1016/s0304-3835(02)00200-8. [DOI] [PubMed] [Google Scholar]
- Doerge DR, Twaddle NC, Churchwell MI, Newbold RR, Delclos KB. Lactational transfer of the soy isoflavone, genistein, in Sprague-Dawley rats consuming dietary genistein. Reprod Toxicol. 2006;21:307–312. doi: 10.1016/j.reprotox.2005.09.007. [DOI] [PubMed] [Google Scholar]
- Drugstore.com. 2004. Formulation information for soy supplements. Available at www.Drugstore.com
- East J. The effect of genistein on the fertility of mice. J Endocrinol. 1955;13:94–100. doi: 10.1677/joe.0.0130094. [DOI] [PubMed] [Google Scholar]
- Engel SM, Levy B, Liu Z, Kaplan D, Wolff MS. Xenobiotic phenols in early pregnancy amniotic fluid. Reprod Toxicol. 2006;21:110–112. doi: 10.1016/j.reprotox.2005.07.007. [DOI] [PubMed] [Google Scholar]
- EPA. Report nr EPA/600/6-87/008, NTIS PB88-179874/AS. Cincinnati, OH: Environmental Criteria and Assessment Office, Office of Health and Environmental Assessment. Office of Research and Development. U.S. Environmental Protection Agency. EPA/600/6-87/008, NTIS PB88-179874/AS; 1988. Recommendations and documentation of biological values for use in risk assessment. [Google Scholar]
- Faber KA, Hughes CL., Jr The effect of neonatal exposure to diethylstilbestrol, genistein, and zearalenone on pituitary responsiveness and sexually dimorphic nucleus volume in the castrated adult rat. Biol Reprod. 1991;45:649–653. doi: 10.1095/biolreprod45.4.649. [DOI] [PubMed] [Google Scholar]
- Faber KA, Hughes CL., Jr Dose-response characteristics of neonatal exposure to genistein on pituitary responsiveness to gonadotropin releasing hormone and volume of the sexually dimorphic nucleus of the preoptic area (SDN-POA) in postpubertal castrated female rats. Reprod Toxicol. 1993;7:35–39. doi: 10.1016/0890-6238(93)90007-t. [DOI] [PubMed] [Google Scholar]
- Farmakalidis E, Hathcock JN, Murphy PA. Estrogenic potency of genistin and daidzein in mice. Food Chem Toxicol. 1985;23:741–745. doi: 10.1016/0278-6915(85)90268-6. [DOI] [PubMed] [Google Scholar]
- Farmakalidis E, Murphy PA. Estrogenic response of the Cd-1 mouse to the soybean isoflavones genistein genistin and daidzein. Food Chem Toxicol. 1984;22:237–240. doi: 10.1016/0278-6915(84)90134-0. [DOI] [PubMed] [Google Scholar]
- FDA. 21 CFR Part 101. Food labeling: health claims; soy protein and coronary heart. 1999 Available at http://www.cfsan.fda.gov/~lrd/fr991026.html Disease. Federal Register 64 FR 57699. [PubMed]
- FDA. Food and Drug Administration; 2000. Soy: Health claims for soy protein, questions about other components. Available at http://vm.cfsan.fda.gov/~dms/fdsoypr.html#health. [PubMed] [Google Scholar]
- Ferguson SA, Flynn KM, Delclos KB, Newbold RR, Gough BJ. Effects of lifelong dietary exposure to genistein or nonylphenol on amphetamine-stimulated striatal dopamine release in male and female rats. Neurotoxicol Teratol. 2002;24:37–45. doi: 10.1016/s0892-0362(01)00193-3. [DOI] [PubMed] [Google Scholar]
- Fielden MR, Fong CJ, Haslam SZ, Zacharewski TR. Normal mammary gland morphology in pubertal female mice following in utero and lactational exposure to genistein at levels comparable to human dietary exposure. Toxicol Lett. 2002;133:181–191. doi: 10.1016/s0378-4274(02)00154-6. [DOI] [PubMed] [Google Scholar]
- Fielden MR, Samy SM, Chou KC, Zacharewski TR. Effect of human dietary exposure levels of genistein during gestation and lactation on long-term reproductive development and sperm quality in mice. Food Chem Toxicol. 2003;41:447–454. doi: 10.1016/s0278-6915(02)00284-3. [DOI] [PubMed] [Google Scholar]
- Fisher JS, Turner KJ, Brown D, Sharpe RM. Effect of neonatal exposure to estrogenic compounds on development of the excurrent ducts of the rat testis through puberty to adulthood. Environ Health Perspect. 1999;107:397–405. doi: 10.1289/ehp.99107397. [DOI] [PMC free article] [PubMed] [Google Scholar]
- Fitzpatrick M. Comments on isoflavones in soy-based infant formulas. J Agric Food Chem. 1998;46:3396–3397. doi: 10.1021/jf9805909. [DOI] [PubMed] [Google Scholar]
- Fitzpatrick M. Soy formulas and the effects of isoflavones on the thyroid. N Z Med J. 2000;113:24–26. [PubMed] [Google Scholar]
- Flynn KM, Ferguson SA, Delclos KB, Newbold RR. Effects of genistein exposure on sexually dimorphic behaviors in rats. Toxicol Sci. 2000a;55:311–319. doi: 10.1093/toxsci/55.2.311. [DOI] [PubMed] [Google Scholar]
- Flynn KM, Ferguson SA, Delclos KB, Newbold RR. Multi-generational exposure to dietary genistein has no severe effects on nursing behavior in rats. Neurotoxicology. 2000b;21:997–1001. [PubMed] [Google Scholar]
- Folman Y, Pope GS. The interaction in the immature mouse of potent oestrogens with coumestrol, genistein and other uterovaginotrophic compounds of low potency. J Endocrinol. 1966;34:215–225. doi: 10.1677/joe.0.0340215. [DOI] [PubMed] [Google Scholar]
- Foster WG, Chan S, Platt L, Hughes CL., Jr Detection of phytoestrogens in samples of second trimester human amniotic fluid. Toxicol Lett. 2002a;129:199–205. doi: 10.1016/s0378-4274(02)00018-8. [DOI] [PubMed] [Google Scholar]
- Foster WG, Hughes CL, Chan S, Platt L. Human developmental exposure to endocrine active compounds. Environ Toxicol Pharmacol. 2002b;12:75–81. doi: 10.1016/s1382-6689(02)00025-x. [DOI] [PubMed] [Google Scholar]
- Foster WG, Younglai EV, Boutross-Tadross O, Hughes CL, Wade MG. Mammary gland morphology in Sprague-Dawley rats following treatment with an organochlorine mixture in utero and neonatal genistein. Toxicol Sci. 2004;77:91–100. doi: 10.1093/toxsci/kfg247. [DOI] [PubMed] [Google Scholar]
- Franke AA, Custer LJ. Daidzein and genistein concentrations in human milk after soy consumption. Clin Chem. 1996;42:955–964. [PubMed] [Google Scholar]
- Franke AA, Custer LJ, Tanaka Y. Isoflavones in human breast milk and other biological fluids. Am J Clin Nutr. 1998;68:1466–1473. doi: 10.1093/ajcn/68.6.1466S. [DOI] [PubMed] [Google Scholar]
- Fritz WA, Cotroneo MS, Wang J, Eltoum IE, Lamartiniere CA. Dietary diethylstilbestrol but not genistein adversely affects rat testicular development. J Nutr. 2003;133:2287–2293. doi: 10.1093/jn/133.7.2287. [DOI] [PubMed] [Google Scholar]
- Fritz WA, Coward L, Wang J, Lamartiniere CA. Dietary genistein: perinatal mammary cancer prevention, bioavailability and toxicity testing in the rat. Carcinogenesis. 1998;19:2151–2158. doi: 10.1093/carcin/19.12.2151. [DOI] [PubMed] [Google Scholar]
- Fritz WA, Eltoum IE, Cotroneo MS, Lamartiniere CA. Genistein alters growth but is not toxic to the rat prostate. J Nutr. 2002a;132:3007–3011. doi: 10.1093/jn/131.10.3007. [DOI] [PubMed] [Google Scholar]
- Fritz WA, Wang J, Eltoum IE, Lamartiniere CA. Dietary genistein down-regulates androgen and estrogen receptor expression in the rat prostate. Mol Cell Endocrinol. 2002b;186:89–99. doi: 10.1016/s0303-7207(01)00663-3. [DOI] [PubMed] [Google Scholar]
- Guo TL, Chi RP, Zhang XL, Musgrove DL, Weis C, Germolec DR, White KL., Jr Modulation of immune response following dietary genistein exposure in F(0) and F(1) generations of C57BL/6 mice: evidence of thymic regulation. Food Chem Toxicol. 2006;44:316–325. doi: 10.1016/j.fct.2005.08.001. [DOI] [PubMed] [Google Scholar]
- Guo TL, Germolec DR, Musgrove DL, Delclos KB, Newbold RR, Weis C, White KL., Jr Myelotoxicity in genistein-, nonylphenol-, methoxychlor-, vinclozolin- or ethinyl estradiol-exposed F1 generations of Sprague-Dawley rats following developmental and adult exposures. Toxicology. 2005;211:207–219. doi: 10.1016/j.tox.2005.03.008. [DOI] [PubMed] [Google Scholar]
- Guo TL, Zhang XL, Bartolucci E, McCay JA, White KL, Jr, You L. Genistein and methoxychlor modulate the activity of natural killer cells and the expression of phenotypic markers by thymocytes and splenocytes in F0 and F1 generations of Sprague-Dawley rats. Toxicology. 2002;172:205–215. doi: 10.1016/s0300-483x(02)00005-7. [DOI] [PubMed] [Google Scholar]
- Haynes-Johnson D, Lai MT, Campen C, Palmer S. Diverse effects of tyrosine kinase inhibitors on follicle-stimulating hormone-stimulated estradiol and progesterone production from rat granulosa cells in serum-containing medium and serum-free medium containing epidermal growth factor. Biol Reprod. 1999;61:147–153. doi: 10.1095/biolreprod61.1.147. [DOI] [PubMed] [Google Scholar]
- Hess RA, Moore BJ. Histological methods for the evaluation of the testis. In: Chapin RE, Heindel JJ, editors. Methods in toxicology, Male reproductive toxicology. Vol. 3. New York, NY: Academic Press; 1993. pp. 52–85. [Google Scholar]
- Hilakivi-Clarke L, Cho E, Cabanes A, DeAssis S, Olivo S, Helferich W, Lippman ME, Clarke R. Dietary modulation of pregnancy estrogen levels and breast cancer risk among female rat offspring. Clin Cancer Res. 2002;8:3601–3610. [PubMed] [Google Scholar]
- Hilakivi-Clarke L, Cho E, Clarke R. Maternal genistein exposure mimics the effects of estrogen on mammary gland development in female mouse offspring. Oncol Rep. 1998;5:609–616. doi: 10.3892/or.5.3.609. [DOI] [PubMed] [Google Scholar]
- Hilakivi-Clarke L, Cho E, Onojafe I, Raygada M, Clarke R. Maternal exposure to genistein during pregnancy increases carcinogen-induced mammary tumorigenesis in female rat offspring. Oncol Rep. 1999a;6:1089–1095. doi: 10.3892/or.6.5.1089. [DOI] [PubMed] [Google Scholar]
- Hilakivi-Clarke L, Onojafe I, Raygada M, Cho E, Skaar T, Russo I, Clarke R. Prepubertal exposure to zearalenone or genistein reduces mammary tumorigenesis. Br J Cancer. 1999b;80:1682–1688. doi: 10.1038/sj.bjc.6690584. [DOI] [PMC free article] [PubMed] [Google Scholar]
- Hinsch KD, Aires V, Hagele W, Hinsch E. In vitro tests for essential sperm functions using the phytooestrogen genistein as a test substance. Andrologia. 2000;32:225–231. doi: 10.1046/j.1439-0272.2000.00389.x. [DOI] [PubMed] [Google Scholar]
- Hoey L, Rowland IR, Lloyd AS, Clarke DB, Wiseman H. Influence of soya-based infant formula consumption on isoflavone and gut microflora metabolite concentrations in urine and on fecal microflora composition and metabolic activity in infants and children. Br J Nutr. 2004;91:607–616. doi: 10.1079/BJN20031083. [DOI] [PubMed] [Google Scholar]
- Holder CL, Churchwell MI, Doerge DR. Quantification of soy isoflavones, genistein and daidzein, and conjugates in rat blood using LC/ES-MS. J Agric Food Chem. 1999;47:3764–3770. doi: 10.1021/jf9902651. [DOI] [PubMed] [Google Scholar]
- Hotchkiss CE, Weis C, Blaydes B, Newbold R, Delclos KB. Multigenerational exposure to genistein does not increase bone mineral density in rats. Bone. 2005;37:720–727. doi: 10.1016/j.bone.2005.06.005. [DOI] [PubMed] [Google Scholar]
- Huggett AC, Pridmore S, Malnoe A, Haschke F, Offord EA. Phytooestrogens in soy-based infant formula. Lancet. 1997;350:815–816. doi: 10.1016/s0140-6736(05)62613-x. [DOI] [PubMed] [Google Scholar]
- Hughes CL., Jr Effects of phytoestrogens on GnRH-induced luteinizing hormone secretion in ovariectomized rats. Reprod Toxicol. 1987;1:179–181. doi: 10.1016/s0890-6238(87)80030-8. [DOI] [PubMed] [Google Scholar]
- Hughes CL, Jr, Chakinala MM, Reece SG, Miller RN, Schomberg DW, Jr, Basham KB. Acute and subacute effects of naturally occurring estrogens on luteinizing hormone secretion in the ovariectomized rat: Part 2. Reprod Toxicol. 1991a;5:133–137. doi: 10.1016/0890-6238(91)90041-d. [DOI] [PubMed] [Google Scholar]
- Hughes CL, Jr, Kaldas RS, Weisinger AS, McCants CE, Basham KB. Acute and subacute effects of naturally occurring estrogens on luteinizing hormone secretion in the ovariectomized rat: Part 1. Reprod Toxicol. 1991b;5:127–132. doi: 10.1016/0890-6238(91)90040-m. [DOI] [PubMed] [Google Scholar]
- Hughes CL, Liu G, Beall S, Foster WG, Davis V. Effects of genistein or soy milk during late gestation and lactation on adult uterine organization in the rat. Exp Biol Med (Maywood) 2004;229:108–117. doi: 10.1177/153537020422900113. [DOI] [PubMed] [Google Scholar]
- Hutchins AM, Slavin JL, Lampe JW. Urinary isoflavonoid phytoestrogen and lignan excretion after consumption of fermented and unfermented soy products. J Am Diet Assoc. 1995;95:545–551. doi: 10.1016/S0002-8223(95)00149-2. [DOI] [PubMed] [Google Scholar]
- ILSI. Safety assessment and potential health benefits of food components based on selected scientific criteria. ILSI North America Technical Committee on Food Components for Health Promotion. Crit Rev Food Sci Nutr. 1999;39:203–316. doi: 10.1080/10408699991279169. [DOI] [PubMed] [Google Scholar]
- Irvine CH, Fitzpatrick MG, Alexander SL. Phytoestrogens in soy-based infant foods: concentrations, daily intake, and possible biological effects. Proc Soc Exp Biol Med. 1998a;217:247–253. doi: 10.3181/00379727-217-44229. [DOI] [PubMed] [Google Scholar]
- Irvine CH, Shand N, Fitzpatrick MG, Alexander SL. Daily intake and urinary excretion of genistein and daidzein by infants fed soy- or dairy-based infant formulas. Am J Clin Nutr. 1998b;68:1462–1465. doi: 10.1093/ajcn/68.6.1462S. [DOI] [PubMed] [Google Scholar]
- Ishimi Y, Arai N, Wang X, Wu J, Umegaki K, Miyaura C, Takeda A, Ikegami S. Difference in effective dosage of genistein on bone and uterus in ovariectomized mice. Biochem Biophys Res Commun. 2000;274:697–701. doi: 10.1006/bbrc.2000.3175. [DOI] [PubMed] [Google Scholar]
- Iwase Y, Fukata H, Mori C. Estrogenic compounds inhibit gap junctional intercellular communication in mouse Leydig TM3 cells. Toxicol Appl Pharmacol. 2005;212:237–246. doi: 10.1016/j.taap.2005.08.005. [DOI] [PubMed] [Google Scholar]
- Jefferson W, Newbold R, Padilla-Banks E, Pepling M. Neonatal genistein treatment alters ovarian differentiation in the mouse: inhibition of oocyte nest breakdown and increased oocyte survival. Biol Reprod. 2005a;74:161–168. doi: 10.1095/biolreprod.105.045724. [DOI] [PubMed] [Google Scholar]
- Jefferson WN, Couse JF, Padilla-Banks E, Korach KS, Newbold RR. Neonatal exposure to genistein induces estrogen receptor (ER)alpha expression and multi-oocyte follicles in the maturing mouse ovary: evidence for ERbeta-mediated and nonestrogenic actions. Biol Reprod. 2002a;67:1285–1296. doi: 10.1095/biolreprod67.4.1285. [DOI] [PubMed] [Google Scholar]
- Jefferson WN, Padilla-Banks E, Clark G, Newbold RR. Assessing estrogenic activity of phytochemicals using transcriptional activation and immature mouse uterotrophic responses. J Chromatogr B Analyt Technol Biomed Life Sci. 2002b;777:179–189. doi: 10.1016/s1570-0232(02)00493-2. [DOI] [PubMed] [Google Scholar]
- Jefferson WN, Padilla-Banks E, Newbold R. Adverse effects on female development and reproduction in CD-1 mice following neonatal exposure to the phytoestrogen genistein at environmentally relevant doses. Biol Reprod. 2005b;73:798–806. doi: 10.1095/biolreprod.105.041277. [DOI] [PubMed] [Google Scholar]
- Jefferson WN, Padilla-Banks E, Newbold RR. Altered gene expression in the murine uterus following developmental treatment with genistein, a soy phytoestrogen. Toxicologist. 2003;72:26. [Google Scholar]
- Jefferson WN, Pepling M, Padilla-Banks E, Newbold RR. The phytoestrogen genistein alters ovarian differentiation and subsequent fertility. Biol Reprod. 2004;(Special issue 195) [Google Scholar]
- Joannou GE, Kelly GE, Reeder AY, Waring M, Nelson C. A urinary profile study of dietary phytoestrogens. The identification and mode of metabolism of new isoflavonoids. J Steroid Biochem Mol Biol. 1995;54:167–184. doi: 10.1016/0960-0760(95)00131-i. [DOI] [PubMed] [Google Scholar]
- Jung EY, Lee BJ, Yun YW, Kang JK, Baek IJ, Jurg MY, Lee YB, Sohn HS, Lee JY, Kim KS, Yu WJ, Do JC, Kim YC, Nam SY. Effects of exposure to genistein and estradiol on reproductive development in immature male mice weaned from dams adapted to a soy-based commercial diet. J Vet Med Sci. 2004;66:1347–1354. doi: 10.1292/jvms.66.1347. [DOI] [PubMed] [Google Scholar]
- Kang KS, Che JH, Lee YS. Lack of adverse effects in the F1 offspring maternally exposed to genistein at human intake dose level. Food Chem Toxicol. 2002;40:43–51. doi: 10.1016/s0278-6915(01)00091-6. [DOI] [PubMed] [Google Scholar]
- Khan TH, Prasad L, Anuradha, Sultana S. Soy isoflavones inhibits the genotoxicity of benzo(a)pyrene in Swiss albino mice. Hum Exp Toxicol. 2005;24:149–155. doi: 10.1191/0960327105ht504oa. [DOI] [PubMed] [Google Scholar]
- Kim HS, Kang TS, Kang IH, Kim TS, Moon HJ, Kim IY, Ki H, Park KL, Lee BM, Yoo SD, Han SY. Validation study of OECD rodent uterotrophic assay for the assessment of estrogenic activity in Sprague-Dawley immature female rats. J Toxicol Environ Health A. 2005;68:2249–2262. doi: 10.1080/15287390500182354. [DOI] [PubMed] [Google Scholar]
- Kim J, Kwon C. Estimated dietary isoflavone intake of Korean population based on National Nutrition Survey. Nutr Res. 2001;21:947–953. doi: 10.1016/s0271-5317(01)00310-4. [DOI] [PubMed] [Google Scholar]
- Kiparissis Y, Balch GC, Metcalfe TL, Metcalfe CD. Effects of the isoflavones genistein and equol on the gonadal development of Japanese medaka Oryzias latipes. Environ Health Perspect. 2003;111:1158–1163. doi: 10.1289/ehp.5928. [DOI] [PMC free article] [PubMed] [Google Scholar]
- Kirk P, Patterson RE, Lampe J. Development of a soy food frequency questionnaire to estimate isoflavone consumption in US adults. J Am Diet Assoc. 1999;99:558–563. doi: 10.1016/S0002-8223(99)00139-X. [DOI] [PubMed] [Google Scholar]
- Klein SL, Wisniewski AB, Marson AL, Glass GE, Gearhart JP. Early exposure to genistein exerts long-lasting effects on the endocrine and immune systems in rats. Mol Med. 2002;8:742–749. [PMC free article] [PubMed] [Google Scholar]
- Kouki T, Kishitake M, Okamoto M, Oosuka I, Takebe M, Yamanouchi K. Effects of neonatal treatment with phytoestrogens, genistein and daidzein, on sex difference in female rat brain function: estrous cycle and lordosis. Horm Behav. 2003;44:140–145. doi: 10.1016/s0018-506x(03)00122-3. [DOI] [PubMed] [Google Scholar]
- Kuiper GGJ, Lemmen JG, Carlsson B, Corton JC, Safe SH, Van Der Saag PT, Van Der Burg B, Gustafsson JA. Interaction of estrogenic chemicals and phytoestrogens with estrogen receptor beta. Endocrinology. 1998;139:4252–4263. doi: 10.1210/endo.139.10.6216. [DOI] [PubMed] [Google Scholar]
- Kulling SE, Metzler M. Induction of micronuclei, DNA strand breaks and HPRT mutations in cultured Chinese hamster V79 cells by the phytoestrogen coumestrol. Food Chem Toxicol. 1997;35:605–613. doi: 10.1016/s0278-6915(97)00022-7. [DOI] [PubMed] [Google Scholar]
- Kulling SE, Rosenberg B, Jacobs E, Metzler M. The phytoestrogens coumestrol and genistein induce structural chromosomal aberrations in cultured human peripheral blood lymphocytes. Arch Toxicol. 1999;73:50–54. doi: 10.1007/s002040050585. [DOI] [PubMed] [Google Scholar]
- Kumi-Diaka J, Nguyen V, Butler A. Cytotoxic potential of the phytochemical genistein isoflavone (4′,5′,7-trihydroxyisoflavone) and certain environmental chemical compounds on testicular cells. Biol Cell. 1999;91:515–523. doi: 10.1016/s0248-4900(00)88208-8. [DOI] [PubMed] [Google Scholar]
- Kumi-Diaka J, Rodriguez R, Goudaze G. Influence of genistein (4′,5,7-trihydroxyisoflavone) on the growth and proliferation of testicular cell lines. Biol Cell. 1998;90:349–354. [PubMed] [Google Scholar]
- Kurzer MS. Hormonal effects of soy in premenopausal women and men. J Nutr. 2002;132:570–573. doi: 10.1093/jn/132.3.570S. [DOI] [PubMed] [Google Scholar]
- Kurzer MS, Xu X. Dietary phytoestrogens. Annu Rev Nutr. 1997;17:353–381. doi: 10.1146/annurev.nutr.17.1.353. [DOI] [PubMed] [Google Scholar]
- Kyselova V, Peknicova J, Boubelik M, Buckiova D. Body and organ weight, sperm acrosomal status and reproduction after genistein and diethylstilbestrol treatment of CD1 mice in a multigenerational study. Theriogenology. 2004;61:1307–1325. doi: 10.1016/j.theriogenology.2003.07.017. [DOI] [PubMed] [Google Scholar]
- Lamartiniere CA. Protection against breast cancer with genistein: a component of soy. Am J Clin Nutr. 2000;71:1705–1707. doi: 10.1093/ajcn/71.6.1705S. discussion 1708–1709. [DOI] [PubMed] [Google Scholar]
- Lamartiniere CA, Moore J, Holland M, Barnes S. Neonatal genistein chemo prevents mammary cancer. Proc Soc Exp Biol Med. 1995a;208:120–123. doi: 10.3181/00379727-208-43843. [DOI] [PubMed] [Google Scholar]
- Lamartiniere CA, Moore JB, Brown NM, Thompson R, Hardin MJ, Barnes S. Genistein suppresses mammary cancer in rats. Carcinogenesis. 1995b;16:2833–2840. doi: 10.1093/carcin/16.11.2833. [DOI] [PubMed] [Google Scholar]
- Lamartiniere CA, Zhang JX, Cotroneo MS. Genistein studies in rats: potential for breast cancer prevention and reproductive and developmental toxicity. Am J Clin Nutr. 1998;68:1400–1405. doi: 10.1093/ajcn/68.6.1400S. [DOI] [PubMed] [Google Scholar]
- Lampe JW. Isoflavonoid and lignan phytoestrogens as dietary biomarkers. J Nutr. 2003;133:956–964. doi: 10.1093/jn/133.3.956S. [DOI] [PubMed] [Google Scholar]
- Lampe JW, Gustafson DR, Hutchins AM, Martini MC, Li S, Wahala K, Grandits GA, Potter JD, Slavin JL. Urinary isoflavonoid and lignan excretion on a Western diet: relation to soy, vegetable, and fruit intake. Cancer Epidemiol Biomarkers Prev. 1999;8:699–707. [PubMed] [Google Scholar]
- Lapcík O, Hill M, Hampl R, Wähälä K, Adlercreutz H. Identification of isoflavonoids in beer. Steroids. 1998;63:14–20. doi: 10.1016/s0039-128x(97)00104-9. [DOI] [PubMed] [Google Scholar]
- Laurenzana EM, Weis CC, Bryant CW, Newbold R, Delclos KB. Effect of dietary administration of genistein, nonylphenol or ethinyl estradiol on hepatic testosterone metabolism, cytochrome P-450 enzymes, and estrogen receptor alpha expression. Food Chem Toxicol. 2002;40:53–63. doi: 10.1016/s0278-6915(01)00095-3. [DOI] [PubMed] [Google Scholar]
- Lee BJ, Jung EY, Yun YW, Kang JK, Baek IJ, Yon JM, Lee YB, Sohn HS, Lee JY, Kim KS, Nam SY. Effects of exposure to genistein during pubertal development on the reproductive system of male mice. J Reprod Dev. 2004a;50:399–409. doi: 10.1262/jrd.50.399. [DOI] [PubMed] [Google Scholar]
- Lee GS, Choi KC, Kim HJ, Jeung EB. Effect of genistein as a selective estrogen receptor beta agonist on the expression of Calbindin-D9k in the uterus of immature rats. Toxicol Sci. 2004b;82:451–457. doi: 10.1093/toxsci/kfh296. [DOI] [PubMed] [Google Scholar]
- Legler J, Van Den Brink CE, Brouwer A, Murk AJ, Van Der Saag PT, Vethaak AD, Van Der Burg B. Development of a stably transfected estrogen receptor-mediated luciferase reporter gene assay in the human T47D breast cancer cell line. Toxicol Sci. 1999;48:55–66. doi: 10.1093/toxsci/48.1.55. [DOI] [PubMed] [Google Scholar]
- Levy JR, Faber KA, Ayyash L, Hughes CL., Jr The effect of prenatal exposure to the phytoestrogen genistein on sexual differentiation in rats. Proc Soc Exp Biol Med. 1995;208:60–66. doi: 10.3181/00379727-208-43832. [DOI] [PubMed] [Google Scholar]
- Lewis RW, Brooks N, Milburn GM, Soames A, Stone S, Hall M, Ashby J. The effects of the phytoestrogen genistein on the postnatal development of the rat. Toxicol Sci. 2003;71:74–83. doi: 10.1093/toxsci/71.1.74. [DOI] [PubMed] [Google Scholar]
- Lu LJ, Anderson KE. Sex and long-term soy diets affect the metabolism and excretion of soy isoflavones in humans. Am J Clin Nutr. 1998;68:1500–1504. doi: 10.1093/ajcn/68.6.1500S. [DOI] [PubMed] [Google Scholar]
- Luijten M, Thomsen AR, van den Berg JA, Wester PW, Verhoef A, Nagelkerke NJ, Adlercreutz H, van Kranen HJ, Piersma AH, Sorensen IK, Rao GN, van Kreijl CF. Effects of soy-derived isoflavones and a high-fat diet on spontaneous mammary tumor development in Tg.NK (MMTV/c-neu) mice. Reprod Toxicol. 2004;18:735–736. doi: 10.1207/s15327914nc5001_7. [DOI] [PubMed] [Google Scholar]
- MAFF. Report nr FS 2929. Reading, UK: The University of Reading; 1998a. Levels of plant oestrogens in the diets of infants and toddlers. [Google Scholar]
- MAFF. London, UK: Ministry of Agriculture, Fisheries, and Food. Report nr 167; 1998b. Plant oestrogens in soya-based infant formulae. http://archive.food.gov.uk/maff/archive/food/infsheet/1998/no167/167phy.htm. [Google Scholar]
- Mäkelä S, Santti R, Salo L, McLachlan JA. Phytoestrogens are partial estrogen agonists in the adult male mouse. Environ Health Perspect. 1995a;103(Suppl):123–127. doi: 10.1289/ehp.103-1518873. [DOI] [PMC free article] [PubMed] [Google Scholar]
- Mäkelä S, Savolainen H, Aavik E, Myllarniemi M, Strauss L, Taskinen E, Gustafsson JA, Hayry P. Differentiation between vasculoprotective and uterotrophic effects of ligands with different binding affinities to estrogen receptors alpha and beta. Proc Natl Acad Sci USA. 1999;96:7077–7082. doi: 10.1073/pnas.96.12.7077. [DOI] [PMC free article] [PubMed] [Google Scholar]
- Mäkelä SI, Pylkkanen LH, Santti RS, Adlercreutz H. Dietary soybean may be antiestrogenic in male mice. J Nutr. 1995b;125:437–445. doi: 10.1093/jn/125.3.437. [DOI] [PubMed] [Google Scholar]
- Markiewicz L, Garey J, Adlercreutz H, Gurpide E. In vitro bioassays of non-steroidal phytoestrogens. J Steroid Biochem Mol Biol. 1993;45:399–405. doi: 10.1016/0960-0760(93)90009-l. [DOI] [PubMed] [Google Scholar]
- Maskarinec G, Singh S, Meng L, Franke AA. Dietary soy intake and urinary isoflavone excretion among women from a multiethnic population. Cancer Epidemiol Biomarkers Prev. 1998;7:613–619. [PubMed] [Google Scholar]
- Masutomi N, Shibutani M, Takagi H, Uneyama C, Lee KY, Hirose M, Takahashi N, Kouki T, Kishitake M, Okamoto M, Oosuka I, Takebe M, Yamanouchi K, Brown NM, Setchell KD. Alteration of pituitary hormone-immunoreactive cell populations in rat offspring after maternal dietary exposure to endocrine-active chemicals. Arch Toxicol. 2004;78:232–240. doi: 10.1007/s00204-003-0528-x. [DOI] [PubMed] [Google Scholar]
- Masutomi N, Shibutani M, Takagi H, Uneyama C, Takahashi N, Hirose M. Impact of dietary exposure to methoxychlor, genistein, or diisononyl phthalate during the perinatal period on the development of the rat endocrine/reproductive systems in later life. Toxicology. 2003;192:149–170. doi: 10.1016/s0300-483x(03)00269-5. [DOI] [PubMed] [Google Scholar]
- Matrone G, Smart WWG, Jr, Carter MW, Smart VW, Garren HW. Effect of genistin on growth and development of the male mouse. J Nutr. 1956;59:235–241. doi: 10.1093/jn/59.2.235. [DOI] [PubMed] [Google Scholar]
- Mazur W. Phytoestrogen content in foods. Bailliere Clin Endocrinol Metab. 1998;12:729–742. doi: 10.1016/s0950-351x(98)80013-x. [DOI] [PubMed] [Google Scholar]
- McClain RM, Wolz E, Davidovich A, Bausch J. Genetic toxicity studies with genistein. Food Chem Toxicol. 2006a;44:42–55. doi: 10.1016/j.fct.2005.06.004. [DOI] [PubMed] [Google Scholar]
- McClain RM, Wolz E, Davidovich A, Pfannkuch F, Bausch J. Subchronic and chronic safety studies with genistein in dogs. Food Chem Toxicol. 2005;43:1461–1482. doi: 10.1016/j.fct.2005.02.017. [DOI] [PubMed] [Google Scholar]
- McClain RM, Wolz E, Davidovich A, Pfannkuch F, Edwards JA, Bausch J. Acute, subchronic and chronic safety studies with genistein in rats. Food Chem Toxicol. 2006b;44:56–80. doi: 10.1016/j.fct.2005.05.021. [DOI] [PubMed] [Google Scholar]
- Milligan SR, Balasubramanian AV, Kalita JC. Relative potency of xenobiotic estrogens in an acute in vivo mammalian assay. Environ Health Perspect. 1998;106:23–26. doi: 10.1289/ehp.9810623. [DOI] [PMC free article] [PubMed] [Google Scholar]
- Misra RR, Hursting SD, Perkins SN, Sathyamoorthy N, Mirsalis JC, Riccio ES, Crowell JA. Genotoxicity and carcinogenicity studies of soy isoflavones. Int J Toxicol. 2002;21:277–285. doi: 10.1080/10915810290096441. [DOI] [PubMed] [Google Scholar]
- Mitchell JH, Duthie SJ, Collins AR. Effects of phytoestrogens on growth and DNA integrity in human prostate tumor cell lines: PC-3 and LNCaP. Nutr Cancer. 2000;38:223–228. doi: 10.1207/S15327914NC382_12. [DOI] [PubMed] [Google Scholar]
- Moersch GW, Morrow DF, Neuklis WA. The antifertility activity of isoflavones related to genistein. J Med Chem. 1967;10:154–158. doi: 10.1021/jm00314a005. [DOI] [PubMed] [Google Scholar]
- Munro IC, Harwood M, Hlywka JJ, Stephen AM, Doull J, Flamm WG, Adlercreutz H. Soy isoflavones: a safety review. Nutr Rev. 2003;61:1–33. doi: 10.1301/nr.2003.janr.1-33. [DOI] [PubMed] [Google Scholar]
- Murphy PA, Song T, Buseman G, Barua K. Isoflavones in soy-based infant formulas. J Agric Food Chem. 1997;45:4635–4638. [Google Scholar]
- Murrill WB, Brown NM, Zhang JX, Manzolillo PA, Barnes S, Lamartiniere CA. Prepubertal genistein exposure suppresses mammary cancer and enhances gland differentiation in rats. Carcinogenesis. 1996;17:1451–1457. doi: 10.1093/carcin/17.7.1451. [DOI] [PubMed] [Google Scholar]
- Myllymäkii S, Haavisto T, Vainio M, Toppari J, Paranko J. In vitro effects of diethylstilbestrol, genistein, 4-tert-butylphenol, and 4-tert-octylphenol on steroidogenic activity of isolated immature rat ovarian follicles. Toxicol Appl Pharmacol. 2005;204:69–80. doi: 10.1016/j.taap.2004.08.009. [DOI] [PubMed] [Google Scholar]
- Naciff JM, Hess KA, Overmann GJ, Torontali SM, Carr GJ, Tiesman JP, Foertsch LM, Richardson BD, Martinez JE, Daston GP. Gene expression changes induced in the testis by transplacental exposure to high and low doses of 17alpha-ethynyl estradiol, genistein, or bisphenol A. Toxicol Sci. 2005;86:396–416. doi: 10.1093/toxsci/kfi198. [DOI] [PubMed] [Google Scholar]
- Naciff JM, Jump ML, Torontali SM, Carr GJ, Tiesman JP, Overmann GJ, Daston GP. Gene expression profile induced by 17alpha-ethynyl estradiol, bisphenol A, and genistein in the developing female reproductive system of the rat. Toxicol Sci. 2002;68:184–199. doi: 10.1093/toxsci/68.1.184. [DOI] [PubMed] [Google Scholar]
- Nagao T, Yoshimura S, Saito Y, Nakagomi M, Usumi K, Ono H. Reproductive effects in male and female rats of neonatal exposure to genistein. Reprod Toxicol. 2001;15:399–411. doi: 10.1016/s0890-6238(01)00141-1. [DOI] [PubMed] [Google Scholar]
- NCTR. 1. Genistein: evaluation of reproductive effects over multiple generations [Volume 1] and the chronic effects [Volume II] of exposure during various life states. Jefferson AR: National Center for Toxicological Research; 2005. [Google Scholar]
- Newbold RR, Banks EP, Bullock B, Jefferson WN. Uterine adenocarcinoma in mice treated neonatally with genistein. Cancer Res. 2001;61:4325–4328. [PubMed] [Google Scholar]
- Nikaido Y, Danbara N, Tsujita-Kyutoku M, Yuri T, Uehara N, Tsubura A. Effects of prepubertal exposure to xenoestrogen on development of estrogen target organs in female CD-1 mice. In Vivo. 2005;19:487–494. [PubMed] [Google Scholar]
- Nikaido Y, Yoshizawa K, Danbara N, Tsujita-Kyutoku M, Yuri T, Uehara N, Tsubura A. Effects of maternal xeno-estrogen exposure on development of the reproductive tract and mammary gland in female CD-1 mouse offspring. Reprod Toxicol. 2004;18:803–811. doi: 10.1016/j.reprotox.2004.05.002. [DOI] [PubMed] [Google Scholar]
- Norton JN, Vigne JL, Skinner MK. Regulation of Sertoli cell differentiation by the testicular paracrine factor PModS: analysis of common signal transduction pathways. Endocrinology. 1994;134:149–157. doi: 10.1210/endo.134.1.7903930. [DOI] [PubMed] [Google Scholar]
- Noteboom WD, Gorski J. Estrogenic effects of genistein and coumestrol diacetate. Endocrinology. 1963;73:736–739. doi: 10.1210/endo-73-6-736. [DOI] [PubMed] [Google Scholar]
- Odum J, Tinwell H, Jones K, Van Miller JP, Joiner RL, Tobin G, Kawasaki H, Deghenghi R, Ashby J. Effect of rodent diets on the sexual development of the rat. Toxicol Sci. 2001;61:115–127. doi: 10.1093/toxsci/61.1.115. [DOI] [PubMed] [Google Scholar]
- Okazaki K, Okazaki S, Nakamura H, Kitamura Y, Hatayama K, Wakabayashi S, Tsuda T, Katsumata T, Nishikawa A, Hirose M. A repeated 28-day oral dose toxicity study of genistein in rats, based on the ‘Enhanced OECD Test Guideline 407′ for screening endocrine-disrupting chemicals. Arch Toxicol. 2002;76:553–559. doi: 10.1007/s00204-002-0376-0. [DOI] [PubMed] [Google Scholar]
- Panzica G, Mura E, Pessatti M, Viglietti-Panzica C. Early embryonic administration of xenoestrogens alters vasotocin system and male sexual behavior of the Japanese quail. Domest Anim Endocrinol. 2005;29:436–445. doi: 10.1016/j.domaniend.2005.02.010. [DOI] [PubMed] [Google Scholar]
- Patisaul HB, Fortino AE, Polston EK. Neonatal genistein or bisphenol-A exposure alters sexual differentiation of the AVPV. Neurotoxicol Teratol. 2006;28:111–118. doi: 10.1016/j.ntt.2005.11.004. [DOI] [PubMed] [Google Scholar]
- Pei RJ, Sato M, Yuri T, Danbara N, Nikaido Y, Tsubura A. Effect of prenatal and prepubertal genistein exposure on N-methyl-N-nitrosourea-induced mammary tumorigenesis in female Sprague-Dawley rats. In Vivo. 2003;17:349–357. [PubMed] [Google Scholar]
- Perel E, Lindner HR. Dissociation of uterotrophic action from implantation-inducing activity in two non-steroidal oestrogens (coumestrol and genistein) J Reprod Fertil. 1970;21:171–175. doi: 10.1530/jrf.0.0210171. [DOI] [PubMed] [Google Scholar]
- Pfeiffer E, Treiling CR, Hoehle SI, Metzler M. Isoflavones modulate the glucuronidation of estradiol in human liver microsomes. Carcinogenesis. 2005;26:2172–2178. doi: 10.1093/carcin/bgi197. [DOI] [PubMed] [Google Scholar]
- Pumford SL, Morton MM, Turkes A, Griffiths K. Determination of the isoflavonoids genistein and daidzein in biological samples by gas chromatography-mass spectrometry. Ann Clin Biochem. 2002;39:281–292. doi: 10.1258/0004563021901982. [DOI] [PubMed] [Google Scholar]
- Rannikko A, Petas A, Rannikko S, Adlercreutz H. Plasma and prostate phytoestrogen concentrations in prostate cancer patients after oral phytoestrogen supplementation. Prostate. 2006;66:82–87. doi: 10.1002/pros.20315. [DOI] [PubMed] [Google Scholar]
- Roberts D, Veeramachaneni DN, Schlaff WD, Awoniyi CA. Effects of chronic dietary exposure to genistein, a phytoestrogen, during various stages of development on reproductive hormones and spermatogenesis in rats. Endocrine. 2000;13:281–286. doi: 10.1385/ENDO:13:3:281. [DOI] [PubMed] [Google Scholar]
- Rozman KK, Bhatia J, Calafat AM, Chambers C, Culty M, Etzel RA, Flaws JA, Hansen DK, Hoyer PB, Jeffery EH, Kesner JS, Marty S, Thomas JA, Umbach D. NTP-CERHR Expert Panel Report on the reproductive and developmental toxicity of soy formula. Birth Defects Res (Part B) 2006;77:280–397. doi: 10.1002/bdrb.20086. [DOI] [PMC free article] [PubMed] [Google Scholar]
- Santell RC, Chang YC, Nair MG, Helferich WG. Dietary genistein exerts estrogenic effects upon the uterus, mammary gland and the hypothalamic/pituitary axis in rats. J Nutr. 1997;127:263–269. doi: 10.1093/jn/127.2.263. [DOI] [PubMed] [Google Scholar]
- Scallet AC, Divine RL, Newbold RR, Delclos KB. Increased volume of the calbindin D28k-labeled sexually dimorphic hypothalamus in genistein and nonylphenol-treated male rats. Toxicol Sci. 2004;82:570–576. doi: 10.1093/toxsci/kfh297. [DOI] [PubMed] [Google Scholar]
- Seow A, Shi CY, Franke AA, Hankin JH, Lee HP, Yu MC. Isoflavonoid levels in spot urine are associated with frequency of dietary soy intake in a population-based sample of middle-aged and older Chinese in Singapore. Cancer Epidemiol Biomarkers Prev. 1998;7:135–140. [PubMed] [Google Scholar]
- Setchell KD. Phytoestrogens: the biochemistry, physiology, and implications for human health of soy isoflavones. Am J Clin Nutr. 1998;68:1333–1346. doi: 10.1093/ajcn/68.6.1333S. [DOI] [PubMed] [Google Scholar]
- Setchell KD, Brown NM, Desai P, Zimmer-Nechemias L, Wolfe BE, Brashear WT, Kirschner AS, Cassidy A, Heubi JE. Bio-availability of pure isoflavones in healthy humans and analysis of commercial soy isoflavone supplements. J Nutr. 2001;131:1362S–1375S. doi: 10.1093/jn/131.4.1362S. [DOI] [PubMed] [Google Scholar]
- Setchell KD, Faughnan MS, Avades T, Zimmer-Nechemias L, Brown NM, Wolfe BE, Brashear WT, Desai P, Oldfield MF, Botting NP, Cassidy A. Comparing the pharmacokinetics of daidzein and genistein with the use of 13C-labeled tracers in premenopausal women. Am J Clin Nutr. 2003;77:411–419. doi: 10.1093/ajcn/77.2.411. [DOI] [PubMed] [Google Scholar]
- Setchell KD, Zimmer-Nechemias L, Cai J, Heubi JE. Exposure of infants to phytooestrogens from soy-based infant formula. Lancet. 1997;350:23–27. doi: 10.1016/S0140-6736(96)09480-9. [DOI] [PubMed] [Google Scholar]
- Setchell KD, Zimmer-Nechemias L, Cai J, Heubi JE. Isoflavone content of infant formulas and the metabolic fate of these phytoestrogens in early life. Am J Clin Nutr. 1998;68:1453–1461. doi: 10.1093/ajcn/68.6.1453S. [DOI] [PubMed] [Google Scholar]
- Sfakianos J, Coward L, Kirk M, Barnes S. Intestinal uptake and biliary excretion of the isoflavone genistein in rats. J Nutr. 1997;127:1260–1268. doi: 10.1093/jn/127.7.1260. [DOI] [PubMed] [Google Scholar]
- Shelby MK, Cherrington NJ, Vansell NR, Klaassen CD. Tissue mRNA expression of the rat UDP-glucuronosyltransferase gene family. Drug Metab Dispos. 2003;31:326–333. doi: 10.1124/dmd.31.3.326. [DOI] [PubMed] [Google Scholar]
- Shibayama T, Fukata H, Sakurai K, Adachi T, Komiyama M, Iguchi T, Mori C. Neonatal exposure to genistein reduces expression of estrogen receptor alpha and androgen receptor in testes of adult mice. Endocr J. 2001;48:655–663. doi: 10.1507/endocrj.48.655. [DOI] [PubMed] [Google Scholar]
- Slikker W, Jr, Scallet AC, Doerge DR, Ferguson SA. Gender-based differences in rats after chronic dietary exposure to genistein. Int J Toxicol. 2001;20:175–179. doi: 10.1080/109158101317097764. [DOI] [PubMed] [Google Scholar]
- Song TT, Hendrich S, Murphy PA. Estrogenic activity of glycitein, a soy isoflavone. J Agric Food Chem. 1999;47:1607–1610. doi: 10.1021/jf981054j. [DOI] [PubMed] [Google Scholar]
- Soucy NV, Parkinson HD, Sochaski MA, Borghoff SJ. Kinetics of genistein and its conjugated metabolites in pregnant Sprague-Dawley rats following single and repeated genistein administration. Toxicol Sci. 2006;90:230–240. doi: 10.1093/toxsci/kfj077. [DOI] [PubMed] [Google Scholar]
- Soyfoods Association of North America. Soy-foods Association of North America; 2003. Soyfood sales and trends. Available at http://www.soyfoods.org/press/FAQ_sales.htm. [Google Scholar]
- Stahl S, Chun TY, Gray WG. Phytoestrogens act as estrogen agonists in an estrogen-responsive pituitary cell line. Toxicol Appl Pharmacol. 1998;152:41–48. doi: 10.1006/taap.1998.8500. [DOI] [PubMed] [Google Scholar]
- Steer TE, Johnson IT, Gee JM, Gibson GR. Metabolism of the soybean isoflavone glycoside genistin in vitro by human gut bacteria and the effect of prebiotics. Br J Nutr. 2003;90:635–642. doi: 10.1079/bjn2003949. [DOI] [PubMed] [Google Scholar]
- Strauss L, Makela S, Joshi S, Huhtaniemi I, Santti R. Genistein exerts estrogen-like effects in male mouse reproductive tract. Mol Cell Endocrinol. 1998;144:83–93. doi: 10.1016/s0303-7207(98)00152-x. [DOI] [PubMed] [Google Scholar]
- Strick R, Strissel PL, Borgers S, Smith SL, Rowley JD. Dietary bioflavonoids induce cleavage in the MLL gene and may contribute to infant leukemia. Proc Natl Acad Sci USA. 2000;97(9):4790–4795. doi: 10.1073/pnas.070061297. [DOI] [PMC free article] [PubMed] [Google Scholar]
- Strom SS, Yamamura Y, Duphorne CM, Spitz MR, Babaian RJ, Pillow PC, Hursting SD. Phytoestrogen intake and prostate cancer: a case-control study using a new database. Nutr Cancer. 1999;33:20–25. doi: 10.1080/01635589909514743. [DOI] [PubMed] [Google Scholar]
- Takagi H, Shibutani M, Lee KY, Lee HC, Nishihara M, Uneyama C, Takigami S, Mitsumori K, Hirose M. Lack of modifying effects of genistein on disruption of the reproductive system by perinatal dietary exposure to ethinylestradiol in rats. Reprod Toxicol. 2004;18:687–700. doi: 10.1016/j.reprotox.2004.03.002. [DOI] [PubMed] [Google Scholar]
- Takagi H, Shibutani M, Lee KY, Masutomi N, Fujita H, Inoue K, Mitsumori K, Hirose M. Impact of maternal dietary exposure to endocrine-acting chemicals on progesterone receptor expression in microdissected hypothalamic medial preoptic areas of rat offspring. Toxicol Appl Pharmacol. 2005;208:127–136. doi: 10.1016/j.taap.2005.02.002. [DOI] [PubMed] [Google Scholar]
- Thuillier R, Wang Y, Culty M. Prenatal exposure to estrogenic compounds alters the expression pattern of platelet-derived growth factor receptors alpha and beta in neonatal rat testis: identification of gonocytes as targets of estrogen exposure. Biol Reprod. 2003;68:867–880. doi: 10.1095/biolreprod.102.009605. [DOI] [PubMed] [Google Scholar]
- UK Committee on Toxicity. London, UK: Committee on Toxicity of Chemicals in Food, Consumer Products and the Environment; 2003. Phytoestrogens and health. http://www.food.gov.uk/multimedia/pdfs/phytoreport0503. [Google Scholar]
- United Soybean Board. United Soybean Board; 2004. Manufactured Products and Soy. Available at http://www.talksoy.com/FoodIndustry/ManufacturedProducts.htm. [Google Scholar]
- Uppala PT, Roy SK, Tousson A, Barnes S, Uppala GR, Eastmond DA. Induction of cell proliferation, micronuclei and hyperdiploidy/polyploidy in the mammary cells of DDT- and DMBA-treated pubertal rats. Environ Mol Mutagen. 2005;46:43–52. doi: 10.1002/em.20131. [DOI] [PubMed] [Google Scholar]
- US EPA. Recommendations and documentation of biological values for use in risk assessment. Cincinnati, OH: Environmental Criteria and Assessment Office, Office of Health and Environmental Assessment. Office of Research and Development. U.S. Environmental Protection Agency. Report nr EPA/600/6–87/008; 1988. [Google Scholar]
- USDA. United States Department of Agriculture and Iowa State University; 2002. USDA-Iowa State University database on the isoflavone content of food, Release 1.3. Available at http://www.nal.usda.gov/fnic/foodcomp/Data/isoflav/isoflav.html. [Google Scholar]
- Valentín-Blasini L, Sadowski MA, Walden D, Caltabiano L, Needham LL, Barr DB. Urinary phytoestrogen concentrations in the U.S. population (1999–2000) J Expo Anal Environ Epidemiol. 2005;15:509–523. doi: 10.1038/sj.jea.7500429. [DOI] [PubMed] [Google Scholar]
- Wakai K, Egami I, Kato K, Kawamura T, Tamakoshi A, Lin Y, Nakayama T, Wada M, Ohno Y. Dietary intake and sources of isoflavones among Japanese. Nutr Cancer. 1999;33:139–145. doi: 10.1207/S15327914NC330204. [DOI] [PubMed] [Google Scholar]
- Wang XJ, Bartolucci-Page E, Fenton SE, You L. Altered mammary gland development in male rats exposed to genistein and methoxychlor. Toxicol Sci. 2006;91:93–103. doi: 10.1093/toxsci/kfj120. [DOI] [PubMed] [Google Scholar]
- West MC, Anderson LC, McClure N, Lewis SE. Maternal genistein causes no reduction in either litter sizes or sex ratios. Reprod Abstr Ser. 2003;30:72. [Google Scholar]
- Whitehead SA, Cross JE, Burden C, Lacey M. Acute and chronic effects of genistein, tyrphostin and lavendustin A on steroid synthesis in luteinized human granulosa cells. Hum Reprod. 2002;17:589–594. doi: 10.1093/humrep/17.3.589. [DOI] [PubMed] [Google Scholar]
- Whitehead SA, Lacey M. Protein tyrosine kinase activity of lavendustin A and the phytoestrogen genistein on progesterone synthesis in cultured rat ovarian cells. Fertil Steril. 2000;73:613–619. doi: 10.1016/s0015-0282(99)00580-4. [DOI] [PubMed] [Google Scholar]
- Whitten PL, Patisaul HB. Cross-species and interassay comparisons of phytoestrogen action. Environ Health Perspect. 2001;109:5–20. doi: 10.1289/ehp.01109s15. [DOI] [PMC free article] [PubMed] [Google Scholar]
- Williams K, Fisher JS, Turner KJ, McKinnell C, Saunders PT, Sharpe RM. Relationship between expression of sex steroid receptors and structure of the seminal vesicles after neonatal treatment of rats with potent or weak estrogens. Environ Health Perspect. 2001;109:1227–1235. doi: 10.1289/ehp.011091227. [DOI] [PMC free article] [PubMed] [Google Scholar]
- Wisniewski AB, Cernetich A, Gearhart JP, Klein SL. Perinatal exposure to genistein alters reproductive development and aggressive behavior in male mice. Physiol Behav. 2005;84:327–334. doi: 10.1016/j.physbeh.2004.12.008. [DOI] [PubMed] [Google Scholar]
- Wisniewski AB, Klein SL, Lakshmanan Y, Gearhart JP. Exposure to genistein during gestation and lactation demasculinizes the reproductive system in rats. J Urol. 2003;169:1582–1586. doi: 10.1097/01.ju.0000046780.23389.e0. [DOI] [PubMed] [Google Scholar]
- Xu X, Duncan AM, Merz BE, Kurzer MS. Effects of soy isoflavones on estrogen and phytoestrogen metabolism in premenopausal women. Cancer Epidemiol Biomarkers Prev. 1998;7:1101–1108. [PubMed] [Google Scholar]
- Xu X, Wang HJ, Murphy PA, Cook L, Hendrich S. Daidzein is a more bioavailable soy milk isoflavone than is genistein in adult women. J Nutr. 1994;124:825–832. doi: 10.1093/jn/124.6.825. [DOI] [PubMed] [Google Scholar]
- Xu X, Wang HJ, Murphy PA, Hendrich S. Neither background diet nor type of soy food affects short-term isoflavone bioavailability in women. J Nutr. 2000;130:798–801. doi: 10.1093/jn/130.4.798. [DOI] [PubMed] [Google Scholar]
- Yamasaki K, Sawaki M, Noda S, Wada T, Hara T, Takatsuki M. Immature uterotrophic assay of estrogenic compounds in rats given diets of different phytoestrogen content and the ovarian changes with ICI 182,780 or antide. Arch Toxicol. 2002;76:613–620. doi: 10.1007/s00204-002-0383-1. [DOI] [PubMed] [Google Scholar]
- Yang J, Nakagawa H, Tsuta K, Tsubura A. Influence of perinatal genistein exposure on the development of MNU-induced mammary carcinoma in female Sprague-Dawley rats. Cancer Lett. 2000;149:171–179. doi: 10.1016/s0304-3835(99)00357-2. [DOI] [PubMed] [Google Scholar]
- You L, Casanova M, Bartolucci EJ, Fryczynski MW, Dorman DC, Everitt JI, Gaido KW, Ross SM, Heck Hd H. Combined effects of dietary phytoestrogen and synthetic endocrine-active compound on reproductive development in Sprague-Dawley rats: genistein and methoxychlor. Toxicol Sci. 2002a;66:91–104. doi: 10.1093/toxsci/66.1.91. [DOI] [PubMed] [Google Scholar]
- You L, Sar M, Bartolucci EJ, McIntyre BS, Sriperumbudur R. Modulation of mammary gland development in prepubertal male rats exposed to genistein and methoxychlor. Toxicol Sci. 2002b;66:216–225. doi: 10.1093/toxsci/66.2.216. [DOI] [PubMed] [Google Scholar]
- Zhang Y, Song TT, Cunnick JE, Murphy PA, Hendrich S. Daidzein and genistein glucuronides in vitro are weakly estrogenic and activate human natural killer cells at nutritionally relevant concentrations. J Nutr. 1999a;129:399–405. doi: 10.1093/jn/129.2.399. [DOI] [PubMed] [Google Scholar]
- Zhang Y, Wang GJ, Song TT, Murphy PA, Hendrich S. Urinary disposition of the soybean isoflavones daidzein, genistein and glycitein differs among humans with moderate fecal isoflavone degradation activity. J Nutr. 1999b;129:957–962. doi: 10.1093/jn/129.5.957. [DOI] [PubMed] [Google Scholar]