

Abstract
Objective:
To study the anisotropic characteristics of individual histological zones in articular cartilage using Fourier Transform Infrared Imaging (FTIRI) at 6.25 μm pixel resolution.
Method:
A canine humeral cartilage-bone block was paraffin-embedded and microtomed into 6μm sections. Each of the five sections was infrared-imaged twenty-six times with identical acquisition parameters, for a 5° - 10° increment of a wire grid polarizer introduced before the detector in 0° - 180° angular space. Following the infrared imaging experiments, the same tissue sections were also imaged in a Polarized Light Microscope (PLM).
Results:
The infrared absorption components of cartilage (amide I, amide II, amide III, and sugar) exhibit distinctly different anisotropies, which vary differently as a function of the tissue depth. A new type of image, “the absorbance anisotropy map”, was constructed for each major component, which shows that, (1) the absorbance of the amide components in most parts of the tissue is anisotropic, (2) the anisotropic behavior in the radial and the superficial zones of the tissue are opposite, (3) the absorption profile of amide I is inverse to those of amide II and amide III, and (4) the infrared absorption of the sugar component is almost isotropic. The anisotropic variations of the amide components were fitted to an empirical equation.
Conclusions:
The infrared anisotropy map is a powerful tool to monitor the individual chemical components in articular cartilage. The ability to examine the same tissue section using both FTIRI and PLM offers the possibility of correlating the tissue's morphology with chemical distribution.
Keywords: cartilage, collagen, anisotropy, FTIRI, PLM, microscopy, histological zones
Introduction
Covering the load-bearing ends of bones in joints, articular cartilage is highly specialized in its molecular and histological structures by providing a smooth surface for joint motion and cushioning the joint against shock impact. The molecular composition of cartilage consists primarily of water, collagen and proteoglycans [1-3]. Histologically, articular cartilage has unique variations in its morphological structure and molecular composition across its entire depth [4-9], and is comprised of three sub-tissue zones based on the local orientation of collagen fibrils. These three histological zones are (a) the superficial zone (SZ) where collagen is oriented parallel to the articular surface, (b) the transitional zone (TZ) where the collagen is oriented rather randomly, and (c) the radial zone (RZ) where the collagen is oriented perpendicularly to the articular surface (Fig 1a).
Fig 1.

(a) The orientation of the specimen in the FTIRI instrument (not to scale). The cartilage section was mounted on a MirrIR slide, which was secured on the x-y moving stage. SZ, TZ, and RZ refer to three histological zones of articular cartilage: superficial zone, transitional zone, and radial zone respectively.
(b) The relative orientation of amide I and amide II bonds and the long axes of polypeptide chains in collagen fibril.
Studies of articular cartilage and its degradation are motivated by the critical role of cartilage in the development of osteoarthritis (OA), a disease affecting about one third of the adult population [10, 11]. An accurate diagnosis of early OA, however, remains elusive in clinical practice because many changes in tissue's fine structure and delicate chemical / molecular composition proceed significantly prior to the development of OA as a clinical disease. Therefore, any sensitive technique for detecting the early changes in cartilage leading to OA would be valuable for monitoring disease progression and evaluating the efficacy of treatment.
In several of our recent studies of articular cartilage, we have used the gold standard in histology, polarized light microscopy (PLM), to validate the 13.7μm-resolution microscopic magnetic resonance imaging (μMRI) results. Our studies indicate that although neither μMRI nor PLM has the resolution to identify individual macromolecules such as collagen fibrils and proteoglycans, a combined μMRI-PLM study could identify subtle changes in molecular structure and concentration in each individual histological zone in healthy [12], enzymatically degraded [13, 14], naturally lesioned [15], and compressed [16] cartilage quantitatively. However, little information is available regarding the correlation between the physical/morphological parameters of the tissue and the chemical concentrations of the tissue (the changes in the latter are being considered as the earliest signs of tissue degradation, before any noticeable changes in tissue morphology).
Infrared radiation has sufficient energy to cause transitions between the vibrational energy levels of atoms/molecules but not between the electronic levels. This fundamental frequency, whose energy is of order 0.1 eV, is dependent on the bond strength and is also influenced by the neighboring atoms. Infrared (IR) spectroscopy is sensitive to the changes in the dipole moment of the molecules, and has been used to obtain structural information of macromolecules. Incorporating Fourier-transform (FT) IR spectroscopy with 2D imaging (a microscope and a scanning stage), Fourier-transform infrared imaging (FTIRI) can resolve various chemical signatures of a specimen with fine spatial and chemical resolutions. This ability to map the macromolecular components within the tissue is of great importance in cartilage study.
Using FTIRI to sample the polarized infrared spectra at discrete locations of bovine articular cartilage, Camacho et al showed the variations of major infrared absorption bands in different tissue zones [17]. Using bovine nasal cartilage and engineered cartilage from chick sternal chondrocytes, Potter et al used the Euclidean distance and least-squares approaches to verify the molecular specificity in cartilage by FTIR imaging [18]. In addition, studies have been carried out to quantify the chemical concentrations with the infrared absorption in various systems [17, 19, 20] and to gain anisotropy information of cartilage using FTIRI [21-23]. An interesting factor relevant to this study is the angular difference between the transition moments of the infrared vibrations present in cartilage. Since there is a significant difference between the transition moments of amide I (C=O stretching) and amide II (combination of C-N stretch and N-H bending) vibrations [24, 25], they contribute differently to the infrared absorption in cartilage. Consequently, the transition moments of amide I and amide II can be qualitatively considered perpendicular to each other in the context of the collagen axis in cartilage (Fig 1b). This will help to derive the orientational information of collagen fibrils in articular cartilage - the key parameter for histological zone definition and demarcation.
Since the infrared absorption is a sensitive measure of change in dipole moment of the chemical components present in the sample, the FTIRI experiments throw light on collagen fibril orientation and therefore provide a useful picture about the absorption anisotropy of the major molecular constituents/components across the depth of the tissue. In the present FTIRI study, the anisotropic characteristics of four major macromolecular components of interest were investigated through the entire depth of articular cartilage at high spatial resolution (6.25μm square pixel) over the first two quadrants of the angular space (0-180°). In contrast to most previous studies that used cartilage explants (tissue separated from the underlining bone), our specimens include the entire thickness of the articular cartilage and the interface between the cartilage and the underlining bone. In addition, the anisotropy characteristics of the tissue were analyzed at every resolved pixel from the surface to the bone, which provides the complete information of the tissue including the transitions among different histological zones of cartilage.
Methods
Specimen Preparation
A humeral head from a mature canine, which was sacrificed for an unrelated experiment, was used in this study. (This animal came from a source from which we have been studying various cartilage tissues for the last fourteen years.) A rectangular block where the full thickness of the cartilage was still attached to the underlying bone was harvested from the central load-bearing region of the humeral head. (In all of our experiments, we purposely preserve the interface between the soft tissue and the bone, and pay special attention to the specimen's location and orientation on the joint surface to monitor the influence of topographical variations.) Since the infrared spectrum of paraffin does not interfere with the cartilage spectra, standard paraffin histology procedures [12] were used to embed the tissue block. Several thin sections (∼ 6μm thick) were cut from the block and placed on the “MirrIR” slides from Kevley Technologies (Chesterland, Ohio), which enabled us to image the same tissue section using both FTIRI and polarized light microscopy (PLM). No tissue staining was used in the process.
FTIRI Experiments
The FTIR imaging system is a PerkinElmer Spotlight 300 imager (Wellesley, Massachusetts), which consists of a classical FTIR spectrophotometer coupled to an infrared microscope. The microscope has a provision to view/focus the specimen using visible light (Fig 2a), and a moving stage (moves in xyz directions) on which specimen can be mounted. The cartilage sections were placed on MirrIR slides and the images were recorded in the reflection mode. A rectangular region-of-interest (ROI), schematically indicated by the box in Fig 2a, was first selected in the visible image. The infrared imager then scanned the selected tissue section; the time-domain signals (interferograms) were acquired at each pixel location in the ROI and Fourier-transformed into the frequency domain.
Fig 2.
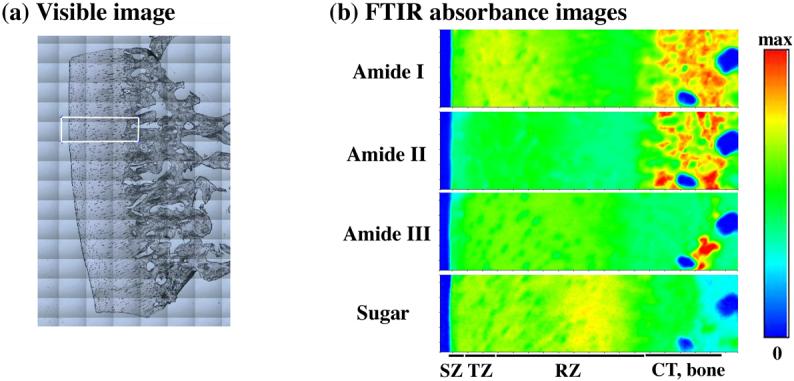
(a) Visible image of a cartilage specimen. The rectangular area (256μm by 981μm) was infrared imaged. (b) Four unpolarized IR absorbance images of the selected area, labeled as amide I, amide II, amide III and sugar. The max absorbance settings for the four images are 0.6, 0.4, 0.15, and 0.1 respectively. The four horizontal bars indicate the approximate locations of the tissue zones (CT, calcified tissue).
In the classical way of discussing polarization of light, the terms ‘polarizer’ and ‘analyzer’ are exclusively used to define (polarize) the state of polarization and to detect (analyze) the state of the polarization respectively, though the two are achieved using identical type of material. In the PerkinElmer Spotlight 300 system, there is only one slot for the polarizer that is between the sample and the detector, and consequently the term “analyzer” is used throughout this manuscript. In all the experiments reported here, a commercial wire grid infrared polarizer from PerkinElmer was used.
Five sections were studied in this report using 8cm−1 spectral step with 2 scans per pixel at the pixel resolution of 6.25 μm. For each specimen, the infrared imaging experiments were repeated twenty-six times with the identical parameters for a 5° - 10° increment of the analyzer angle in the 0° - 180° angular space. At each angle, 6429 individual infrared spectra were acquired from the selected ROI (256μm by 981μm) of the IR image. It took about 3.25 minutes to acquire one image, which was about 10 MBytes in size. The precision of the linear movement of the x-y stage is 1μm, which is small compared to the pixel resolution of the instrument. Finally for analysis, the absorbance images of the specimen in the reflectance mode were calculated by the PerkinElmer software.
PLM Experiment
Following the FTIRI experiments, several of the unstained histological sections were also imaged in a PLM system, which has a 12-bit CCD camera mounted on a Leica polarized light microscope. Circularly polarized light was used with a liquid crystal compensator consisting of two retarders such that the retardance of each could be varied separately under computer control. This allows the compensation of birefringent elements of any orientation without rotation of the specimen or mechanical movement of the optical components in the light path. Consequently, the optical retardance and the angular orientation of collagen fibrils in the tissue can be calculated in two dimensions. The pixel resolution in our PLM system was 2.72 μm at 5x objective. Other experimental details have been documented extensively elsewhere [12].
Data Analysis
A single infrared imaging experiment results in an image data that is three-dimensional: two spatial dimensions (x and y, in length with the unit of microns) and one chemical dimension (z, in wavenumber with the unit of cm−1). At any spatial location (a fixed x and y), one can extract a conventional 1D infrared spectrum. At any chemical location (a fixed wavenumber), one can extract a 2D map of ‘chemical’ distribution (chemi-map). As the spectral region of 2000-800cm−1 has been explored by researchers for articular cartilage [17, 18, 23], the analysis for this report is also carried out in the same spectral region. After performing the baseline correction, the 2D absorption ‘peak-area’ maps were obtained over a range of wavenumber regions (amide I - 1700 to 1600 cm−1, amide II – 1600 to 1500 cm−1, amide III – 1300 to 1200cm−1 and sugar – 1125 to 1000 cm−1). (Note that both amide III and sulfate contribute to the absorption at the spectral region 1300-1200 cm−1 [21]. Since the contribution of sulfate is small compared to amide III, further discussions for this spectral region are referred to amide III.)
Both 2D images and 1D profiles of the cartilage tissue from FTIRI and PLM were used for analysis and presentation. The 2D images enabled us to examine any topographical variation in the images, whereas the 1D profiles enabled us to examine the depth dependency and wavenumber dependency of the results and to compare the profiles from different imaging experiments. To achieve this, eight data pixels along the direction perpendicular to the tissue depth were averaged to enhance the signal-to-noise ratio of these absorption profiles. Since averaging occurs perpendicular to the tissue depth, the pixel resolution along the tissue depth in the 1D profiles is still 6.25 μm. The extraction of profiles was from approximately the same tissue location in all 26 experiments for each section, and the absorption measurements shown in the report were the actual experimental values (with no manual scaling).
Results
Each of the five sections was imaged twenty-six times using identical protocol for different analyzer angles. Since the results from these individual sections were highly consistent, the following analysis was based on one section. (For the amide I component at the 0° analyzer angle, the maximum standard error out of all five sections is 1.1% at the 18.75μm depth, 2.9% at the 81.25μm depth, and 2.0% at the 300μm depth respectively.) Fig 2b shows four 2D maps of IR absorption of the specimen with no analyzer in the instrument. Fig 3 shows the infrared spectra at three spatial locations (one in each histological zone) for 0° and 90° analyzer angles, along with the unpolarized spectra. (Since nearly identical tissues from this source of animals have been studied extensively in our lab for more than 14 years, the thicknesses of the total non-calcified tissue and the tissue's histological zones are approximately known [12].) At the 18.75μm location from the articular surface (in the superficial zone), we observed that the amide I peak at 90° was higher than the same at 0°, and the other two peaks (amide II and amide III) were higher at 0°. At the 81.25μm location (in the transitional zone), there was no big variation for all the peaks for different analyzer angles, indicating the randomness of the fibrils in this zone. At 300μm location (in the radial zone), all major amide peaks behaved exactly the opposite to those in the superficial zone, indicating the perpendicularity of the radial zone fibrils in comparison with the superficial zone fibrils. The spectra acquired for these three zones without the analyzer in the light path are also shown in Fig 3.
Fig 3.
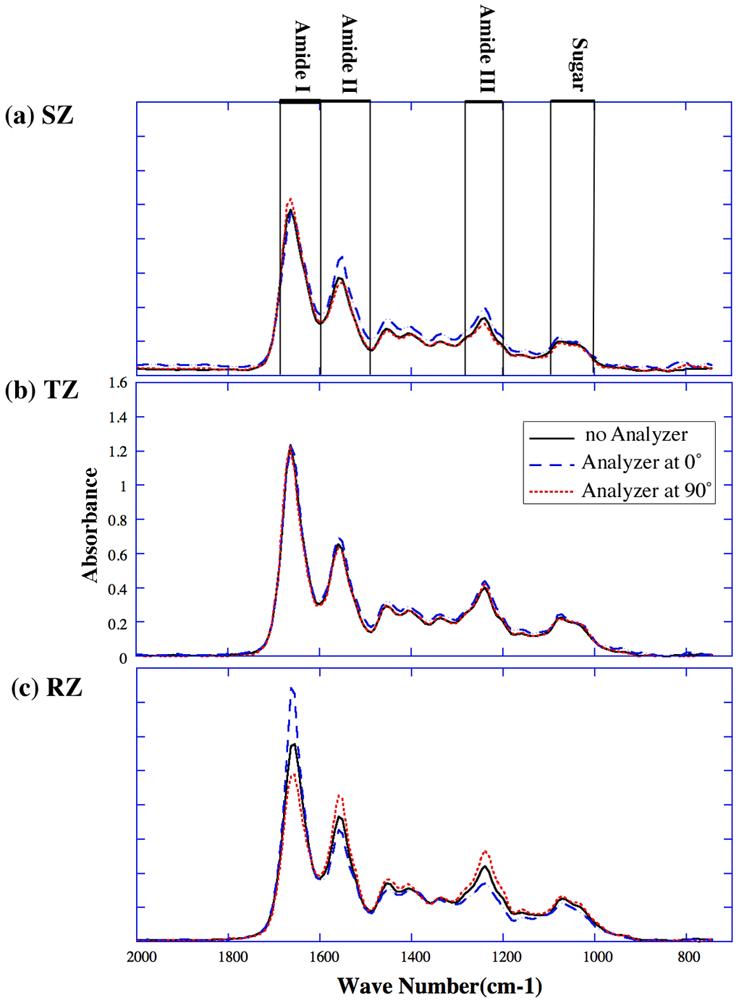
FTIRI spectra at three single pixel locations under different analyzer angles: (a) at 18.75 μm (superficial zone), (b) at 81.25 μm (transitional zone), (c) at 300 μm (radial zone). The solid lines are the spectra obtained without analyzer; the dashed lines are the spectra for analyzer at 0°; and the dotted lines are the spectra for analyzer at 90°. (In this report, unless labeled individually, all spectra were plotted using the same vertical scale within the same figure.)
The absorption profile for amide I, amide II, amide III and sugar across the tissue depth in the first quadrant of the analyzer rotation are shown in Fig 4. (Note that although for each tissue section, there were twenty-six depth profiles for different analyzer angles; only a few profiles are presented in Figure 4 for simplicity.) Since the tissue section was not rotated or moved during the entire experiment, it was straightforward to locate the boundary of the tissue from different imaging experiments and to compare the depth profiles. The figure shows clearly that the infrared absorptions of amide I, amide II, amide III and sugar are all depth-dependent; the first three being anisotropic while the sugar being nearly isotropic. The profiles of these components at 180° analyzer angle (not shown) are identical to that at 0° analyzer angle.
Fig 4.
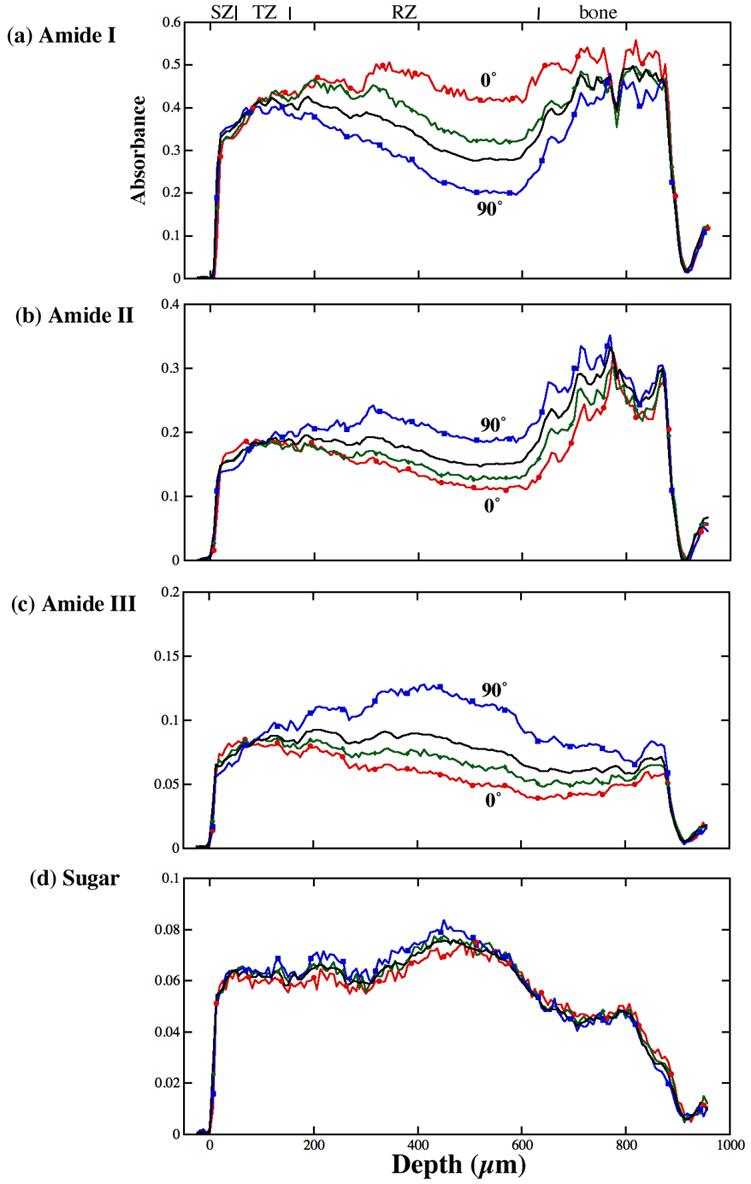
The profiles of different FTIR images through the tissue depth for different analyzer angles: (a) amide I, (b) amide II, (c) amide III and (d) sugar. The solid black lines are the profiles for the unpolarized light, the red lines are for the 0° polarization, the green lines are for the 30° polarization and the blue lines are for the 90° polarization. The non-calcified tissue is from 0μm to about 650μm.
We combined all absorption profiles for each component into a new type of 2D map (Fig 5), where each row was one absorption profile as a function of the tissue depth at a fixed angle (Fig 4), and each column was a plot of absorbance versus the analyzer angle for the sample (Fig 6). We term this 2D image as “the absorbance anisotropy map” and the 1D column-plot as “the absorbance anisotropy cross-section” (which is depth-dependent). These types of anisotropy maps and cross-sections have the ability to summarize the massive amount of anisotropic information from all twenty-six images by graphically illustrating any periodic modulation of the infrared absorption in the specimen.
Fig 5.
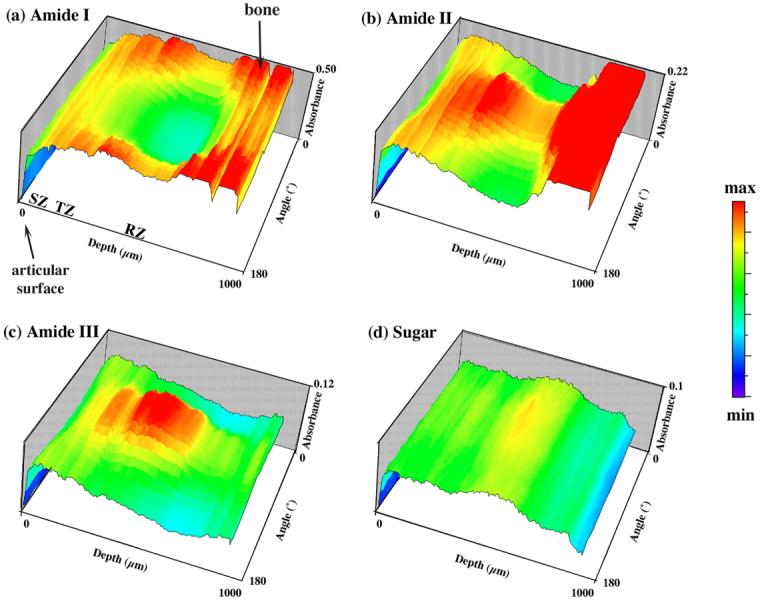
FTIRI absorbance anisotropy maps: (a) amide I, (b) amide II, (c) amide III and (d) sugar. These maps enable the visualization and summary of the distributions of IR anisotropy at every tissue depth over the angle space of 0° - 180°. At any particular angle, the profile shows the IR absorption over the entire tissue depth (the profiles in Fig 4); while at a particular depth, the profile shows the anisotropy of the IR absorption over the 0°-180° angle space (the profiles in Fig 6). (0 μm is the articular surface and 1000 μm is the bone region.)
Fig 6.
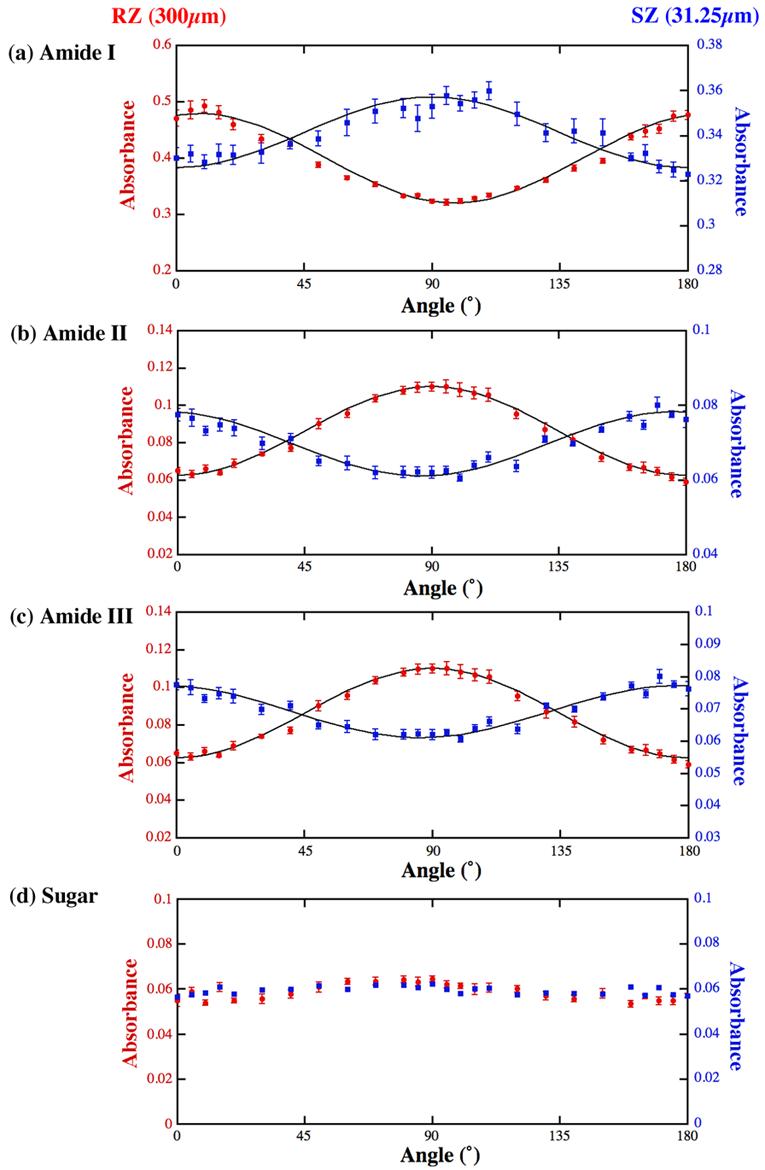
FTIRI anisotropy cross-sections of amide I (a), amide II (b), amide III (c) and sugar (d) at one depth in the superficial zone (31.25μm) and one depth in the radial zone (300μm). The left margins with the solid circles represent the radial zone anisotropy, and the right margins with the solid squares represent the superficial zone anisotropy. The solid lines are from the Equation 1 (see text for discussion). The error bars are the standard errors from the 8 individual columns of data.
These absorbance anisotropy maps were closely examined for each of the four components of interest, profile by profile (Fig 6) along the tissue depth at a 6.25-μm increment. The following are the summarized features. (1) From the surface of the tissue (set as 0μm) until about 81.25 - 87.5μm, the absorbance anisotropies of amide I, amide II and amide III are sinusoidal. The typical profile at the 31.25μm depth is shown in the right vertical scale in Fig 6. The anisotropy of such profiles gets weaker and weaker as one moves towards the 81.25 - 87.5μm depth, and reaches a minimum at the 81.25 - 87.5μm depth. (2) Going deep into the tissue from the 81.25 - 87.5μm depth, the absorbance anisotropies of amide I, amide II and amide III gradually become sinusoidal again and get stronger when one moves deep into the radial zone of the tissue. The typical profile at the 300μm depth is shown in the left vertical scale in Fig 6. A distinct difference between the characteristics in the surface to the deep tissues is that the sinusoidal features of the deep zone tissue are inverse to those of the surface zone tissue. (3) The sugar shows no periodic variations for different analyzer angles (Fig 6d).
A close examination of these anisotropic cross-sections at different tissue depth (Fig 6) revealed that the infrared absorbance in articular cartilage exhibited quite complex variations for different histological zones. Since these variations seemed sinusoidal, we used the following equation to model the anisotropy of the tissue absorbance:
| (1) |
This equation resembles Malus's Law of polarized light. Absorbance(r, θ) emphasizes that the tissue absorbance is a depth dependent and angle dependent variable, A(r) and A0(r) are two depth-dependent scaling parameters, and θ0(r) is the parameter that accounts for the angular offset which is also depth dependent (with reference to the center of our angular space at 90°). Using this simple equation, we have fitted the three components (amide I, amide II and amide III) in both the radial and the superficial zones, shown as the solid lines in Fig 6. A parameter of interest in the curve fitting is θ0(r), which is a variable that depends upon the tissue depth. At the 300μm location (the radial zone) θ0 was −8° for amide I and −2° for amide II bonds; and at the 31.25μm (the superficial zone), θ0 was −4° for amide I and +4° for amide II bonds.
Following the FTIRI experiments, several cartilage sections were imaged sequentially using a PLM system, where each section had two quantitative images: the angle map and the retardation map. The retardation image illustrates the fibril organization within each pixel based on birefringence (the value 0 means the fibers are random and the value high means a higher order of organization), whereas the angle image represents the averaged orientation of the collagen fibers in the pixel (there is an approximate 90° difference between the collagen fibril orientations in the superficial zone and radial zone of mature/healthy cartilage). This procedure has been used extensively in our lab to study healthy and lesioned cartilage [12, 15, 26]. Fig 7a shows the angle and retardation images from one PLM experiment, which has features consistent with several of our previous μMRI/PLM correlation studies [12, 15, 26]. The vertical lines in the profiles of Fig 7b represent the approximate divisions of three histological zones, based on our published PLM criteria using similar tissues from this source of animals [12].
Fig 7.
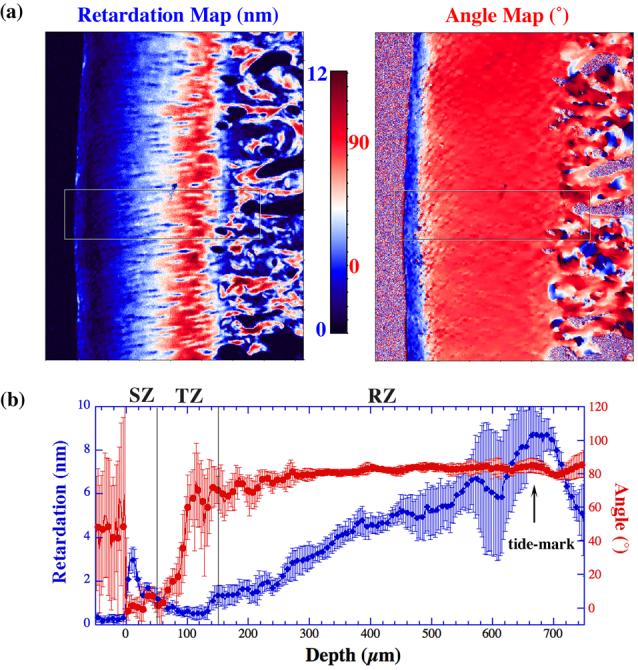
The angle and retardation maps (a) of a specimen from one PLM experiment. A small section of the rectangular box was analyzed and plotted as the cross-sectional profiles (b). The two vertical lines indicate the approximate division of the histological zones in the tissue. The error bars in the plots indicate the standard deviation of the angle and retardation profiles.
To facilitate the comparison between the physical/morphological features of the tissue and the chemical distributions in cartilage, the complex information in the depth-dependent anisotropy profiles (Fig 6) needs to be further analyzed. To that end, we explored the statistical variation of the anisotropy profiles (Fig 6) by taking the standard deviation of the amide I anisotropic profile at each pixel depth – a big/small standard deviation means a large/small sinusoidal variation in its anisotropic profile at that particular tissue depth. Fig 8 compares the PLM retardation profile (Fig 7b) and the standard deviation of the amide I anisotropy based on the same tissue section - many common features of these two profiles have a surprisingly good agreement. The anisotropy profiles of the standard deviation of amide II and amide III (not shown) contain several features that are common to that of amide I, while the profile of sugar lacks these features.
Fig 8.
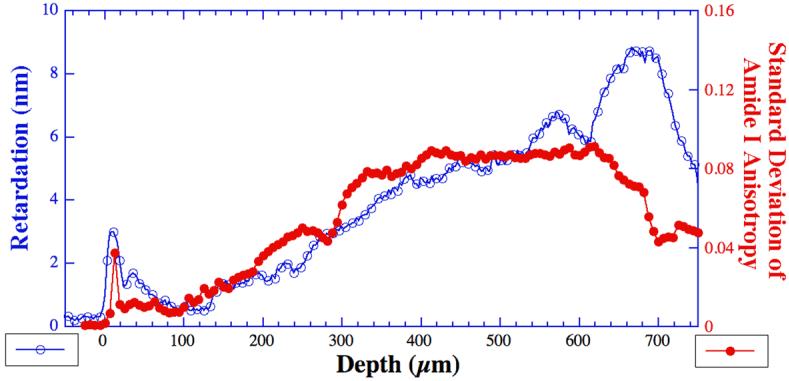
The comparison of the retardation profile of the tissue (open circles) and the standard deviation of the amide I component anisotropy (solid dots) at every pixel location. Each value of the standard deviation measures the absorption variation of the amide I component under different analyzer angles within the angular space of 0-180° (Fig 6) at a particular tissue depth, and is calculated by the commercial program KaleidaGraph (Synergy Software, Reading, PA).
Discussion
Considering the unique structure of articular cartilage, there are three important requirements for any morphological study of this tissue. Firstly, since the cartilage tissue has a fibril structure with significant depth-dependent heterogeneity, the study must be done in imaging mode. Secondly, because of the thinness of the cartilage tissue (several millimeters at most in human) and the existence of different histological zones [26], the imaging experiments must have a high spatial resolution. Lastly, since the individual absorbance peaks in any infrared spectrum could be influenced by some experimental factors such as the variation of the section thickness [27], to unambiguously deduce tissue ultrastructure from the images, one must obtain these images at multiple specimen orientations, and then consider only the angular dependent features. This study is the first FTIRI investigation of the angular dependence of infrared absorbance over the entire depth of articular cartilage in the 180° orientational space at microscopic resolution.
It is obvious from Figures 4, 5 and 6 that the absorbance anisotropy profiles of amide I and amide II are opposite, which shows the molecular arrangement in the tissue. Since the dipole moment of a component is associated with its transition moment, it is possible to describe the anisotropic nature of the components in the FTIR spatial map. The anisotropy profiles of amide I, amide II and amide III in the superficial zone are inverse to those in radial zone, which ensures the perpendicular arrangement of collagen fibers in these zones. The perpendicular arrangement of amide I and amide II vibrations in both the superficial and radial zones can be observed by the 90° phase shift in their respective anisotropy profiles. Also, the parallel arrangement of amide II and amide III vibrations may be concluded from their in-phase anisotropy profiles. The isotropic nature of the sugar component implies the lack of anisotropy.
The experimental issues in polarized cartilage study using FTIRI
In the study of tissue anisotropy under infrared microscopy, one needs to define a set of experimental orientations relative to each other, which starts with fixing the zero angle reading of the insertable analyzer that defines the 0° analyzer angle in the angular space (Fig 1a). Since the fibril architecture in articular cartilage is known to have a depth-dependent variation and as the directions of the two major IR components (amide I and amide II) are known to have approximately 90° orientational difference, changing the orientation of the sample will change the outcome of the results with respect to the infrared absorption of these bands. In our experiments, we paid special attention to the orientation of the specimen on the x-y moving stage, regardless of the relative orientation of the specimen on the slide. Since each specimen was firmly fixed during the entire experiment, once the tissue boundary was defined, it was rather uncomplicated to compare the features in the different depth-dependent profiles, which came from independent imaging experiments.
The origin of the infrared anisotropy in different histological zones of articular cartilage
The origin of the infrared absorbance anisotropy in articular cartilage must stem from the molecular and morphological structure of the tissue, which in essence is defined by the orientation of the collagen matrix in articular cartilage (Fig 1a). As the transition moments of amide I and amide II can be considered perpendicular to each other in the context of collagen fibril axis in cartilage (Fig 1b), and because the directions of the surface fibrils and the deep fibrils have a 90° orientational difference, the anisotropic profiles of amide I and amide II are inverse and sinusoidal both in the surface and the radial zones (the left and right vertical axes in Fig 6). Not surprisingly, since the amide III (centered around 1250 cm−1 from the N-H and C-C vibrations) also has its orientation along the fiber axis (parallel to amide II) [21], it exhibits similar anisotropic behavior as that of the amide II. We have also found that the sugar from proteoglycans in cartilage to be isotropic across the depth of the tissue, which conforms with the general notion that it is mainly the collagen fibril orientation that defines the structure of articular cartilage.
In this work, we also found the tissue depth around 81.25-87.5μm to be the most isotropic location in the tissue for infrared absorption. In our previous micro-imaging work using the canine humeral cartilage (from the same source), we have shown that the thicknesses of the three histological zones are about 50μm, 100μm, and 480μm for cartilage in the central load-bearing area of the humerus, and that the most isotropic location of the transitional zone in terms of birefringence to be the mid of the transitional zone (∼ 100μm from the articular surface) [12, 26]. This cross-modality agreement of FTIRI with PLM once again validates the conclusions in the MRI studies of soft tissue (cartilage and tendons) [26, 28-30], and demonstrates the importance of multidisciplinary imaging studies of biological tissues.
Regarding the modeling of the infrared anisotropy in cartilage, it is of interest that in the work of Bi et al [23], the occurrence of the maxima and minima for the ratio of integrated amide I/II area ratios of tendon collagen also has an offset of 10° - 15°, which is comparable to our modeled value of 8° in the radial zone of cartilage (note that our data are not the amide ratio). Since very different specimen and parameters were used in both studies, this offset is unlikely to be something as trivial as the physical orientation of the tissue sections. Is this angular offset related to the relative orientation of the amide I/II vibrations with regard to the long axis of the collagen fibril? Future studies are needed to address this issue.
The meaning of the standard deviation of the anisotropic profile in FTIRI
In Fig 8, we showed that the standard deviation plot for the infrared anisotropy cross-sections in articular cartilage had distinct features that are similar to the retardation profiles from PLM. Let us now consider the physical meaning of these two quantities. In PLM, the retardation measures the birefringence in the tissue, which is influenced by several factors like the randomness of the collagen fibrils, the fibril diameter, the packing density of the fibrils and the thickness of the histological section. For a single tissue section, a smaller retardation value generally indicates that the collagen fibrils are less ordered; hence, the minimum retardation indicates the least ordered location of the collagen fibers in the tissue [12]. In the past, we have correlated the minimum of the retardation in PLM with the maximum of the T2 anisotropy from μMRI. Although μMRI measures the direction of collagen fibrils indirectly based on the anisotropic mobility of water molecules due to their association with the nearby (less mobile) macromolecules whereas the polarized (visible) light microscopy measures the tissue structure indirectly via the optical birefringence, these two unique parameters have proved to be statistically consistent [26].
In this work, the infrared anisotropy profiles at each tissue depth display the intensity variation of the chosen component as a function of the analyzer angle (Fig 6). For any isotropic material, the absorbance intensity would vary very little for various analyzer angles, which will result in a small value in the standard deviation calculation. On the contrary, if a particular profile is infrared anisotropic, the absorbance intensity will vary upon polarization, resulting in a large standard deviation. The standard deviation of the anisotropy profiles therefore measures numerically the variation of the chemical component due to the infrared polarization and is an indirect parameter for the collagen fibril randomness. The close resemblance of the two profiles (Fig 8) is therefore not fortuitous. A statistical correlation between the features of these two cross-disciplinary quantities requires further quantitative work that takes into accounts for all experimental factors.
Final Remarks
In conclusion, we have investigated the infrared absorbance anisotropy of various molecular constituents pertaining to the extracellular matrix components in articular cartilage at microscopic resolution. Although FTIRI does not have the resolution to identify individual collagen fibrils, we show that a new type of quantitative image (the infrared absorbance anisotropy map and its anisotropy cross sections) together can reveal the angular-dependent variations in the tissue by eliminating other biochemical and instrumental factors contributing to the variation in infrared absorbance images. We further show that FTIRI has the potential to provide critical insights into the ultrastructure of macromolecules in articular cartilage (and other biological tissues) containing organized fibrils. Since it is feasible to correlate the infrared absorbance with a chemical concentration using Beer's law [31], to do both FTIRI and PLM using the same tissue section (this report), and to correlate PLM with μMRI [12], this report demonstrates the potential to associate the physical/morphological features from μMRI/PLM images with the chemical images from FTIRI, which may help in better understanding of the earliest degradations in articular cartilage before it becomes a clinical disease.
Acknowledgements
YX thanks the following funding sources: Research Excellence Fund in Biotechnology from Oakland University, an instrument endorsement from R.B. and J.N. Bennett, and a R01 grant (AR 45172) from NIH. The authors are grateful to the Lab of Dr George Lust and (late) Dr Nancy Burton-Wurster (Baker Institute, Cornell University, Ithaca, NY) for providing the canine joints, to Mr Farid Badar (Department of Physics, Oakland University) for assistance in data analysis and discussions, and to Dr Brad Roth (Department of Physics, Oakland University) for critical comments on the manuscript.
Footnotes
Publisher's Disclaimer: This is a PDF file of an unedited manuscript that has been accepted for publication. As a service to our customers we are providing this early version of the manuscript. The manuscript will undergo copyediting, typesetting, and review of the resulting proof before it is published in its final citable form. Please note that during the production process errors may be discovered which could affect the content, and all legal disclaimers that apply to the journal pertain.
References
- 1.Maroudas A. Biophysical chemistry of cartilaginous tissues with special reference to solute and fluid transport. Biorheology. 1975;12:233–248. doi: 10.3233/bir-1975-123-416. [DOI] [PubMed] [Google Scholar]
- 2.Venn M, Maroudas A. Chemical composition and swelling of normal and osteoarthritic femoral head cartilage. Annals of Rheumatic Diseases. 1977;36(2):121–129. doi: 10.1136/ard.36.2.121. [DOI] [PMC free article] [PubMed] [Google Scholar]
- 3.Maroudas A, Bayliss MT, Venn M. Further studies on the composition of human femoral head cartilage. Annals of Rheumatic Diseases. 1980;39(5):514–534. doi: 10.1136/ard.39.5.514. [DOI] [PMC free article] [PubMed] [Google Scholar]
- 4.Clarke IC. Articular cartilage: A review and scanning electron microscope study. Journal of Bone Joint Surgery. 1971;53 B(4):732–750. [PubMed] [Google Scholar]
- 5.Bayliss M, Venn M, Maroudas A, Ali SY. Structure of proteoglycans from different layers of human articular cartialge. Biochemical Journal. 1983;209:387–400. doi: 10.1042/bj2090387. [DOI] [PMC free article] [PubMed] [Google Scholar]
- 6.Maroudas A, Wachtel EJ, Grushko G, Katz EP, Weinberg P. The effect of osmotic and mechanical pressures on water partitioning in articular cartilage. Biochimica et Biophysica Acta. 1991;1073:285–294. doi: 10.1016/0304-4165(91)90133-2. [DOI] [PubMed] [Google Scholar]
- 7.Miosge N, Flachsbart K, Goetz W, Schultz W, Kresse H, Herken R. Light and electron microscopical immunohistochemical localization of the small proteoglycan core proteins decorin and biglycan in human knee joint cartilage. Histochemical Journal. 1994;26(12):939–945. [PubMed] [Google Scholar]
- 8.Xia Y. Magic Angle Effect in MRI of Articular Cartilage - A Review. Investigative Radiology. 2000;35(10):602–621. doi: 10.1097/00004424-200010000-00007. [DOI] [PubMed] [Google Scholar]
- 9.Mow VC, Guo XE. Mechano-electrochemical properties of articular cartilage: their inhomogeneities and anisotropies. Annual Review of Biomedical Engineering. 2002;4:175–209. doi: 10.1146/annurev.bioeng.4.110701.120309. [DOI] [PubMed] [Google Scholar]
- 10.A press release of the Centers for Disease Control and Prevention (October 24, 2002).
- 11.A report of the Shanghai Health Bureau, Shanghai Daily (October 17, 2001).
- 12.Xia Y, Moody J, Burton-Wurster N, Lust G. Quantitative In Situ Correlation Between Microscopic MRI and Polarized Light Microscopy Studies of Articular Cartilage. Osteoarthritis and Cartilage. 2001;9(5):393–406. doi: 10.1053/joca.2000.0405. [DOI] [PubMed] [Google Scholar]
- 13.Xia Y, Farquhar T, Burton-Wurster N, Vernier-Singer M, Lust G, Jelinski LW. Self-Diffusion Monitors Degraded Cartilage. Archives of Biochemistry and Biophysics. 1995;323(2):323–328. doi: 10.1006/abbi.1995.9958. [DOI] [PubMed] [Google Scholar]
- 14.Moody JB, Xia Y, Alhadlaq H, Burton-Wurster N, Lust G. Changes in T2 Relaxation Anisotropy of Ovine Articular Cartilage After Enzymatic Depletion of Proteoglycan; The 49th Meeting of Orthopaedic Research Society (ORS); New Orleans. February 2-5, 2003.2003. [Google Scholar]
- 15.Alhadlaq H, Xia Y, Moody JB, Matyas J. Detecting Structural Changes in Early Experimental Osteoarthritis of Tibial Cartilage by Microscopic MRI and Polarized Light Microscopy. Annals of Rheumatic Diseases. 2004;63(6):709–717. doi: 10.1136/ard.2003.011783. [DOI] [PMC free article] [PubMed] [Google Scholar]
- 16.Alhadlaq H, Xia Y. The Structural Adaptations in Compressed Articular Cartilage by Microscopic MRI (μMRI) T2 Anisotropy. Osteoarthritis and Cartilage. 2004;12(11):887–894. doi: 10.1016/j.joca.2004.07.006. [DOI] [PubMed] [Google Scholar]
- 17.Camacho NP, West P, Torzilli PA, Mendelsohn R. FTIR microscopic imaging of collagen and proteoglycan in bovine cartilage. Biopolymers. 2001;62(1):1–8. doi: 10.1002/1097-0282(2001)62:1<1::AID-BIP10>3.0.CO;2-O. [DOI] [PubMed] [Google Scholar]
- 18.Potter K, Kidder LH, Levin IW, Lewis EN, Spencer RG. Imaging of collagen and proteoglycan in cartilage sections using Fourier transform infrared spectral imaging. Arthritis and Rheumtism. 2001;44(4):846–855. doi: 10.1002/1529-0131(200104)44:4<846::AID-ANR141>3.0.CO;2-E. [DOI] [PubMed] [Google Scholar]
- 19.David-Vaudey E, Burghardt A, Keshari K, Brouchet A, Ries M, Majumdar S. Fourier Transform Infrared Imaging of focal lesions in human osteoarthritic cartilage. European Cells and Materials Journal. 2005;10:51–60. doi: 10.22203/ecm.v010a06. discussion 60. [DOI] [PubMed] [Google Scholar]
- 20.Kim M, Bi X, Horton WE, Spencer RG, Camacho NP. Fourier transform infrared imaging spectroscopic analysis of tissue engineered cartilage: histologic and biochemical correlations. Journal of Biomedical Optics. 2005;10(3) doi: 10.1117/1.1922329. 031105. [DOI] [PubMed] [Google Scholar]
- 21.Gadaleta SJ, Landis WJ, Boskey AL, Mendelsohn R. Polarized FT-IR microscopy of calcified turkey leg tendon. Connective Tissue Research. 1996;34(3):203–211. doi: 10.3109/03008209609000699. [DOI] [PubMed] [Google Scholar]
- 22.Coats AM, Hukins DW, Imrie CT, Aspden RM. Polarization artifacts of an FTIR microscope and the consequences for intensity measurements on anisotropic materials. Journal of Microscopy. 2003;211(Pt 1):63–66. doi: 10.1046/j.1365-2818.2003.01198.x. [DOI] [PubMed] [Google Scholar]
- 23.Bi X, Li G, Doty SB, Camacho NP. A novel method for determination of collagen orientation in cartilage by Fourier transform infrared imaging spectroscopy (FT-IRIS) Osteoarthritis and Cartilage. 2005;13(12):1050–1058. doi: 10.1016/j.joca.2005.07.008. [DOI] [PubMed] [Google Scholar]
- 24.Fraser RD. The interpretation of infrared dichroism in fibrous protein structures. Journal of Chemical Physics. 1953;21(9):1511–1515. [Google Scholar]
- 25.Marsh D, Muller M, Schmitt FJ. Orientation of the infrared transition moments for an alpha-helix. Biophysics Journal. 2000;78(5):2499–2510. doi: 10.1016/S0006-3495(00)76795-6. [DOI] [PMC free article] [PubMed] [Google Scholar]
- 26.Xia Y, Moody J, Alhadlaq H, Burton-Wurster N, Lust G. Characteristics of Topographical Heterogeneity of Articular Cartilage over the Joint Surface of a Humeral Head. Osteoarthritis and Cartilage. 2002;10(5):370–380. doi: 10.1053/joca.2002.0523. [DOI] [PubMed] [Google Scholar]
- 27.Rieppo J, Hyttinen MM, Jurvelin JS, Helminen HJ. Reference sample method reduces the error caused by variable cryosection thickness in Fourier transform infrared imaging. Applied Spectroscopy. 2004;58(1):137–140. doi: 10.1366/000370204322729577. [DOI] [PubMed] [Google Scholar]
- 28.Fullerton GD, Cameron IL, Ord VA. Orientation of tendons in the magnetic field and its effect on T2 relaxation times. Radiology. 1985;155:433–435. doi: 10.1148/radiology.155.2.3983395. [DOI] [PubMed] [Google Scholar]
- 29.Peto S, Gillis P, Henri VP. Structure and dynamics of water in tendon from NMR relaxation measurements. Biophysics Journal. 1990;57(1):71–84. doi: 10.1016/S0006-3495(90)82508-X. [DOI] [PMC free article] [PubMed] [Google Scholar]
- 30.Henkelman RM, Stanisz GJ, Kim JK, Bronskill MJ. Anisotropy of NMR properties of tissues. Magnetic Resonance in Medicine. 1994;32:592–601. doi: 10.1002/mrm.1910320508. [DOI] [PubMed] [Google Scholar]
- 31.Workman JJ, Springsteen AW. Applied Spectroscopy: A compact reference for practitioners. Academic Press; Chestnut Hill, MA: 1998. pp. 3–28. [Google Scholar]