

Abstract
Benzo(a)pyrene (BaP) is a known human carcinogen and a suspected breast cancer complete carcinogen. BaP is metabolized by several metabolic pathways, some having bioactivation and others detoxification properties. BaP-quinones (BPQs) are formed via cytochrome P450 and peroxidase dependent pathways. Previous studies by our laboratory have shown that BPQs have significant growth promoting and anti-apoptotic activities in human MCF-10A mammary epithelial cells examined in vitro. Previous results suggest that BPQs act via redox-cycling and oxidative stress. However, because two specific BPQs (1,6-BPQ and 3,6-BPQ) differed in their ability to produce reactive oxygen species (ROS) and yet both had strong proliferative and EGF receptor activating activity, we utilized mRNA expression arrays and qRT-PCR to determine potential pathways and mechanisms of gene activation. The results of the present studies demonstrated that 1,6-BPQ and 3,6-BPQ activate dioxin response elements (DRE, also known as xenobiotic response elements, XRE) and anti-oxidant response elements (ARE, also known and electrophile response elements, EpRE). 3,6-BPQ had greater DRE activity than 1,6-BPQ, whereas the opposite was true for the activation of ARE. Both 3,6-BPQ and 1,6-BPQ induced oxidative stress associated genes (HMOX1, GCLC, GCLM, and SLC7A11), phase 2 enzyme genes (NQO1, NQO2, ALDH3A1) PAH metabolizing genes (CYP1B1, EPHX1, AKR1C1), and certain EGF receptor associated genes (EGFR, IER3, ING1, SQSTM1 and TRIM16). The results of these studies demonstrate that BPQs activate numerous pathways in human mammary epithelial cells associated with increased cell growth and survival that may play important roles in tumor promotion.
INTRODUCTION
Polycyclic aromatic hydrocarbons (PAHs), such as benzo(a)pyrene (BaP) and 7,12-dimethylbenz(a)anthracene (DMBA), are well known complete carcinogens that produce skin cancer, lung cancer, and lymphoma in rodents and other species (Pelkonen and Nebert, 1982). In rodents, mammary cancer is produced by 7,12-dimethylbenz(a)anthracene (DMBA) (Ethier and Ullrich, 1982; Russo and Russo, 1996). BaP has recently been categorized by the International Agency for Research on Cancer (IARC) as a Group 1 carcinogen indicating that it is a known human carcinogen (Straif et al., 2005; IARC 2006). Environmental PAHs are associated with cancers and alterations in biomarkers of exposure (Farmer et al., 2003). The role of environmental PAHs in human breast cancer is uncertain. BaP has been found to transform human mammary cell lines in vitro (Balogh et al, 2006). While bulky PAH adducts can be detected in mammary tissues of exposed individuals, there has not an established epidemiologic connection between PAH exposure and human breast cancer (Gammon et al., 2002). Cigarette smoke, which contains PAHs and other substances, may present a slight increased risk for breast cancer (Egan et al., 2002). Combined PAH and solvent exposures have also been associated with an increased risk for human breast cancer (Brody and Rudel, 2003).
As a complete carcinogen, BaP is capable of both tumor initiation via genotoxic actions on DNA as well as tumor promotion through non-genotoxic signaling pathways (Luch et al, 2005). Mechanistic studies demonstrate that BaP metabolism is important for its tumor-initiating properties. Benzo(a)pyrene-7,8-diol-9,10-epoxide (BPDE I or [+] anti-BPDE) is an important metabolite formed by the metabolism of BaP by cytochrome P450s (CYP1A1, CYP1A2, and CYP1B1) and epoxide hydrolase (EPHX1). BPDE binds to DNA leading to mutations (G → T transversions) and tumor initiation (Conney et al, 2001). DMBA initiates ovarian cancer, skin cancer, and lymphoma via a CYP1B1-dependent process (Buters et al., 2003). Because we know that CYP1B1 and CYP1A1 are also expressed in mammary epithelial cells (Spink et al., 1998; Keshava et al., 2005), and in vitro experiments with normal human mammary epithelial cells and cell lines have shown that PAHs are bioactivated in vitro (Stampfer et al., 1981; Bartley et al., 1982; Bartley and Stampfer, 1985; Pruess-Schwartz et al., 1986), this bioactivation could also occur in the breast. There are however important species differences between rodents and humans for the bioactivation and metabolism of PAHs (Moore et al., 1986; Christou et al., 1987) and it is therefore important to examine PAH effects in relevant human systems.
An important series of metabolites of BaP that have been somewhat understudied for biologic effects are the BaP-quinones (BPQs). BPQs (1,6-BPQ, 3,6-BPQ, and 6,12-BPQ) are formed by CYPs of the 1A and 1B family (Shimada et al, 2001; Shimada and Guengerich, 2006) as well as by peroxidases via radical cations (Cavaleri et al, 1998), and by UV light (Reed et al., 2003). A 7,8-orthoquinone of BaP is formed from the 7,8-dihydrodiol of BaP by the AKR1C1 enzyme (Jin and Penning, 2006). The tumor initiating and DNA-binding activities of BPQs have previously been reported (Moorthy et al., 2002; Balu et al., 2004). Some BPQs activate signaling pathways in cells via binding to Ah receptors (Burczynski and Penning, 2000). Thus, BPQs have both genotoxic and non-genotoxic properties.
BPQs are also redox-cycling agents and have been shown to produce oxidative stress in cells and mitochondrial dysfunction (Zhu et al., 1995; Bolton et al., 2000). We have recently shown that BPQs produce reactive oxygen species (ROS), and more specifically superoxide anion, in human mammary epithelial cells (Burdick et al. 2003, Shi et al., 2005). The production of ROS was associated with activation of epidermal growth factor receptor (EGFR) signaling pathways leading to increased cell proliferation of human mammary epithelial cells (Burdick et al., 2003). In our studies, while both 1,6-BPQ and 3,6-BPQs activated EGFR and downstream signaling pathways, 1,6-BPQ produced significantly more ROS production than did 3,6-BPQ. If ROS production is not the critical mechanism associated with modulation of proliferative and anti-apoptotic pathways, we were interested in examining alternative pathways. Gene array analysis has recently proved useful in an assessment of PAH effects on target cells (Bartosiewicz et al., 2001; Keshava et al., 2005). Therefore the purpose of the present studies was to examine the mRNA induction profiles obtained with a MCF-10A human mammary epithelial cell model system of EGFR signaling using gene expression arrays and quantitative PCR. We compared the effects of 1,6-BPQ with 3,6-BPQ for the induction of approximately 22,000 human genes and found that the top induced genes (as measured by fold change) were associated with both dioxin response elements (DREs) and anti-oxidant response elements (AREs).
METHODS
Chemicals and reagents
All chemicals were purchased from Sigma (St Louis, MO), unless otherwise indicated. 1,6-BPQ and 3,6-BPQ were purchased from Midwest Research Institute (Kansas City, MO, USA) at >99% purity and maintained as a stock solution in anhydrous tissue culture grade dimethyl sulfoxide (DMSO) and stored at −20°C. Preparation of PAHs and cell culture treatments were carried out under low ambient lighting. The final concentration of DMSO in all experiments was 0.1%.
MCF-10A cell culture and treatments
MCF-10A cells are a spontaneously immortalized and growth factor-dependent mammary epithelial cell line that is grown on a Type I collagen - coated (PureCol™ Inamed Biomaterials, Fremont, CA) 100 × 20 mm dishes (Corning Glass, Corning, NY, USA) in serum-free, growth factor-defined media at 10% CO2 and 37°C, as described elsewhere (Davis, JW 2000; Burdick et al., 2003). For treatments, MCF-10A cells, passage 42, were plated into nine 100 mm dishes at 3.5 × 10⁵ cells per dish in 5 ml SFIHE (serum free media containing growth factors insulin, hydrocortisone epidermal growth factor) with 2% FBS, after 24 hours the media was removed and fresh SFIHE was added. On day 5 media was removed and cells were placed in serum free media containing hydrocortisone (SFH) and was without growth factors for approximately 24 hours, media was then replaced with treatment media in SFH. Treatments were run in triplicate at 1μM 1,6-BPQ and 3,6-BPQ and DMSO served as the vehicle control all treatments contained 0.1% DMSO. Cells remained in treatment media for 18 hours and were then harvested by trypsinization and like treatments were combined.
Transient Transfection Reporter Analysis
Transfection of MCF10A cells was performed in 12-well tissue culture plates using the FuGene 6 Transfection Reagent (Roche Diagnostics, Indianapolis, IN) according to manufacturer’s instructions. Exposure to quinones was performed as specified, 24 hr after transfection. Normalization of transfection efficiency was performed using Renilla luciferase activity from the pRL-TK vector (Promega, Madison, WI), which was cotransfected with the response element reporter vectors. The Renilla Luciferase Assay Lysis Buffer (Promega) was used to acquire extracts for luciferase activity 72 hr after transfection. Renilla luciferase and firefly luciferase activities were determined using the Renilla Luciferase Assay System (Promega) and the Luciferase Assay System (Promega) according to assay instructions on a TD-20/20 Luminometer (Turner Designs Instruments, Sunnyvale, CA). To determine activation of the ARE, transfections were performed using pNQO1hARE vector (Moinova and Mulcahy, JBC, 1998). For backbone control, the pT81luc was used (Moinova and Mulcahy, JBC, 1998). To determine modulation of DRE activation, transfections were performed using pGudLuc6.1a; and the pGL3-basic vector (Promega) was used a backbone control (Phelan et al., 1998).
Isolation of total RNA
RNeasy Mini kits and QIA Shredder kits (Qiagen, Valencia, CA, USA) were used to isolate total RNA from treated cells. Trypsinized cells were collected into 15ml sterile, conical centrifuge tubes and centrifuged at 250 x g for 10 minutes, the media was aspirated and following the provided protocol for Animal Cells, 600μl of RLT buffer (supplied in kit) containing 2-Mercaptoethanol was placed onto each cell pellet, cells were vortexed and sample was then placed onto a QIA Shredder column. Columns were centrifuged at approximately 13,400 x g for 2 minutes. The kit directions were then followed to complete the isolation process. RNA was eluted with 50μl RNase free water and total RNA was calculated. RNA yields ranged from 45μg to 53μg. RNA integrity was assessed using the Agilent. After confirmation of quality RNA, 18S and 28S peaks were clearly identified; cDNA synthesis was initiated using Affymetrix Human Genome U133A Array kit (Affymetrix, Santa Clara, CA)
Affymetrix gene arrays
Instructions provided by Affymetrix were followed in processing samples for assay on the Human Genome U133A Array (Assay ID 510681, Affymetrix Inc., Santa Clara, CA, USA). Briefly double stranded (ds) cDNA was synthesized from total RNA, the ds cDNA was cleaned up and ethanol precipitated. An in vitro translation was then performed and the resulting cRNA was quantified, and amounts were adjusted following the provided instructions. The cRNA was then fragmented and mixed into a hybridization cocktail which was applied to the U133A array and hybridized for 24 hours. The hybridization buffer was removed from the array. The array was then washed, stained and scanned. KUGR facility (UNM, Alb. NM, USA).
Real-time quantitative polymerase chain reaction (qRT-PCR)
Gene induction of seven genes, heme oxygenase 1 (HMOX-1; Assay ID HS00157965_m1), NAD(P)H dehydrogenase, quinone 1 (NQO1; Assay ID HS00168547_m1), epoxide hydrolase 1 (EPHX1; Assay ID HS00164458_m1), cytochrome P450, subfamily 1A1 (CYP1A1, Assay ID HS00153120_m1), cytochrome P450, subfamily 1B1 (CYP1B1, Assay ID HS00164383_m1), aldehyde dehydrogenase 3 family member A1 (ALDH3A1, Assay ID HS00167469_m1) and aldo-ketoreductase family 1 member C1 (AKR1C1, Assay ID HS00413886_m1) were measured by qRT-PCR. TaqMan® Gene Expression Assays for each of the above genes were purchased from Applied Biosystems (Foster City, CA). MCF-10A cells were treated in triplicate for 18 hours and MCF-10A total RNA was collected as described above. Reverse transcription reactions were completed using the High Capacity cDNA Archive Kit (Applied Biosystems, Foster City, CA). Real-time polymerase reactions (PCR) were carried out using TaqMan® Universal PCR Master Mix and 8 ng (total RNA) template cDNA, for detection of CYP1A1 32ng (total RNA) of template cDNA was used. PCR thermal cycling parameters used were AmpErase UNG Activation 2 min at 50°C, polymerase activation 10 min 95°C, melt 15 sec at 95°C, anneal and extend 1min at 60°C (melt and anneal/extend for 40 cycles). Comparative CT (first amplification cycle exceeding threshold) method was used for relative quantification. GADPH was the endogenous reference and DMSO served as the calibrator. Real-time PCR was run on Applied Biosystem’s 7900HT system with a standard 384-well block. To calculate the comparative CT, briefly, we determined the difference in CT (Δ CT) values between target and endogenous control, then determined the fold difference in gene expression (Δ Δ CT) the Δ CT of the calibrator was subtracted from the Δ CT of the target (Δ CT target − Δ CT calibrator). This calculation is described in detail by Applied Biosystems.
Analysis of mRNA data and statistics
The raw data from the Affymetrix chips were normalized using the Lowess procedure; data were further averaged for each 2-chip pair. All values for which at least one of the chip pairs had a normalized value below 100 was set to zero (minimum) in order to maximize the signal-to-noise ratio. On this basis, all columns were set at ZERO for 10,569 genes, for which the data were considered noise. The analysis presented further in this work was performed on the remaining 11,714 genes, which have at least one non-zero average column. 6. For these 11,714 genes, “Fold” ratios were comptued per experiment pair, using the corresponding 2-chip averages of the BPQ exposure, compared to DMSO controls. The distribution of “Fold” ratios was then analyzed assuming a Gaussian distribution. Genes that had “Fold” changes equal to or above six times the standard deviation were individually examined for this study.
Computer-Based Promoter Analysis for Antioxidant- and Dioxin-Response Elements
The promoter region of genes with significant increases in gene expression after exposure to benzo(a)pyrene quinones were assessed for the presence of antioxidant and dioxin-response elements using computer-based methods. Ten-thousand basepairs of promoter sequence upstream of the transcriptional initiation sites (as specified in Entrez Gene) were acquired from the National Center for Biotechnology Information Map Viewer website (i.e., http://www.ncbi.nlm.nih.gov/mapview/map_search.cgi?taxid=9606 ). This sequence was analyzed for the presence of canonical antioxidant- and dioxin- response elements in promoter regions using MatInspector Software (Genomatix Software, Munich, Germany - http://www.genomatix.de/). Antioxidant response elements were identified as nuclear factor (erythroid-derived 2)-like 2, NRF2 – binding sites. Dioxin response elements were identified as aryl hydrocarbon/dioxin receptor, aryl hydrocarbon receptor/ARNT heterodimers, or aryl hydrocarbon/ARNT heterodimers, fixed core binding sites.
RESULTS
Affymetrix Discovery of Genes Induced by 3,6-BPQ and 1,6-BPQ
Three sets of Affymetrix gene chip experiments were conducted to determine the similarities and differences between mRNA expression profiles obtained following 3,6-BPQ and 1,6-BPQ treatments. Because we have previously shown that both 3,6-BPQ and 1,6-BPQ activate EGFR (Burdick et al, 2003) and also likely IGF-1R (Tannheimer et al., 1998) signaling pathways, we performed studies in serum-free media following an 18 hr removal of both EGF and insulin. Preliminary work demonstrated that the optimal exposure concentration for treatment of MCF-10A cells with BPQs was 1 μM. Short term treatments (up to 24 hrs) produced no cytotoxicity. Previous experiments also suggested that many of the genes that we were interested in evaluating would require 6-18 hrs of exposure before an increase in mRNA would be detected. Therefore, our initial experiments examined the effects of 1 μM 3,6-BPQ and 1μM 1,6-BPQ on mRNA expression following treatment of MCF-10A cells for 18 hrs.
Two experiments were conducted with 3,6-BPQ to determine the reproducibility of findings. In experiment 1, three 3,6-BPQ-treated cultures of MCF-10A cells were pooled and extracted for total RNA. Three control cultures of MCF-10A cells were treated with the control solvent (DMSO at 0.1%). Duplicate Affymetrix U-133G array chips were then used for analysis of mRNA expression. The raw data were normalized and processed, and the Gaussian distribution of fold induction changes was used to compare treated cells to control cells. This experiment was repeated a second time and the results of the mRNA fold induction are displayed statistically. In Figure 1, the combined results of the two experiments are shown. Data is plotted as statistical distribution (σ number or number of standard deviations from the mean fold change) of Affy probes versus the fold change in 3,6-BPQ-treated cells compared to controls. Approximately half (11,714 out of 22,000 gene probes) exceeded the twice background level of fluorescence required for analysis (Figure 1). As shown in Figure 1, there were 40 genes that demonstrated fold changes at 6σ (p < .00001) or greater. The identities of these genes are shown in Table I. The results shown in Table I are separated for Experiments 1 and 2, and are ranked by the 3,6-BPQ fold induction calculated from the fluorescence intensity values from the Affy chip. Although Affy chips are not used for mRNA quantitation, we found remarkably good agreement in the magnitude of fold changes produced by the 40 genes induced by 3,6-BPQ treatment. We used the average of the two experiments to plot the data shown in Figure 1. As a part of Experiment 2, we also added another test group of MCF-10A cells that were treated with 1 μM 1,6-BPQ for 18 hrs. The statistical distribution of fold changes for probes is shown in Figure 2. In this experiment, we identified 63 genes that were induced 6σ or greater by 1,6-BPQ. The identities of these genes are shown in Table II.
Figure 1.

Statistical distribution (σ = one standard deviation) of Affymetrix U133-A gene chip probes produced by 3,6-BPQ following an 18 hr incubation with MCF-10A cells. Results are shown for two combined experiments obtained following treatment of 3 cell cultures and pooling of RNA. Data is displayed for each Affymetrix probe as the fluorescence ratio of signals for all 3–6-BPQ treated compared to control solvent (0.01% DMSO) cell culture RNA samples that had fluorescence values equal or greater than twice the background fluorescence.
TABLE 1.
Six Sigma Gene Changes for 3,6 BPQ sorted according to the AVERAGE FOLD
| Probe | Gene | Description | FOLD 3,6-BPQ AVERAGE | FOLD 3,6-BPQ Exp 1 | FOLD 3,6-BPQ Exp 2 |
|---|---|---|---|---|---|
| 203665_at | HMOX1 | heme oxygenase (decycling) 1 | 32.3 | 33.4 | 31.3 |
| 205749_at | CYP1A1 | cytochrome P450, family 1, subfamily A, polypeptide 1 | 12.9 | 15.7 | 10.3 |
| 206561_s_at | AKR1B10 | aldo-keto reductase family 1, member B10 (aldose reductase) | 6.6 | 5.3 | 7.9 |
| 205623_at | ALDH3A1 | aldehyde dehydrogenase 3 family, memberA1 | 6.2 | 5.7 | 6.7 |
| 201467_s_at | NQO1 | NAD(P)H dehydrogenase, quinone 1 | 5.5 | 3.4 | 7.7 |
| 209921_at | SLC7A11 | solute carrier family 7, (cationic amino acid transporter, y+system) member 11 | 5.2 | 3.5 | 6.9 |
| 201468_s_at | NQO1 | NAD(P)H dehydrogenase, quinone 1 | 4.9 | 3.8 | 6.1 |
| 202436_s_at | CYP1B1 | cytochrome P450, family 1, subfamily B, polypeptide 1 | 4.1 | 3.3 | 5.0 |
| 210519_s_at | NQO1 | NAD(P)H dehydrogenase, quinone 1 | 3.9 | 2.8 | 5.0 |
| 203925_at | GCLM | glutamate-cysteine ligase, modifier subunit | 3.8 | 3.3 | 4.2 |
| 207469_s_at | PIR | pirin (iron-binding nuclear protein) | 3.7 | 2.7 | 4.8 |
| 210896_s_at | ASPH | aspartate beta-hydroxylase | 3.7 | 2.9 | 4.5 |
| 208791_at | CLU | clusterin | 3.6 | 4.3 | 3.0 |
| 209641_s_at | ABCC3 | ATP-binding cassette, sub-family C (CFTR/MRP), member 3 | 3.4 | 1.9 | 4.9 |
| 201631_s_at | IER3 | immediate early response 3 | 3.4 | 3.3 | 3.4 |
| 217678_at | SLC7A11 | solute carrier family 7, (cationic amino acid transporter, y+system) member 11 | 3.3 | 1.6 | 5.0 |
| 201195_s_at | SLC7A5 | solute carrier family 7 (cationic amino acid transporter, y+system), member 5 | 3.2 | 2.7 | 3.8 |
| 202435_s_at | CYP1B1 | cytochrome P450, family 1, subfamily B, polypeptide 1 | 3.3 | 1.8 | 4.6 |
| 202434_s_at | CYP1B1 | cytochrome P450, family 1, subfamily B, polypeptide 1 | 3.3 | 3.2 | 3.2 |
| 209160_at | AKR1C3 | aldo-keto reductase family 1, member C3 (3-alpha hydroxysteroid dehydrogenase, type II) | 3.1 | 2.4 | 3.9 |
| 204341_at | TRIM16 | tripartite motif-containing 16 | 3.1 | 3.1 | 3.1 |
| 204058_at | ME1 | malic enzyme 1, NADP(+)-dependent, cytosolic | 3.1 | 1.6 | 4.6 |
| 202923_s_at | GCLC | glutamate-cysteine ligase, catalytic subunit | 2.8 | 2.1 | 3.5 |
| 217626_at | AKR1C1 | aldo-keto reductase family 1, member C1 (dihydrodiol dehydrogenase 1; 20-alpha (3-alpha)-hydroxysteroid dehydrogenase) | 2.7 | 3.7 | 1.8 |
| 205019_s_at | VIPR1 | vasoactive intestinal peptide receptor 1 | 2.7 | 2.3 | 3.1 |
| 39249_at | AQP3 | aquaporin 3 (Gill blood group) | 2.6 | 2.3 | 3.0 |
| 202922_at | GCLC | glutamate-cysteine ligase, catalytic subunit | 2.6 | 1.8 | 3.5 |
| 204532_x_at | UGT1A10 | UDP glucuronosyltransferase 1 family, polypeptide A10 | 2.6 | 3.2 | 2.0 |
| 209699_x_at | AKR1C2 | aldo-keto reductase family 1, member C2 (dihydrodiol dehydrogenase 2; bile acid binding protein; 3-alpha hydroxysteroid dehydrogenase, type III) | 2.6 | 1.8 | 3.3 |
| 209135_at | ASPH | aspartate beta-hydroxylase | 2.6 | 1.7 | 3.4 |
| 216594_x_at | AKR1C1 | aldo-keto reductase family 1, member C1 (dihydrodiol dehydrogenase 1; 20-alpha (3-alpha)-hydroxysteroid dehydrogenase) | 2.6 | 2.0 | 3.2 |
| 204820_s_at | BTN3A3 | butyrophilin, subfamily 3, member A3 | 2.6 | 2.3 | 2.8 |
| 204151_x_at | AKR1C1 | aldo-keto reductase family 1, member C1 (dihydrodiol dehydrogenase 1; 20-alpha (3-alpha)-hydroxysteroid dehydrogenase) | 2.5 | 1.8 | 3.1 |
| 206515_at | CYP4F3 | cytochrome P450, family 4, subfamily F, polypeptide 3 | 2.5 | 2.2 | 2.7 |
| 202437_s_at | CYP1B1 | cytochrome P450, family 1, subfamily B, polypeptide 1 | 2.4 | 1.7 | 3.2 |
| 205875_s_at | TREX1 | three prime repair exonuclease 1 | 2.4 | 2.7 | 2.2 |
| 212153_at | POGZ | pogo transposable element with ZNF domain | 2.4 | 2.1 | 2.7 |
| 211653_x_at | AKR1C2 | aldo-keto reductase family 1, member C2 (dihydrodiol dehydrogenase 2; bile acid binding protein; 3-alpha hydroxysteroid dehydrogenase, type III) | 2.4 | 1.8 | 2.9 |
| 202017_at | EPHX1 | epoxide hydrolase 1, microsomal (xenobiotic) | 2.4 | 2.0 | 2.8 |
| 218012_at | TSPYL2 | TSPY-like 2 | 2.4 | 1.5 | 3.3 |
Figure 2.
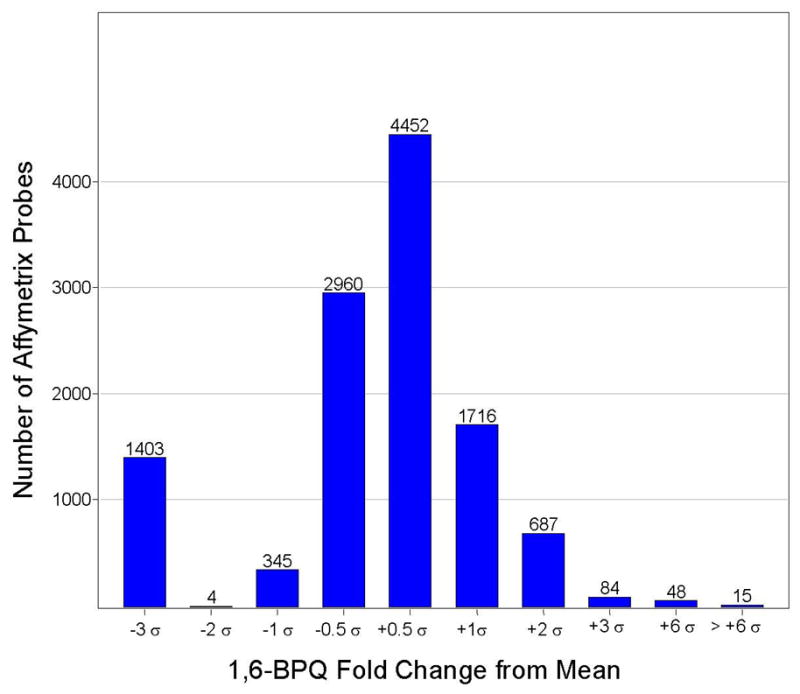
As in Figure 1, statistical distribution of Affymetrix U133-A gene chip probes produced by 1,6-BPQ following an 18 hr incubation with MCF-10A cells.
TABLE 2.
Six Sigma Gene Changes for 1,6 BPQ sorted according to FOLD
| Probe | Gene | Description | FOLD 1,6-BPQ |
|---|---|---|---|
| 203665_at | HMOX1 | heme oxygenase (decycling) 1 | 16.5 |
| 209921_at | SLC7A11 | solute carrier family 7, (cationic amino acid transporter, y+ system) member 11 | 7.6 |
| 206561_s_at | AKR1B10 | aldo-keto reductase family 1, member B10 (aldose reductase) | 6.3 |
| 201467_s_at | NQO1 | NAD(P)H dehydrogenase, quinone 1 | 5.8 |
| 210896_s_at | ASPH | aspartate beta-hydroxylase | 5.7 |
| 217678_at | SLC7A11 | solute carrier family 7, (cationic amino acid transporter, y+ system) member 11 | 5.1 |
| 204058_at | ME1 | malic enzyme 1, NADP(+)-dependent, cytosolic | 4.9 |
| 202923_s_at | GCLC | glutamate-cysteine ligase, catalytic subunit | 4.4 |
| 201468_s_at | NQO1 | NAD(P)H dehydrogenase, quinone 1 | 4.4 |
| 210519_s_at | NQO1 | NAD(P)H dehydrogenase, quinone 1 | 4.4 |
| 209641_s_at | ABCC3 | ATP-binding cassette, sub-family C (CFTR/MRP), member 3 | 4.3 |
| 209160_at | AKR1C3 | aldo-keto reductase family 1, member C3 (3-alpha hydroxysteroid dehydrogenase, type II) | 4.2 |
| 207469_s_at | PIR | pirin (iron-binding nuclear protein) | 4.2 |
| 209135_at | ASPH | aspartate beta-hydroxylase | 4.1 |
| 202922_at | GCLC | glutamate-cysteine ligase, catalytic subunit | 3.8 |
| 209699_x_at | AKR1C2 | aldo-keto reductase family 1, member C2 (dihydrodiol dehydrogenase 2; bile acid binding protein; 3-alpha hydroxysteroid dehydrogenase, type III) | 3.7 |
| 208415_x_at | ING1 | inhibitor of growth family, member 1 | 3.6 |
| 216594_x_at | AKR1C1 | aldo-keto reductase family 1, member C1 (dihydrodiol dehydrogenase 1; 20-alpha (3-alpha)-hydroxysteroid dehydrogenase) | 3.5 |
| 204151_x_at | AKR1C1 | aldo-keto reductase family 1, member C1 (dihydrodiol dehydrogenase 1; 20-alpha (3-alpha)-hydroxysteroid dehydrogenase) | 3.4 |
| 213112_s_at | SQSTM1 | sequestosome 1 | 3.4 |
| 211653_x_at | AKR1C2 | aldo-keto reductase family 1, member C2 (dihydrodiol dehydrogenase 2; bile acid binding protein; 3-alpha hydroxysteroid dehydrogenase, type III) | 3.4 |
| 221432_s_at | SLC25A28 | solute carrier family 25, member 28 | 3.3 |
| 203925_at | GCLM | glutamate-cysteine ligase, modifier subunit | 3.3 |
| 202435_s_at | CYP1B1 | cytochrome P450, family 1, subfamily B, polypeptide 1 | 3.2 |
| 218446_s_at | FAM18B | family with sequence similarity 18, member B | 3.2 |
| 202436_s_at | CYP1B1 | cytochrome P450, family 1, subfamily B, polypeptide 1 | 3.2 |
| 212153_at | POGZ | pogo transposable element with ZNF domain | 3.2 |
| 209121_x_at | NR2F2 | nuclear receptor subfamily 2, group F, member 2 | 3.1 |
| 204341_at | TRIM16 | tripartite motif-containing 16 | 3.1 |
| 212151_at | PBX1 | pre-B-cell leukemia transcription factor 1 | 3.0 |
| 212767_at | MTG1 | mitochondrial GTPase 1 homolog (S. cerevisiae) | 3.0 |
| 202017_at | EPHX1 | epoxide hydrolase 1, microsomal (xenobiotic) | 3.0 |
| 205623_at | ALDH3A1 | aldehyde dehydrogenase 3 family, memberA1 | 2.9 |
| 209380_s_at | ABCC5 | ATP-binding cassette, sub-family C (CFTR/MRP), member 5 | 2.9 |
| 204169_at | IMPDH1 | IMP (inosine monophosphate) dehydrogenase 1 | 2.9 |
| 201266_at | TXNRD1 | thioredoxin reductase 1 | 2.8 |
| 219034_at | PARP16 | poly (ADP-ribose) polymerase family, member 16 | 2.8 |
| 203222_s_at | TLE1 | transducin-like enhancer of split 1 (E(sp1) homolog, Drosophila) | 2.8 |
| 208791_at | CLU | clusterin | 2.8 |
| 39249_at | AQP3 | aquaporin 3 (Gill blood group) | 2.7 |
| 217626_at | AKR1C1 | aldo-keto reductase family 1, member C1 (dihydrodiol dehydrogenase 1; 20-alpha (3-alpha)-hydroxysteroid dehydrogenase) | 2.7 |
| 221867_at | LOC9683 | Nedd4 binding protein 1 | 2.7 |
| 203366_at | POLG | polymerase (DNA directed), gamma | 2.6 |
| 214696_at | LOC84981 | hypothetical protein MGC14376 | 2.6 |
| 202820_at | AHR | aryl hydrocarbon receptor | 2.6 |
| 202210_x_at | GSK3A | glycogen synthase kinase 3 alpha | 2.6 |
| 218639_s_at | ZXDC | ZXD family zinc finger C | 2.6 |
| 205808_at | ASPH | aspartate beta-hydroxylase | 2.6 |
| 211607_x_at | EGFR | epidermal growth factor receptor (erythroblastic leukemia viral (v-erb-b) oncogene homolog, avian) | 2.6 |
| 219475_at | LOC29948 | pregnancy-induced growth inhibitor | 2.6 |
| 214196_s_at | TPP1 | tripeptidyl peptidase I | 2.6 |
| 203811_s_at | DNAJB4 | DnaJ (Hsp40) homolog, subfamily B, member 4 | 2.5 |
| 209109_s_at | TSPAN6 | tetraspanin 6 | 2.5 |
| 209592_s_at | WDR68 | WD repeat domain 68 | 2.5 |
| 206515_at | CYP4F3 | cytochrome P450, family 4, subfamily F, polypeptide 3 | 2.5 |
| 209005_at | FBXL5 | F-box and leucine-rich repeat protein 5 | 2.5 |
| 218326_s_at | LGR4 | leucine-rich repeat-containing G protein-coupled receptor 4 | 2.5 |
| 202884_s_at | PPP2R1B | protein phosphatase 2 (formerly 2A), regulatory subunit A (PR 65), beta isoform | 2.4 |
| 219534_x_at | CDKN1C | cyclin-dependent kinase inhibitor 1C (p57, Kip2) | 2.4 |
| 206829_x_at | ZNF430 | zinc finger protein 430 | 2.4 |
| 212979_s_at | LOC9747 | KIAA0738 gene product | 2.4 |
| 215954_s_at | C19orf29 | chromosome 19 open reading frame 29 | 2.4 |
| 216237_s_at | MCM5 | MCM5 minichromosome maintenance deficient 5, cell division cycle 46 (S. cerevisiae) | 2.4 |
The results obtained in the two experiments and reported in Tables I and II revealed a remarkable similarity in the gene lists that were induced by 3,6-BPQ and 1,6-BPQ with a notable exception that CYP1A1 was induced by 3,6-BPQ and not by 1,6-BPQ. A casual inspection of the other genes reveals many genes that are associated with the Ah receptor and activation of dioxin (or xenobotic) response elements (DRE or XRE). Other genes identified with this method were found to be possibly associated with oxidative stress and activation of anti-oxidant (or electrophilic) response elements (ARE or EpRE) using the Biocarta© (http://biocarta.com/genes/allpathways.asp) mapping system (data not shown).
In Table III, we compared the results shown in Tables I and II and found that we could explain the genes most significantly induced by 3,6-BPQ and 1,6-BPQ as having either DREs/XREs or AREs/EpREs in their upstream (10 kB analysis) promoters. HMOX1 was the top gene induced by both 3,6-BPQ and 1,6-BPQ, presumably through both DREs and AREs, The majority of highly induced genes induced by 3,6-BPQ and 1,6-BPQ are associated with the activation of the AhR through the DRE (CYP1A1, CYP1B1, EPHX1, NQO1 and NQO2) or oxidative stress and/or electrophilic action through the ARE/EpRE ( NQO1, ALDH3A1, UGT1A9). Interestingly a number of AKR genes were identified as activated via BPQs (AKR1C1, AKR1C2, and AKR1B10). A number of novel genes were identified as activated by BPQs through DREs or AREs/EpREs, including SLC7A11, GCLC, GCLM, PIR, ASPH, POGZ, EGFR, SQSTM1, ING1, IER3, and VIPR1.
TABLE III.
Analysis of Gene Promoters Induced by 1,6- and 3,6-B[a]P Quinones*
| Gene Promoter | Number of Response Elements in Promoter | Response Element Location$ | ||
|---|---|---|---|---|
| ARE/EpRE1 | DRE/XRE2 | ARE/EpRE1 | DRE/XRE2 | |
| HMOX1# | 2 | 5 | 2411, 7119 | 2831, 4164, 6153, 7133, 7365 |
| CYP1A1# | 1 | 13 | 7529 | 36, 379, 482, 873, 877, 965,1038,1364, 2099, 3058, 5594, 7497, 9171 |
| CYP1B1# | 0 | 7 | ni3 | 825, 844, 980, 1015, 1483, 2304, 8531 |
| AKR1C1# | 1 | 5 | 1054 | 1100, 2590,2648, 3698, 8551 |
| ALDH3A1# | 3 | 10 | 4930, 5174, 5660 | 74, 746, 1182, 2122, 2550, 4220, 4272, 5037, 7968, 8417 |
| NQO1# | 1 | 7 | 381 | 306, 3119, 5031, 5556, 7330, 7644, 9516 |
| EPHX1# | 0 | 8 | ni | 1525, 2410, 4379, 6141, 7598, 7685, 9900 |
| AKR1B10 | 2 | 6 | 273, 7701 | 924, 1823, 5027, 5351, 6392, 9093 |
| AKR1C2 | 3 | 0 | 2411, 5028, 7462 | ni |
| SLC7A11 | 0 | 3 | ni | 4795, 7566, 7605 |
| GCLC | 0 | 5 | ni | 228, 2897, 3391, 3989, 5568 |
| GCLM | 3 | 1 | 2217, 3368, 9277 | 1966 |
| PIR | 0 | 6 | ni | 46, 78, 867, 2235, 4092, 9553 |
| ASPH | 1 | 4 | 3214 | 117, 405, 7716, 7838 |
| POGZ | 2 | 10 | 3868, 8575 | 541, 1669, 2024, 4578, 5155, 7101, 7393, 7587, 8859, 8954 |
| AHR | 1 | 1 | 4230 | 2598 |
| EGFR | 2 | 1 | 173, 7005 | 5095 |
| SQSTM1 | 3 | 11 | 1901, 4087, 9936 | 1271, 1533, 1694, 1931, 2059, 2173, 3255, 3841, 5025, 6878, 9249 |
| ING1 | 3 | 13 | 468, 1605, 7732 | 169, 1135, 1388, 2190, 2409, 2499, 3606, 3616, 3846, 5231, 6201, 9720, 9972 |
| IER3 | 3 | 9 | 2878, 3637, 7204 | 431, 762, 1585, 2679, 4096, 7929, 8382, 9387, 9397 |
| VIPR1 | 0 | 3 | ni | 796, 4453, 5503 |
| UGT1A9 | 3 | 4 | 930, 4537, 9545 | 2205, 2381, 4283, 6051 |
| NQO2 | 0 | 7 | ni | 701, 3047, 3724, 5329, 7439, 9588, 9600 |
Promoter analysis was performed using MatInspector (Cartharius et al., 2005) for 10Kb upstream of the gene transcriptional initiation site.
Listed as start of response element location upstream of transcriptional initiation site.
Expression level determined by both qPCR and microarray.
Antioxidant response element (ARE) = the nuclear factor (erythroid-derived 2)-like 2, NRF2 site.
Dioxin response element (DRE) or Xenobiotic response elements (XRE) = includes the aryl hydrocarbon/ dioxin receptor, aryl hydrocarbon receptor/ arnt heterodimers, and aryl hydrocarbon/ arnt heterodimers, fixed core sites.
None identified.
Differential Activation of DRE and ARE/EpRE Constructs by BaP and BaP metabolites
To test the hypothesis that 3,6-BPQ and 1,6-BPQ activate MCF-10A genes through signaling pathways that activate DREs and AREs in MCF-10A cells, we performed transient transfection experiments in MCF-10A cells. In Figure 3, we found that BaP and a wide variety of its metabolites, including the 3,6- and 1,6-BPQs were found to activate the DRE-luciferase construct. These results are similar to those previously reported by Burczynski and Penning (2000). Interestingly, we found that 3,6-BPQ was a better activator of the DRE-luciferase than was 1,6-BPQ indicating that it may have more significant AhR effects than 1,6-BPQ. This observation may explain why 3,6-BPQ induced CYP1A1 mRNA, whereas 1,6-BPQ did not.
Figure 3.
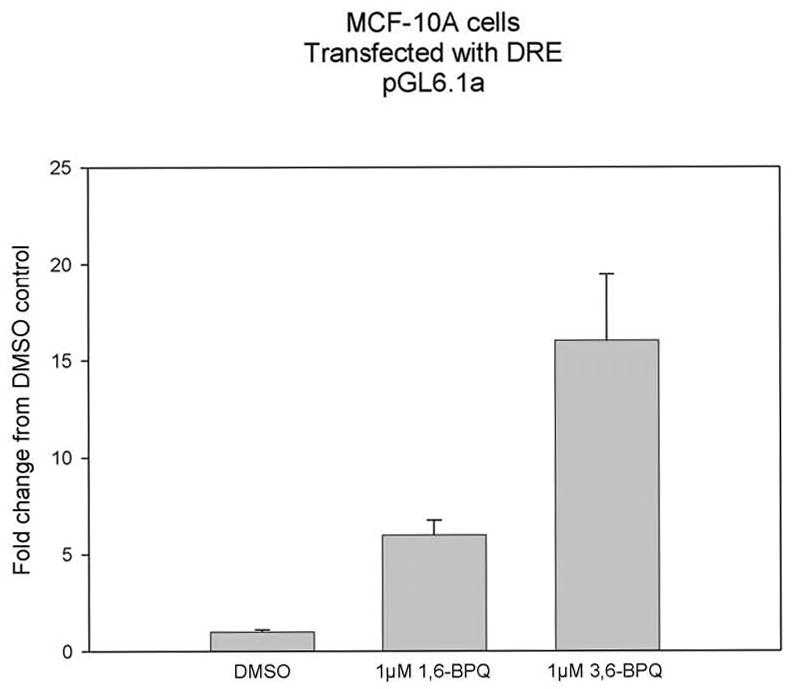
DRE-luciferase results for MCF-10A transfected cells following 18 hr treatment with 1 μM 3,6-BPQ compared to 1,6-BPQ. Results are shown for a representative experiment with triplicate cultures of cells analyzed individually and expressed as the average ± SD of the mean. Both the 1,6-BPQ and 3,6-BPQ produced a statistical significant increase in DRE-luciferase activity (p < .01).
3,6-BPQ and 1,6-BPQ were also examined for their ability to activate an ARE sequence that was identified from the NQO1 promoter region and was cloned into a transient transfection system for luciferase detection (Phelan et al., 1998). As shown in Figure 4, we found that both 1,6-BPQ and 3,6-BPQ were capable of activating the ARE-luciferase construct in MCF-10A cells; however, 1,6-BPQ appeared to have better activity than did 3,6-BPQ. This result is not surprising, as we have shown that 1,6-BPQ generates more ROS than does 3,6-BPQ through redox-cycling (Burdick et al., 2003), confirming our previous observation that ROS may play a role in activating ARE.
Figure 4.

ARE-luciferase results for MCF-10A transfected cells following 18 hr treatment with 1 μM 3,6-BPQ compared to 1,6-BPQ. Results are shown for a representative experiment with triplicate cultures of cells analyzed individually and expressed as the average ± SD of the mean. Both the 1,6-BPQ and 3,6-BPQ produced a statistical significant increase in ARE-luciferase activity (p < .01).
qPCR Experiments for Gene Validation and Examination of Role of ARE and DRE in BPQ gene induction
In a final series of experiments, we tested the hypothesis that DRE and ARE are responsible for several key genes induced by 3,6-BPQ and 1,6-BPQ. In these experiments we compared the effects of these BPQs to well-established activators of the AhR/DRE pathway by TCDD (Pelkonnen and Nebert, 1982) and the ARE/EpRE pathway by TBHQ (Nguyen et al., 2004). We utilized quantitative qRT-PCR and Taqman probes that were matched to the Affymetrix sequences used on arrays. Because we have previously shown that BPQs activate EGFR signaling pathways (Burdick et al., 2003), we also included EGF as a control for gene activation because we have previously shown that BPQs activate EGFR (Burdick et al., 2003). Results showed (Figures 7–9) that the response of the seven genes examined (HMOX-1, CYP1A1, CYP1B1, EPHX1, NQO1, AKR1C1, and ALDH3A1) could be categorized as either DRE > ARE (CYP1A1 and CYP1B1 - Figure 6), ARE > DRE (HMOX1, AKR1C1, EPHX1 – Figure 7) or DRE ~ ARE (ALDH3A1 and CYP1B1 – Figure 8) responsive based on the induction of these genes to TCDD or TBHQ. CYP1A1 was most selectively induced by TCDD and by 3,6-BPQ. EGF did not activate any of the seven genes that we examined. These results support the conclusion of the previous finding that 3,6-BPQ has a more selective effect on AhR and DRE pathways than does 1,6-BPQ.
Figure 7.
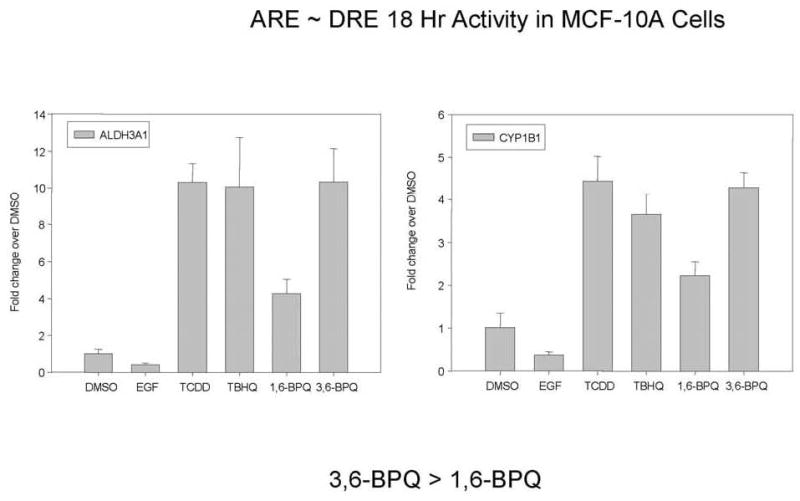
qRT-PCR results for ALDH3A1 and CYP1B1 where the TBHQ ARE activity appears to be equivalent to the TCDD DRE activity. MCF-10A cells were treated with DMSO (solvent control), TCDD (10 nm), TBHQ (20 μM), 10 μg/ml EGF, 1 μM 1,6-BPQ, or 1 μM 3,6-BPQ for 18 hrs, followed by extraction of RNA and Taqman analysis. Results shown are the Mean ± SD for triplicate determination using Taqman probes (p < .01).
Figure 6.

qRT-PCR results for HMOX1, AKR1C1, NQO1, and EPHX1 where the TBHQ ARE activity appears to be greater than the TCDD DRE activity. MCF-10A cells were treated with DMSO (solvent control), TCDD (10 nm), TBHQ (20 μM), 10 μg/ml EGF, 1 μM 1,6-BPQ, or 1 μM 3,6-BPQ for 18 hrs, followed by extraction of RNA and Taqman analysis. Results shown are the Mean ± SD for triplicate determination using Taqman probes (p < .01).
DISCUSSION
Our laboratory has shown that several BaP metabolites activate signaling pathways in mammary epithelial cells associated with increased intracellular Ca2+ (Tannheimer et al., 1997, 1999), protein tyrosine kinase signaling (Tannheimer et al., 1998), cell proliferation and increased cell survival (Davis et al., 2001, 2003; Burdick et al., 2003, 2006). We have also shown that Ah receptor (AhR) agonists, such as TCDD, increase the production of TGFα leading to increased epidermal growth factor (EGF) signaling (Davis et al, 2001). Recently we showed that 1,6-BPQ and 3,6-BPQ activate EGFR signaling pathways in MCF-10A cells leading to activation of Erk and Akt leading to increased cell proliferation and survival (Burdick et al., 2003). Both 1,6- and 3–6 BPQ produced oxidative stress and EGFR signaling in MCF-10A cells, that could be prevented by overexpression of catalase or treatment with anti-oxidants. BP-quinones are well known redox-cycling agents that have been shown to exert oxidative stress in cells (Zhu et al., 1998).
The present studies were prompted by the observation that both 1,6-BPQ and 3,6-BPQ produced growth promoting effects in MCF-10A cells, yet 1,6-BPQ results in substantially more ROS formation, suggesting that other pathways might also be activated by these agents. We used gene expression array techniques to elucidate the pathways activated by BPQs. Our results showed that several classes of genes were induced by both BPQs, whereas there were several genes selectively induced by 1,6-BPQ and 3,6-BPQ. Based on the patterns of genes induced, promoter analyses of those genes, and the ability of BPQs to preferentially activate DRE compared to ARE luciferase constructs, we conclude that three main pathways are activated by BPQs: 1) AhR-dependent pathways associated with activation of DRE, signaling, and metabolism of PAHs and steroids; 2) oxidative stress pathways likely associated with Nrf2 and ARE activation; and 3) EGFR activated pathways. We also identified a series of novel gene targets (AQP3, BTN3A3, ME1, PIR and POGZ) that we cannot specifically link to known pathways based on current annotations. Because there is a clear overlap between many of the induced genes that have both DRE and ARE present in their promoter sequences, we will discuss the DRE and ARE pathways together.
We identified 23 genes that were induced by both 1,6-BPQ and 3,6-BPQ. The top gene in terms of fold induction by both agents was HMOX1. HMOX1 has been clearly associated with protection from oxidative stress in animals through the bilirubin pathway (Prawan et al., 2005). Its presence in mammary epithelial cells has not been reported, and its activation by BPQs has not been previously shown. Based on the finding that HMOX1 has both DRE and ARE present in its promoter region, it is likely that both AhR binding and oxidative stress (ROS) activity plays a role in HMOX induction. However, based upon our findings with TCDD and TBHQ, there does appear to be a simple explanation of how HMOX is regulated in MCF-10A cells. It is clear that HMOX is regulated via several direct and indirect mechanisms in many mammalian cells (Alam et al., 2004).
Other oxidative stress associated genes likely induced by a combination of DRE and ARE activation included NQO1, NQO2, and ALDH3A1. NQO1 and 2 are particularly important because they play a role in metabolism of quinones such as BPQs (Vasiliou et al, 2006). Although we found numerous DREs upstream in the promoter region of NQO1, the possibility that TCDD induced increases in NQO1 is indirect and due to oxidative stress cannot be excluded (Radjendirane and Jaiswal, 1999). ALDH3A1 also plays a role in protecting cells from toxic aldehydes and is part of a battery of phase 2 enzymes induced by Nrf2 sensing of redox-active agents and electrophiles (Vasiliou et al., 2004). Another phase 2 gene induced by both BPQs was UGT1A9 (Wooster et al., 1991). PAH and steroid metabolism genes induced by BPQs included CYP1A1, CYP1B1, and EPHX1. It is interesting that CYP1B1 and EPHX1 were induced by both the 3,6-BPQ and 1,6-BPQ, whereas only 3,6-BPQ induced CYP1A1 in MCF-10A cells. This may have been due to the greater DRE activating properties of the 3,6-BPQ detected in the DRE luciferase assay. Other genes associated with oxidative stress included SLC7A11 which is associated with cystine and glutamate uptake for glutathione synthesis (Kaleeba and Berger, 2006), GCLC which is the rate limiting gene for glutathione synthesis, and the GCLM gene that regulates GCLC (Gipp et al., 1995; Gipp and Mulcahy, 2000.)
Several AKR family (AKR1C1, AKR1C2, and AKR1B10) genes were found to be induced by BPQs, presumably through the action of both DRE and ARE (Lou et al., 2006). AKR1C1 is particularly noteworthy because this enzyme converts BaP-7,8-dihydrodiol to the 7,8-ortho-BPQ which has been shown the be a tumor initiator (Jin and Penning, 2006; Balu et al., 2004) as well as a Ca2+ signaling agents (Gao et al., 2005). Other receptor signaling genes that were detected were EGFR, AhR, and VIPR1 (Couvineau et al., 1994), although it is unclear if this latter receptor is active in mammary epithelial cells. Other signaling genes included ASPH that has been proposed to catalyze aspartyl beta-hydroxylation of EGF domains and modulate Notch pathway signaling. Dinchuk et al. (2002), IER-3 Charles et al. (1993) cloned gly96, a mouse immediate-early gene inducible by serum growth factors that may play a role in reducing apoptosis, ING -1 Garkavtsev et al. (1996) reported that expression of high levels of transfected constructs of ING1 regulated cell growth, and SQSTM1 P62 which is a ligand for Src kinases (Park et al., 1995)
There were several genes that were selectively induced by 3,6-BPQ including CYP1A1 (discussed above), clusterin (CLU, a potential tissue remodeling protein, Jenne and Tschopp, 1992), TRIM16 (or EBBP which plays a role in estrogen or EGF activation of mammary epithelial cells, Beer, et al., 2002), CYP4F3 (a LTB4 hydroxylase, Kikuta et al., 1998), and the DNA repair gene TREX1 (Mazur and Perrino, 1999).
In summary, our studies demonstrate that DRE and ARE play a major role in the response of human mammary epithelial cells to BPQs. EGF receptor signaling may also contribute to genes induced by BPQs, although none of the seven genes that we chose for close examination (CYP1A1, CYP1B1, EPHX1, HMOX1, NQO1, AKR1C1, and ALDH3A1) were responsive to EGF treatment in MCF-10A cells. NQO1 is a major pathway responsible for protection of cells against quinone toxicity. This gene was highly induced in MCF-10A cells. Because of the known polymorphisms in NQO1, it will be of interest to determine whether the response of normal human mammary epithelial cells (HMEC) correlates with the differential expression or activity of this enzyme. We predict that people who express the NQO1*2 allele (Larson et al., 1999) will be supersensitive to quinones, which will be evidenced by extremely low concentrations (low nanomolar) causing oxidative stress. This hypothesis is currently being investigated as a mechanism for differential sensitivity to oxidative stress produced by quinones associated with breast cancer promotion.
Figure 5.

qRT-PCR results for CYP1A1 and CYP1B1 where the DRE activity appears to be greater than the ARE activity based on the activation of these genes by TCDD (DRE activator) and TBHQ (ARE activator). MCF-10A cells were treated with DMSO (solvent control), TCDD (10 nm), TBHQ (20 μM), 10 μg/ml EGF, 1 μM 1,6-BPQ, or 1 μM 3,6-BPQ for 18 hrs, followed by extraction of RNA and Taqman analysis. Results shown are the Mean ± SD for triplicate determination using Taqman probes (p < .01).
Acknowledgments
Drs. Zeyu Jiang and Cristian Bologa (UNM Division of Biocomputing) contributed to the statistical processing of this dataset. Software written by Dr. Steve Mathias (UNM Division of Biocomputing) was used to process the Affymetrix chips. Dra. Maria de Lourdes Rodriguez contributed to the development of the DRE and ARE luciferase assays, with the expert technical assistance of Harmony Bowles.
This work was supported by NIEHS P30-012072, RO1-ES07952, and NCI P30-CA118100 by the Keck University Genomics Resource (KUGR) lab at the UNM HSC, and by the New Mexico Tobacco Settlement Fund.
Footnotes
Publisher's Disclaimer: This is a PDF file of an unedited manuscript that has been accepted for publication. As a service to our customers we are providing this early version of the manuscript. The manuscript will undergo copyediting, typesetting, and review of the resulting proof before it is published in its final citable form. Please note that during the production process errors may be discovered which could affect the content, and all legal disclaimers that apply to the journal pertain.
References
- Alam J, Igarashi K, Immenschuh S, Shibahara S, Tyrrell RM. Regulation of heme oxygenase-1 gene transcription: recent advances and highlights from the International Conference (Uppsala, 2003) on Heme Oxygenase. Antioxid Redox Signal. 2004;6:924–933. doi: 10.1089/ars.2004.6.924. [DOI] [PubMed] [Google Scholar]
- Balogh GA, Russo IH, Balsara BR, Russo J. Detection of chromosomal aberrations by comparative genomic hybridization during transformation of human breast epithelial cells in vitro. Int J Oncol. 2006;29:877–881. doi: 10.3892/ijo.29.4.877. [DOI] [PubMed] [Google Scholar]
- Balu N, Padgett WT, Lambert GR, Swank AE, Richard AM, Nesnow S. Identification and characterization of novel stable deoxyguanosine and deoxyadenosine adducts of benzo[a]pyrene-7,8-quinone from reactions at physiological pH. Chem Res Toxicol. 2004;17:827–838. doi: 10.1021/tx034207s. [DOI] [PubMed] [Google Scholar]
- Bartley J, Bartholomew JC, Stampfer MR. Metabolism of benzo(a)pyrene by human epithelial and fibroblastic cells: metabolite patterns and DNA adduct formation. J Cell Biochem. 1982;18:135–148. doi: 10.1002/jcb.1982.240180202. [DOI] [PubMed] [Google Scholar]
- Bartley JC, Stampfer MR. Factors influencing benzo[a]pyrene metabolism in human mammary epithelial cells in culture. Carcinogenesis. 1985;6:1017–1022. doi: 10.1093/carcin/6.7.1017. [DOI] [PubMed] [Google Scholar]
- Bartosiewicz M, Penn S, Buckpitt A. Applications of gene arrays in environmental toxicology: fingerprints of gene regulation associated with cadmium chloride, benzo(a)pyrene, and trichloroethylene. Environ Health Perspect. 2001;109:71–74. doi: 10.1289/ehp.0110971. [DOI] [PMC free article] [PubMed] [Google Scholar]
- Beer HD, Munding C, Dubois N, Mamie C, Hohl D, Werner S. The estrogen-responsive B box protein: a novel regulator of keratinocyte differentiation. J Biol Chem. 2002;277:20740–20749. doi: 10.1074/jbc.M111233200. [DOI] [PubMed] [Google Scholar]
- Bolton JL, Trush MA, Penning TM, Dryhurst G, Monks TJ. Role of quinones in toxicology. Chem Res Toxicol. 2000;13:135–160. doi: 10.1021/tx9902082. [DOI] [PubMed] [Google Scholar]
- Brody JG, Rudel RA. Environmental pollutants and breast cancer. Environ Health Perspect. 2003;111:1007–1019. doi: 10.1289/ehp.6310. [DOI] [PMC free article] [PubMed] [Google Scholar]
- Burczynski ME, Penning TM. Genotoxic polycyclic aromatic hydrocarbon ortho-quinones generated by aldo-keto reductases induce CYP1A1 via nuclear translocation of the aryl hydrocarbon receptor. Cancer Res. 2000;60:908–915. [PubMed] [Google Scholar]
- Burdick AD, Davis JW, 2nd, Liu KJ, Hudson LG, Shi H, Monske ML, Burchiel SW. Benzo(a)pyrene quinones increase cell proliferation, generate reactive oxygen species, and transactivate the epidermal growth factor receptor in breast epithelial cells. Cancer Res. 2003;63:7825–7833. [PubMed] [Google Scholar]
- Burdick AD, Ivnitski-Steele ID, Lauer FT, Burchiel SW. PYK2 mediates anti-apoptotic AKT signaling in response to benzo[a]pyrene diol epoxide in mammary epithelial cells. Carcinogenesis. 2006;27:2331–2340. doi: 10.1093/carcin/bgl083. [DOI] [PubMed] [Google Scholar]
- Buters J, Quintanilla-Martinez L, Schober W, Soballa VJ, Hintermair J, Wolff T, Gonzalez FJ, Greim H. CYP1B1 determines susceptibility to low doses of 7,12-dimethyl-benz[a]anthracene-induced ovarian cancers in mice: correlation of CYP1B1-mediated DNA adducts with carcinogenicity. Carcinogenesis. 2003;24:327–334. doi: 10.1093/carcin/24.2.327. [DOI] [PubMed] [Google Scholar]
- Cavalieri EL, Devanesan PD, Rogan EG. Radical cations in the horseradish peroxidase and prostaglandin H synthase mediated metabolism and binding of benzo[a]pyrene to deoxyribonucleic acid. Biochem Pharmacol. 1988;37:2183–2187. doi: 10.1016/0006-2952(88)90579-5. [DOI] [PubMed] [Google Scholar]
- Charles CH, Yoon JK, Simske JS, Lau LF. Genomic structure, cDNA sequence, and expression of gly96, a growth factor-inducible immediate-early gene encoding a short-lived glycosylated protein. Oncogene. 1993;8:797–801. [PubMed] [Google Scholar]
- Christou M, Moore CJ, Gould MN, Jefcoate CR. Induction of mammary cytochromes P-450: an essential first step in the metabolism of 7,12-dimethylbenz[a]anthracene by rat mammary epithelial cells. Carcinogenesis. 1987;8:73–80. doi: 10.1093/carcin/8.1.73. [DOI] [PubMed] [Google Scholar]
- Conney AH, Chang RL, Cui XX, Schiltz M, Yagi H, Jerina DM, Wei SJ. Dose-dependent differences in the profile of mutations induced by carcinogenic (R,S,S,R) bay- and fjord-region diol epoxides of polycyclic aromatic hydrocarbons. Adv Exp Med Biol. 2001;500:697–707. doi: 10.1007/978-1-4615-0667-6_102. [DOI] [PubMed] [Google Scholar]
- Couvineau A, Rouyer-Fessard C, Darmoul D, Maoret J-J, Carrero I, Ogier-Denis E, Laburthe M. Human intestinal VIP receptor: cloning and functional expression of two cDNA encoding proteins with different N-terminal domains. Biochem Biophys Res Commun. 1994;200:769–776. doi: 10.1006/bbrc.1994.1517. [DOI] [PubMed] [Google Scholar]
- Davis JW, Jr, Burdick AD, Lauer FT, Burchiel SW. The aryl hydrocarbon receptor antagonist, 3′methoxy-4′nitroflavone, attenuates 2,3,7,8-tetrachlorodibenzo-p-dioxin-dependent regulation of growth factor signaling and apoptosis in the MCF-10A cell line. Toxicol Appl Pharmacol. 2003;188:42–49. doi: 10.1016/s0041-008x(03)00012-7. [DOI] [PubMed] [Google Scholar]
- Davis JW, 2nd, Lauer FT, Burdick AD, Hudson LG, Burchiel SW. Prevention of apoptosis by 2,3,7,8-tetrachlorodibenzo-p-dioxin (TCDD) in the MCF-10A cell line: correlation with increased transforming growth factor alpha production. Cancer Res. 2001;61:3314–3320. [PubMed] [Google Scholar]
- Davis JW, 2nd, Melendez K, Salas VM, Lauer FT, Burchiel SW. 2,3,7,8-Tetrachlorodibenzo-p-dioxin (TCDD) inhibits growth factor withdrawal-induced apoptosis in the human mammary epithelial cell line, MCF-10A. Carcinogenesis. 2000;21:881–886. doi: 10.1093/carcin/21.5.881. [DOI] [PubMed] [Google Scholar]
- Dinchuk JE, Focht RJ, Kelley JA, Henderson NL, Zolotarjova NI, Wynn R, Neff NT, Link J, Huber RM, Burn TC, Rupar MJ, Cunningham MR, Selling BH, Ma J, Stern AA, Hollis GF, Stein RB, Friedman PA. Absence of post-translational aspartyl beta-hydroxylation of epidermal growth factor domains in mice leads to developmental defects and an increased incidence of intestinal neoplasia. J Biol Chem. 2002;277:12970–12977. doi: 10.1074/jbc.M110389200. [DOI] [PubMed] [Google Scholar]
- Egan KM, Stampfer MJ, Hunter D, Hankinson S, Rosner BA, Holmes M, Willett WC, Colditz GA. Nurses’ Health Study. Active and passive smoking in breast cancer: prospective results from the Nurses’ Health Study. Epidemiology. 2002;13:138–145. doi: 10.1097/00001648-200203000-00007. [DOI] [PubMed] [Google Scholar]
- Ethier SP, Ullrich RL. Induction of mammary tumors in virgin female BALB/c mice by single low doses of 7,12-dimethylbenz[a]anthracene. J Natl Cancer Inst. 1982;69:1199–1203. [PubMed] [Google Scholar]
- Farmer PB, Singh R, Kaur B, Sram RJ, Binkova B, Kalina I, Popov TA, Garte S, Taioli E, Gabelova A, Cebulska-Wasilewska A. Molecular epidemiology studies of carcinogenic environmental pollutants. Effects of polycyclic aromatic hydrocarbons (PAHs) in environmental pollution on exogenous and oxidative DNA damage. Mutat Res. 2003;544:397–402. doi: 10.1016/j.mrrev.2003.09.002. [DOI] [PubMed] [Google Scholar]
- Gammon MD, Santella RM, Neugut AI, Eng SM, Teitelbaum SL, Paykin A, Levin B, Terry MB, Young TL, Wang LW, Wang Q, Britton JA, Wolff MS, Stellman SD, Hatch M, Kabat GC, Senie R, Garbowski G, Maffeo C, Montalvan P, Berkowitz G, Kemeny M, Citron M, Schnabel F, Schuss A, Hajdu S, Vinceguerra V. Environmental toxins and breast cancer on Long Island. I. Polycyclic aromatic hydrocarbon DNA adducts. Cancer Epidemiol Biomarkers Prev. 2002;11:677–685. [PubMed] [Google Scholar]
- Gao J, Voss AA, Pessah IN, Lauer FT, Penning TM, Burchiel SW. Ryanodine receptor-mediated rapid increase in intracellular calcium induced by 7,8-benzo(a)pyrene quinone in human and murine leukocytes. Toxicol Sci. 2005;87:419–426. doi: 10.1093/toxsci/kfi265. [DOI] [PubMed] [Google Scholar]
- Garkavtsev I, Kazarov A, Gudkov A, Riabowol K. Suppression of the novel growth inhibitor p33(ING1) promotes neoplastic transformation. Nature Genet. 1996;14:415–420. doi: 10.1038/ng1296-415. Note: Erratum: Nature Genet. (1999).23: 373 only. [DOI] [PubMed] [Google Scholar]
- Gipp JJ, Bailey HH, Mulcahy RT. Cloning and sequencing of the cDNA for the light subunit of human liver gamma-glutamylcysteine synthetase and relative mRNA levels for heavy and light subunits in human normal tissues. Biochem Biophys Res Commun. 1995;206:584–589. doi: 10.1006/bbrc.1995.1083. [DOI] [PubMed] [Google Scholar]
- Gipp JJ, Mulcahy RT. Structure of the human glutamate-L-cysteine ligase catalytic (GLCLC) subunit gene. Cytogenet Cell Genet. 2000;88130:132. doi: 10.1159/000015505. [DOI] [PubMed] [Google Scholar]
- International Agency for Research on Cancer. IARC Monographs. Volume 92 Air Pollution, Part 1. IARC Press; Lyon: 11–18 October, 2005. 2006. Some non-heterocyclic polycyclic aromatic hydrocarbons and some related exposures. [Google Scholar]
- Jenne DE, Tschopp J. Clusterin: the intriguing guises of a widely expressed glycoprotein. Trends Biochem Sci. 1992;17:154–159. doi: 10.1016/0968-0004(92)90325-4. [DOI] [PubMed] [Google Scholar]
- Jin Y, Penning TM. Aldo-Keto Reductases and Bioactivation/Detoxication. Annu Rev Pharmacol Toxicol. 2006 Sep 13; doi: 10.1146/annurev.pharmtox.47.120505.105337. [DOI] [PubMed] [Google Scholar]
- Joseph P, Klein-Szanto AJ, Jaiswal AK. Hydroquinones cause specific mutations and lead to cellular transformation and in vivo tumorigenesis. Br J Cancer. 1998;78:312–320. doi: 10.1038/bjc.1998.492. [DOI] [PMC free article] [PubMed] [Google Scholar]
- Kaleeba JA, Berger EA. Kaposi’s sarcoma-associated herpesvirus fusion-entry receptor: cystine transporter xCT. Science. 2006;311:1921–1924. doi: 10.1126/science.1120878. [DOI] [PubMed] [Google Scholar]
- Keshava C, Whipkey DL, Weston A. Transcriptional signatures of environmentally relevant exposures in normal human mammary epithelial cells: benzo[a]pyrene. Cancer Lett. 2005;221:201–211. doi: 10.1016/j.canlet.2004.08.037. [DOI] [PubMed] [Google Scholar]
- Kikuta Y, Kato M, Yamashita Y, Miyauchi Y, Tanaka K, Kamada N, Kusunose M. Human leukotriene B4 omega-hydroxylase (CYP4F3) gene: molecular cloning and chromosomal localization. DNA Cell Biol. 1998;17:221–230. doi: 10.1089/dna.1998.17.221. [DOI] [PubMed] [Google Scholar]
- Larson RA, Wang Y, Banerjee M, Wiemels J, Hartford C, Le Beau MM, Smith MT. Prevalence of the Inactivating 609C→T Polymorphism in the NAD(P)H:Quinone Oxidoreductase (NQO1) Gene in Patients With Primary and Therapy-Related Myeloid Leukemia. Blood. 1999;94:803–807. [PubMed] [Google Scholar]
- Lou H, Du S, Ji Q, Stolz A. Induction of AKR1C2 by phase II inducers: identification of a distal consensus antioxidant response element regulated by NRF2. Mol Pharmacol. 2006;69:1662–1672. doi: 10.1124/mol.105.019794. [DOI] [PubMed] [Google Scholar]
- Luch A. Nature and nurture - lessons from chemical carcinogenesis. Nat Rev Cancer. 2005;5:113–125. doi: 10.1038/nrc1546. [DOI] [PubMed] [Google Scholar]
- Mazur DJ, Perrino FW. Identification and expression of the TREX1 and TREX2 cDNA sequences encoding mammalian 3-prime-to-5-prime exonucleases. J Biol Chem. 1999;274:19655–19660. doi: 10.1074/jbc.274.28.19655. [DOI] [PubMed] [Google Scholar]
- Moinova HR, Mulcahy RT. An electrophile responsive element (EpRE) regulates beta-naphthoflavone induction of the human gamma-glutamylcysteine synthetase regulatory subunit gene. Constitutive expression is mediated by an adjacent AP-1 site. J Biol Chem. 1998;273:14683–14689. doi: 10.1074/jbc.273.24.14683. [DOI] [PubMed] [Google Scholar]
- Moore CJ, Tricomi WA, Gould MN. Interspecies comparison of polycyclic aromatic hydrocarbon metabolism in human and rat mammary epithelial cells. Cancer Res. 1986;46:4946–4952. [PubMed] [Google Scholar]
- Moorthy B, Miller KP, Jiang W, Williams ES, Kondraganti SR, Ramos KS. Role of cytochrome P4501B1 in benzo[a]pyrene bioactivation to DNA-binding metabolites in mouse vascular smooth muscle cells: evidence from 32P-postlabeling for formation of 3-hydroxybenzo[a]pyrene and benzo[a]pyrene-3,6-quinone as major proximate genotoxic intermediates. J Pharmacol Exp Ther. 2003;305:394–401. doi: 10.1124/jpet.102.044271. [DOI] [PubMed] [Google Scholar]
- Nguyen T, Yang CS, Pickett CB. The pathways and molecular mechanisms regulating Nrf2 activation in response to chemical stress. Free Radic Biol Med. 2004;37:433–441. doi: 10.1016/j.freeradbiomed.2004.04.033. [DOI] [PubMed] [Google Scholar]
- Park I, Chung J, Walsh CT, Yun Y, Strominger JL, Shin J. Phosphotyrosine-independent binding of a 62-kDa protein to the src homology 2 (SH2) domain of p56-lck and its regulation by phosphorylation of ser-59 in the lck unique N-terminal region. Proc Nat Acad Sci. 1995;92:12338–12342. doi: 10.1073/pnas.92.26.12338. [DOI] [PMC free article] [PubMed] [Google Scholar]
- Pelkonen O, Nebert DW. Metabolism of polycyclic aromatic hydrocarbons: etiologic role in carcinogenesis. Pharmacol Rev. 1982;34:189–222. [PubMed] [Google Scholar]
- Phelan D, Winter GM, Rogers WJ, Lam JC, Denison MS. Activation of the Ah receptor signal transduction pathway by bilirubin and biliverdin. Arch Biochem Biophys. 1998;357:155–163. doi: 10.1006/abbi.1998.0814. [DOI] [PubMed] [Google Scholar]
- Prawan A, Kundu JK, Surh YJ. Molecular basis of heme oxygenase-1 induction: implications for chemoprevention and chemoprotection. Antioxid Redox Signal. 2005;7:1688–1703. doi: 10.1089/ars.2005.7.1688. [DOI] [PubMed] [Google Scholar]
- Pruess-Schwartz D, Baird WM, Nikbakht A, Merrick BA, Selkirk JK. Benzo(a)pyrene:DNA adduct formation in normal human mammary epithelial cell cultures and the human mammary carcinoma T47D cell line. Cancer Res. 1986;46:2697–702. [PubMed] [Google Scholar]
- Radjendirane V, Jaiswal AK. Antioxidant response element-mediated 2,3,7,8-tetrachlorodibenzo-p-dioxin (TCDD) induction of human NAD(P)H:quinone oxidoreductase 1 gene expression. Biochem Pharmacol. 1999;58:1649–1655. doi: 10.1016/s0006-2952(99)00245-2. [DOI] [PubMed] [Google Scholar]
- Reed M, Monske M, Lauer F, Meserole S, Born J, Burchiel S. Benzo[a]pyrene diones are produced by photochemical and enzymatic oxidation and induce concentration-dependent decreases in the proliferative state of human pulmonary epithelial cells. J Toxicol Environ Health. 2003;66:1189–1205. doi: 10.1080/15287390306409. [DOI] [PubMed] [Google Scholar]
- Russo J, Russo IH. Experimentally induced mammary tumors in rats. Breast Cancer Res Treat. 1996;39:7–20. doi: 10.1007/BF01806074. [DOI] [PubMed] [Google Scholar]
- Shi H, Timmins G, Monske M, Burdick A, Kalyanaraman B, Liu Y, Clement JL, Burchiel S, Liu KJ. Evaluation of spin trapping agents and trapping conditions for detection of cell-generated reactive oxygen species. Arch Biochem Biophys. 2005;437:59–68. doi: 10.1016/j.abb.2005.02.028. [DOI] [PubMed] [Google Scholar]
- Shimada T, Guengerich FP. Inhibition of human cytochrome P450 1A1-, 1A2-, and 1B1-mediated activation of procarcinogens to genotoxic metabolites by polycyclic aromatic hydrocarbons. Chem Res Toxicol. 2006;19:288–294. doi: 10.1021/tx050291v. [DOI] [PubMed] [Google Scholar]
- Shimada T, Oda Y, Gillam EMJ, Guengerich FP, Inoue K. Metabolic activation of polycyclic aromatic hydrocarbons and other procarcinogens by cytochromes P450 1A1 and P450 1B1 allelic variants and other human cytochromes P450 in Salmonella typhimurium NM2009. Drug Metab Disp. 2001;29:1176–1182. [PubMed] [Google Scholar]
- Spink DC, Spink BC, Cao JQ, DePasquale JA, Pentecost BT, Fasco MJ, Li Y, Sutter TR. Differential expression of CYP1A1 and CYP1B1 in human breast epithelial cells and breast tumor cells. Carcinogenesis. 1998;19:291–298. doi: 10.1093/carcin/19.2.291. [DOI] [PubMed] [Google Scholar]
- Straif K, Baan R, Grosse Y, Secretan B, El Ghissassi F, Cogliano V. WHO International Agency for Research on Cancer Monograph Working Group. Carcinogenicity of polycyclic aromatic hydrocarbons. Lancet Oncol. 2005;6:931–932. doi: 10.1016/s1470-2045(05)70458-7. [DOI] [PubMed] [Google Scholar]
- Stampfer MR, Bartholomew JC, Smith HS, Bartley JC. Metabolism of benzo[a]pyrene by human mammary epithelial cells: toxicity and DNA adduct formation. Proc Natl Acad Sci U S A. 1981;78:6251–6255. doi: 10.1073/pnas.78.10.6251. [DOI] [PMC free article] [PubMed] [Google Scholar]
- Tannheimer SL, Barton SL, Ethier SP, Burchiel SW. Carcinogenic polycyclic aromatic hydrocarbons increase intracellular Ca2+ and cell proliferation in primary human mammary epithelial cells. Carcinogenesis. 1997;18:1177–82. doi: 10.1093/carcin/18.6.1177. [DOI] [PubMed] [Google Scholar]
- Tannheimer SL, Ethier SP, Caldwell KK, Burchiel SW. Benzo[a]pyrene- and TCDD-induced alterations in tyrosine phosphorylation and insulin-like growth factor signaling pathways in the MCF-10A human mammary epithelial cell line. Carcinogenesis. 1998;19:1291–1297. doi: 10.1093/carcin/19.7.1291. [DOI] [PubMed] [Google Scholar]
- Tannheimer SL, Lauer FT, Lane J, Burchiel SW. Factors influencing elevation of intracellular Ca2+ in the MCF-10A human mammary epithelial cell line by carcinogenic polycyclic aromatic hydrocarbons. Mol Carcinog. 1999;25:48–54. doi: 10.1002/(sici)1098-2744(199905)25:1<48::aid-mc6>3.0.co;2-6. [DOI] [PubMed] [Google Scholar]
- Vasiliou V, Pappa A, Estey T. Role of human aldehyde dehydrogenases in endobiotic and xenobiotic metabolism. Drug Metab Rev. 2004;36:279–299. doi: 10.1081/dmr-120034001. [DOI] [PubMed] [Google Scholar]
- Vasiliou V, Ross D, Nebert DW. Update of the NAD(P)H:quinone oxidoreductase (NQO) gene family. Hum Genomics. 2006;2:329–335. doi: 10.1186/1479-7364-2-5-329. [DOI] [PMC free article] [PubMed] [Google Scholar]
- Wooster R, Sutherland L, Ebner T, Clarke D, Da Cruz e Silva O, Burchell B. Cloning and stable expression of a new member of the human liver phenol/bilirubin:UDP-glucuronosyltransferase cDNA family. Biochem J. 1991;278:465–469. doi: 10.1042/bj2780465. [DOI] [PMC free article] [PubMed] [Google Scholar]
- Zhu H, Li Y, Trush MA. Characterization of benzo[a]pyrene quinone-induced toxicity to primary cultured bone marrow stromal cells from DBA/2 mice: potential role of mitochondrial dysfunction. Toxicol Appl Pharmacol. 1995;130:108–120. doi: 10.1006/taap.1995.1015. [DOI] [PubMed] [Google Scholar]