

Abstract
Background
Visual P300 is consistently lower in alcohol dependent individuals, their offspring and subjects at risk. Delta and theta event related oscillations (ERO) are the major contributors to the P300 signal. The total and evoked power in delta and theta bands in the 300 to 700 millisecond post-stimulus window (corresponding to the zone of P3 maxima) was compared between adolescent offspring of alcoholics (high-risk) and age-matched normal controls (low-risk), to assess the utility of the risk markers.
Methods
EEG was recorded during the performance of visual oddball task. The S-Transform algorithm decomposed the EEG signals into different frequency bands and the group differences in total and evoked power in the oscillatory responses during the P300 time window (300 to 700 ms) were analyzed using a multivariate design. Similar analysis was performed on P300 peak amplitudes for the target.
Results
The high-risk group showed significantly lower parietal post-stimulus evoked and total power in the delta band for targets. A decrease in total power was seen centrally and parietally in theta band. The P300 peak amplitude in the parietal electrodes was also significantly lower in the high-risk group.
Conclusions
The decreased total theta power and total and evoked delta power for visual targets in high risk individuals may serve as an endophenotypic marker in the development of alcoholism and other disinhibitory disorders. The differences seen between the offspring of alcoholics and controls may have a cholinergic basis. The ERO measures appear to be more robust than the P300 amplitude in differentiating the groups.
Keywords: Offspring of Alcoholics, Endophenotype, Event-related Oscillations, Delta, Theta, P300
1. Introduction
Using electrophysiological measures as endophenotypes is proving to be a very useful tool in the study of psychiatric genetics. The protocol of determining and establishing an endophenotype has also been refined in the process (Porjesz et al., 2005). One of the important criteria for an endophenotype is that in addition to the affected individuals, the trait must also be present in the unaffected relatives and children of the affected individuals at a rate higher than the general population. The P300 or P3b component of the visual event-related potential (ERP) has proved to be a successful endophenotype in the study of alcoholism and an associated spectrum of externalizing disorders (Iacono et al., 2003;Porjesz et al., 1998). The P300 component is a positive going wave that occurs between 300-700 ms after a ‘significant’ or ‘rare’ stimulus and is not related to its physical features. The responses to a task unrelated rare stimulus produces the P3a, which is more pronounced frontally; while the responses to the task related rare stimulus (target) produces the P3b, which has a parietal maxima. The finding of low voltage P300 amplitudes in prepubescent sons of alcoholic fathers compared to boys without first or second degree alcoholic relatives in experiments, without the administration of alcohol or placebo, was first reported by Begleiter et al. (1984). The P300 amplitude decrements do not recover with abstinence (Porjesz and Begleiter, 1985), and therefore suggesting that reduced P300 amplitude antecedes the development of alcoholism. The P300 amplitude reduction has been replicated under different experimental conditions, with and without alcohol administration, in both older and younger subjects at risk, in male and female offspring and in subjects of different ethnicities (Begleiter et al., 1987;Benegal et al., 1995;Berman et al., 1993;Cohen et al., 1997;Ehlers et al., 2003;Ehlers et al., 2001;Hill and Steinhauer, 1993;Kamarajan et al., 2005b;O′Connor et al., 1986;O′Connor et al., 1987;Porjesz and Begleiter, 1990;Ramachandran et al., 1996;Ratsma et al., 2001;Rodriguez Holguin et al., 1999; Steinhauer and Hill, 1993;Van der Stelt et al., 1998). The lowered P300 amplitude observed in clinical sample of alcoholics has also been established in community samples (Iacono et al 2002). A meta-analysis concluded that low P300 may have predictive value as an index of vulnerability for alcoholism (Polich et al., 1994).
The P300 has been proposed to reflect attentional allocation and context updating processes of working memory (Polich and Herbst, 2000); cognitive closure (Desmedt, 1980), and is probably associated with activation of inhibitory processes over widespread cortical areas (Birbaumer et al., 1990;Desmedt, 1980;Rockstroh et al., 1992;Tomberg and Desmedt, 1998;Verleger, 1988). The amplitude of P300 reflects inhibitory processes of irrelevant stimuli (Birbaumer et al., 1990;Desmedt, 1980;Klimesch et al., 2000), while its time of occurrence (latency) reflects mental processing speed (Polich and Herbst, 2000); the earlier and larger the P300, the easier the processing.
Evidence suggests that ERP features arise from ‘superpositioned neuroelectric oscillations’ modulated or produced by sensory and cognitive processes set into the dynamics of ongoing EEG rhythms (Basar-Eroglu and Basar, 1991;Basar-Eroglu et al., 1992;Basar-Eroglu and Demiralp, 2001;Demiralp et al., 2001;Karakas et al., 2000a;Karakas et al., 2000b;Klimesch et al., 2004;Schurmann et al., 1995;Schurmann and Basar, 2001;Yordanova and Kolev, 1996;Yordanova and Kolev, 1998a). These neuroelectric oscillations when analyzed in the context of stimulus-related brain function can be termed event related oscillations or EROs. Two competing theories have tried to explain the genesis of averaged event-related potential (ERP) features and dominate the current literature: (a) Evoked model - that ERPs originate from an event-related activation of neural assemblies distinct from background dynamics and (b) Phase-reset model - that ERPs are produced by phase resetting of ongoing oscillatory activity (Basar, 1980;Brandt, 1997;Makeig et al., 2002;Schack and Klimesch, 2002;Tallon-Baudry et al., 1999;Tesche and Karhu, 2000). The debate is ongoing; however, it is likely that both aspects - event-related activation of neural assemblies and phase resetting of ongoing activity, are involved in the generation of late ERP components. Studies suggest that separate analysis of event-related power and phase-locking changes in cognitive tasks might reveal specific insights into the mechanisms underlying different cognitive functions (Fell et al., 2004;Shah et al., 2004). Although an enhancement of EEG power is thought to correspond to an activation of a larger number of neural assemblies (Lopes da Silva, 1993), the interpretation of increased intertrial phase locking is more difficult define.
Since the proposal byStampfer and Basar (1985), the importance of the underlying delta and theta brain oscillations in the production of the P300 potential to a rare target stimulus has been extensively examined (Schurmann et al., 2001b;Basar et al., 1999;Basar-Eroglu et al., 1992;Demiralp et al. 2001, Yordonova and Kolev, 1996). According to Verleger (1995), the main portion of P300 power is not within the theta band, but within sub-delta and delta bands, especially as P300 is virtually abolished with a high-pass setting at 1.0 Hz (Duncan-Johnson and Donchin, 1979) or of 2.0 Hz (Jodo and Kayama, 1992). There is considerable debate if these frequency bands are independent functional entities from the P300 component. Some studies indicate that event-related theta activity may not only contribute directly to P300 waveform expression, but may also modify P300 via other processes in the theta frequency channel of the EEG (Kolev et al., 1994;Yordanova and Kolev, 1996). Modality independent transient theta-dominated state may reflect a processing stage that is obligatory for stimulus evaluation (Yordanova et al., 2002).
Cognitive correlates of oscillations & cognition in alcoholism
Karakas et al. (2000b)hypothesized that the delta response represents degrees of consciousness involved during conscious stimulus evaluation and memory updating, and that the theta oscillation represents different levels and forms of attention. Some authors believe that delta response may be generated by cortico-cortical interactions (Devrim et al., 1999). Studies on normal individuals indicated that the delta response is possibly related to signal detection and decision making generated by a distributed network system (Basar-Eroglu et al., 1992;Basar et al., 1999;Schurmann et al., 2001a). On the other hand, event-related theta oscillations are believed to be related to fronto-limbic interactions (Basar et al., 1999;Karakas et al., 2000b;Miller et al., 1991), and are associated with a complex set of cognitive processes including alertness, arousal or readiness (Basar et al., 1999), memory-related processes (Yordanova and Kolev, 1998b), episodic encoding and retrieval processes, as revealed by event-related desynchronization/synchronization, (Klimesch et al., 1997;Klimesch et al., 1994) and selective attention and short-term memory (Basar-Eroglu et al., 1992;Basar et al., 1997;Demiralp and Basar, 1992;Karakas, 1997;Klimesch., 1999). Therefore individuals with suppressed delta and theta responses are likely to show deficits in cognitive functions that are mediated by these oscillatory processes. There is ample neuropsychological evidence that supports this view, by demonstrating a wide range of cognitive deficits in the domain of executive functions (including attention, working memory, encoding and retrieval processes) in alcoholics and high risk individuals (Fein et al., 1990;Moselhy et al., 2001;Nixon and Tivis, 1997;Ratti et al., 2002).
As discussed earlier, there is ample evidence in the literature on lowered P300 in adolescents associated with family history of alcoholism. We have demonstrated earlier that power in theta and delta bands in the 300-700 msec window were significantly lower in adult alcoholics when compared with age-matched controls (Jones et al., in press;Porjesz and Begleiter, 2003). In addition, our study using logistic regression procedures suggests that each band (theta and delta) provides unique information and as a composite variable effectively discriminates between control and alcohol-dependent subjects (Jones et al., in press). The primary purpose of the present study was to assess if the lower theta and delta band power, seen previously in the alcohol-dependent subjects, were a “trait” markers for alcoholism. This study was designed to evaluate the neural oscillatory activity in the theta and delta frequency ranges, within the temporal window of the P300 response to the visual target, in adolescent offspring of alcoholics who are considered at high risk for developing alcoholism. We have attempted to examine phase-locked frequency band changes by examining evoked power in these bands; and in order to assess non-phase locked contributions, which is difficult to quantify, we have opted to compare total power (which includes both types) in these bands. We hypothesize that the total and/or evoked power in these frequencies might differentiate the groups in a way similar to what has been observed for the P300 component, thereby validating these measures as trait markers of risk.
2. METHODS and MATERIALS
2.1. Sample background
Subjects were participants in the ongoing Collaborative Study on the Genetics of Alcoholism (COGA), a multisite multi-stage national consortium designed to study the genetics of alcoholism. The collaborative sites are located at: SUNY- Downstate Medical Center at Brooklyn, University of Connecticut Health Center, Washington University School of Medicine in St. Louis, University of California at San Diego, University of Iowa and Indiana University School of Medicine. A detailed description of the COGA recruitment procedure has been described previously (Begleiter et al., 1995). The institutional review board at each site approved the research procedures in the COGA study and written consent was obtained from each individual prior to participation. Alcoholic probands were recruited from inpatient and outpatient treatment facilities, and they and their first degree relatives were interviewed with the SSAGA (Semi Structured Assessment of Genetics of Alcoholism), a semi-structured diagnostic psychiatric interview schedule designed by COGA investigators (Bucholz et al., 1994;Hesselbrock et al., 1999). Subjects under the age of 18 years were administered the child/adolescent version of SSAGA, called the CSSAGA. Families in which the proband and two additional first-degree relatives met lifetime criteria for alcohol dependence by both Feighner and DSM-IIIR criteria were designated Stage II, and extended family members were also interviewed. From the Stage II family members, blood was drawn for establishing lymphoblastoid cell lines and biochemical analyses, and neurophysiological and neuropsychological assessments were conducted. Control families were recruited from HMOs, drivers’ license records, and dental clinics, with the objective of being representative of the general population at each site. The control families were interviewed with the SSAGA/CSSAGA, and underwent the full Stage II protocol.
The exclusion criteria for neurophysiological assessment were as follows:. Subjects were excluded (1) if presence of alcohol was detected when tested with the breath analyzer; (2) hepatic encephalopathy/cirrhosis of the liver, or acute/chronic illness were present; (3) a significant history of head injury, seizures or neurosurgical procedures was present (4) uncorrected sensory deficits were manifested; (5) if tested positive for HIV; (6) if they were on medication affecting/influencing brain functioning or had used any psychoactive substances in the past 5 days; (7) if any history or symptom of psychoses; and (8) if symptoms of current depression was present. Subjects were not excluded if they had a lifetime depression diagnosis.
2.2. Sample used in the present study
Two groups of subjects in the age range of 14 – 17 years were selected from the COGA and Control families. The High Risk (HR) group comprised 98 adolescent offspring of alcoholics (56 males and 42 females) from COGA families. The Low Risk (LR) group comprised 48 adolescents (22 males and 26 females) from control families, in which there were no first degree relatives with a diagnosis of DSM IIIR alcohol dependence by direct interview. The HR group had a parental diagnosis of alcoholism for either or both parents. The LR sample was controlled for alcoholism and substance use/abuse and the base rate of other co-occurring conditions in LR and HR sample was maintained. The clinical details of the 14-17 year olds is tabulated in the Table 1. The samples were matched for age, but not matched on drug use and other Axis I conditions since the reported rates for some conditions in subjects with family history of alcoholism are elevated over normal population levels (Cuijpers et al., 1999;Nurnberger et al., 2004;Sher et al., 1991). The sample of the present study differs from most published high risk studies with respect to the following point - The status of alcoholism in all the index subjects and their first-degree relatives have been diagnosed and confirmed by individual assessment using the SSAGA, and corroborated with the family history assessment module (FHAM).
Table 1. Details of the study sample.
| Low risk | High risk | |
|---|---|---|
| Age [Mean (sd)] | 15.8 (1.1) | 15.8 (1.2) |
| Diagnoses (DSM IIIR) | ||
| Alcohol Dependence | 0 % | 4 % |
| Conduct Disorder | 6% | 19 % |
| Oppositional Defiance Disorder | 2 % | 9 % |
| ADHD | 2 % | 4 % |
| Marijuana Dependence | 0 % | 4 % |
| Depression (lifetime) | 6 % | 14 % |
| Overanxious | 8.5 % | 8 % |
2.3. Task Description
The Visual oddball task consisted of the presentation of three types of visual stimuli – non-target (n = 210), target (n = 35) and novel (n = 35), each stimuli with a 60 msec duration and subtending a visual angle of 2.5 degrees. The interstimulus interval was 1.625 sec. Subjects responded with a button press to the rare target stimulus (X) the responding hand was alternated across subjects to counterbalance any laterality effects due to responding. The subject was not required to respond to the non-target (squares) and novel stimuli (colored polygons).
2.4 Data Recording
All six collaborating sites used identical experimental procedures and EEG acquisition hardware and software. Subjects were seated comfortably in a dimly lit sound-attenuated temperature-regulated booth (Industrial Acoustics Company; Bronx, NY) and instructed to remain relaxed and respond to the target stimulus with a button press with their dominant hand. Each subject wore a fitted electrode cap (Electro-Cap International Inc.; Eaton, OH) using the 19-channel montage as specified according to the 10–20 International system [FP1, FP2, F7, F3, Fz, F4, F8, T7, C3, Cz, C4, T8, P7, P3, Pz, P4, P8, O1, O2]. The nose served as reference and the forehead was the ground electrode. Electrode impedances were always maintained below 5 k Ω Electrical activity was amplified 10,000 times by Sensorium EPA-2 Electrophysiology amplifiers (Charlotte, VT), with a band pass between 0.02 Hz to 50 Hz and digitized on a Concurrent 5550 computer (Concurrent Computer Corp. Atlanta, GA). The sampling rate was 256 Hz. Electrooculogram (EOG) was recorded from electrodes placed supraorbitally and at the outer canthus of the left eye. Eye movements were monitored to perform ocular artifact correction using a regression based correction method (Croft et al., 2000, Gratton et al., 1983), combined with a variable thresholding procedure.
2.5. Data reduction and Statistical analysis
To obtain estimates of localized power of nonstationary evoked potential time series we employed a recently developed time-frequency representation method: the S-transform (Chu 1996;Stockwell 1996;Theophanis 2000). The S-transform is a generalization of the Gabor transform (Gabor 1946)and an extension to the continuous wavelet transform. The S-transform generates a time-frequency representation (TFR) of a signal by integrating the signal at each time point with a series of windowed harmonics of various frequencies. The S-transform TFR is computed by shifting the window function down the signal in time across a range of frequencies. The window function is Gaussian and scales in width according to the examined frequency. This inverse dependence of the width of the Gaussian window with frequency provides the frequency-dependent resolution. The amplitude envelope of the complex-valued S-transform TFR is calculated by taking the absolute value. This method has been previously described in a genetic linkage study of delta and theta EROs during the same visual oddball paradigm employed in the present study (Jones et al., 2004; Jones et al, in press; see Appendix I).
The electrophysiological data used in the analysis were derived from visual oddball trials for target cases, since our major objective was to compare high-risk and controls during target stimulus processing. EEG segments from 9 channels (F3, Fz, F4, C3, Cz, C4, P3, Pz, P4) were used in order to assess topographic aspects of the ERO measures. The total epoch length used for analysis was 1500 milliseconds; this included a 500 millisecond prestimulus baseline.
Two types of time-frequency response (TFR) distributions were created using the S-transform. The trial averaged data for target cases were used to obtain the evoked TFR. The total TFR distribution was acquired by calculating an average of each TFR distribution of individual target trials after they were baseline corrected to remove DC shifts. The total TFR representation, when compared to the evoked TFR data, show greater amounts of energy occurring throughout the trial period at both high and low frequencies. This reflects the inclusion of energy which is not phase locked to the stimulus onset in the total power response. Mean values for both total and evoked power were calculated from the respective TFR amplitude envelope, within time-frequency regions of interest (TFROI’s) (Lachaux et al., 2003) specified by frequency band ranges and time intervals. This study focused on TFROI corresponding to the theta (4-7 Hz) and delta (1-3 Hz) frequency band in the 300 to 700 ms time window. The time window was based on the temporal extent of the P300 component in the event-related waveform for targets (See Figure 1 and 2). The average peak latency of the P300 for all subjects was 436 milliseconds.
FIGURE 1.

VP3 grand mean waveforms for the parietal leads for low risk (red) and high risk (green) groups. Dashed box indicates the dimensions of time window used for time-frequency analysis.
FIGURE 2.

Theta band (4-7 Hz): Time x Frequency plots at Fz electrode for low and high risk population, z-scored for each frequency. Insets – head plots for the time frequency region of interest (TFROI)
Total and evoked band power in the theta and delta band in 9 channels ( F3, Fz, F4, C3, Cz, C4, P3, Pz, P4) were log transformed and group differences were evaluated using a full factorial multivariate design (MANOVA, SPSS 10.0), with group and gender main and interaction effects. Age was not used in the model since preliminary analysis revealed near zero correlation with the total and evoked power data and the groups had a narrow age range (14-17) and no significant mean age difference (see Table 1 for mean age for the two groups). In the instances where group effect was significant, secondary analysis included‘t’ tests as post hoc analysis for group differences at each electrode position.
Based on the indications of most past research studies on visual P300 in alcoholism and risk, the ERP component of interest in this study was the parietal P300 (Porjesz et al 2005). Hence, the EEG segments for the target case only were used for the time-requency analysis and only the parietal leads (P3, Pz and P4) were used for P300 amplitude measurements. The grand mean waveforms are shown in Figure 1. Group differences in P300 amplitude measurements were evaluated using a full factorial multivariate design (MANOVA, SPSS 10.0), with group and gender main and interaction effects.
3. Results
3.1. P3 peak amplitude
The mean P3 amplitudes at P3 and Pz electrode positions were higher in LR individuals when compared to the HR individuals and almost equal at P4 (Figure 1 and Table 2). The Group main effect was however, significant (F (3,137) = 2.84; p = 0.040) and the gender main effect and group and gender interaction were not significant (Table 3).
Table 2. VP3 mean amplitude.
| Group | N | Mean | Std Err | |
|---|---|---|---|---|
| P3 | low risk | 46 | 26.05 | 1.42 |
| high risk | 97 | 24.10 | 0.95 | |
| Pz | low risk | 46 | 30.77 | 1.54 |
| high risk | 97 | 28.86 | 1.02 | |
| P4 | low risk | 46 | 24.25 | 1.41 |
| high risk | 97 | 24.29 | 0.98 |
Table 3. Multivariate Tests - VP3 Amplitude.
| Effect | N | F | Sig. |
|---|---|---|---|
| Group | 46 Low risk 97 High risk | 2.841 | .040 |
| Gender | 76 Males 67 Females | 1.602 | .192 |
| Group * Gender | 1.277 | .285 |
3.2. Total Power in the 300 – 700 millisecond window
Total power time frequency distributions for Theta and Delta band and their topographic spread is illustrated in Figures 2 and 3. LR (control) subjects had higher total band power for delta and theta bands in all 9 electrodes, when compared to the HR (offspring of alcoholics) (Figure 2 and 3). Significant Group main effect was present for both Delta (F (9,134) = 2.65; p = 0.007) (Table 4) and Theta (F (9,133) = 1.997; p = 0.044) (Table 5); Gender main effect and Group and Gender interaction effect were not significant.
FIGURE 3.
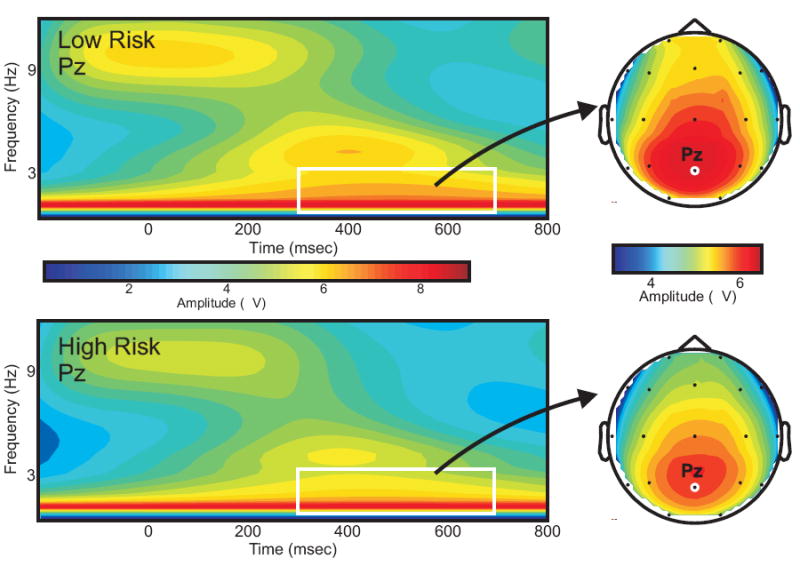
Delta band (1-3 Hz): Time x Frequency plots at Pz electrode for low and high risk population, z-scored for each frequency. Insets – head plots for the time frequency region of interest (TFROI)
Table 4. Multivariate Tests- Delta Band (1-3 Hz).
| Effect | N | F | Sig. | |
|---|---|---|---|---|
| TOTAL POWER | Group | 48 Low risk 98 High risk | 2.652 | .007 |
| Gender | 78 Males 68 Females | 1.599 | .122 | |
| Group * Gender | 1.628 | .113 | ||
| EVOKED POWER | Group | 48 Low risk 98 High risk | 4.74 | .000 |
| Gender | 78 Males 68 Females | 1.68 | .099 | |
| Group * Gender | 0.81 | .606 |
Table 5. Multivariate Tests - Theta Band (4-7 Hz).
| Effect | N | F | Sig. | |
|---|---|---|---|---|
| TOTAL POWER | Group | 47 Low risk 98 High risk | 1.997 | .044 |
| Gender | 77 Males 68 Females | .681 | .725 | |
| Group * Gender | .647 | .755 | ||
| EVOKED POWER | Group | 47 Low risk 98 Highrisk | 1.595 | .123 |
| Gender | 77 Males 68 Females | 1.154 | .330 | |
| Group * Gender | 0.786 | .630 |
3.2.1. Secondary analysis
The post hoc comparisons (t test) at each electrode revealed interesting differences for delta and theta bands (Table 6 and 7). Theta band differences were stronger and significant at the three central (C3, Cz, C4) and parietal (P3, Pz, P4) electrodes. The Bonferroni correction for multiple comparisons retained significance at all three parietal and two central leads. Delta band power showed weak significance for differences at P3 and Pz locations only, and these significances were lost after bonferroni correction, indicating a global decrease in total power in this band.
Table 6. Delta Mean log total power and post-hoc tests.
| DELTA | low risk (48) | high risk (98) | t-Test | ||||
|---|---|---|---|---|---|---|---|
| Mean | std dev | Mean | std dev | t | df | P | |
| F3 | 1.64 | 0.25 | 1.57 | 0.29 | 1.66 | 109.3 | 0.101 |
| FZ | 1.70 | 0.23 | 1.62 | 0.29 | 1.72 | 114.2 | 0.088 |
| F4 | 1.66 | 0.27 | 1.59 | 0.30 | 1.43 | 103.1 | 0.156 |
| C3 | 1.73 | 0.21 | 1.68 | 0.28 | 1.31 | 121.1 | 0.193 |
| CZ | 1.82 | 0.20 | 1.77 | 0.27 | 1.39 | 122.0 | 0.169 |
| C4 | 1.74 | 0.21 | 1.70 | 0.28 | 0.99 | 122.5 | 0.322 |
| P3 | 1.84 | 0.19 | 1.75 | 0.27 | 2.44 | 127.5 | 0.016 |
| PZ | 1.92 | 0.19 | 1.82 | 0.27 | 2.34 | 125.8 | 0.021 |
| P4 | 1.81 | 0.18 | 1.75 | 0.27 | 1.58 | 129.2 | 0.116 |
Table 7. Theta Mean log total power and post-hoc tests.
| THETA | low risk (47) | high risk (98) | t-test | ||||
|---|---|---|---|---|---|---|---|
| Mean | std dev | Mean | std dev | t | df | p | |
| F3 | 1.57 | 0.27 | 1.49 | 0.30 | 1.60 | 99.4 | 0.113 |
| FZ | 1.71 | 0.26 | 1.62 | 0.29 | 1.84 | 99.8 | 0.069 |
| F4 | 1.58 | 0.27 | 1.49 | 0.29 | 1.92 | 98.7 | 0.058 |
| C3 | 1.62 | 0.21 | 1.50 | 0.29 | 2.96 | 120.8 | 0.004 |
| CZ | 1.79 | 0.20 | 1.63 | 0.30 | 3.81 | 128.4 | 0.000 |
| C4 | 1.61 | 0.20 | 1.49 | 0.30 | 2.83 | 129.5 | 0.005 |
| P3 | 1.55 | 0.19 | 1.42 | 0.29 | 3.33 | 129.4 | 0.001 |
| PZ | 1.63 | 0.18 | 1.48 | 0.29 | 3.94 | 131.1 | 0.000 |
| P4 | 1.54 | 0.17 | 1.40 | 0.30 | 3.53 | 136.8 | 0.001 |
3.3. Evoked power in the 300 – 700 millisecond window
LR subjects had higher mean evoked band power for Delta and Theta bands in all 9 electrodes, when compared to the HR (offspring of alcoholics). However, significant Group main effect was present only for Delta band (F (9,134) = 4.74; p = 0.000); Gender main effect and Group and Gender interaction effect were not significant (Table 4). Theta and differences were not significant (Table 5).
3.3.1. Secondary analysis
The post hoc comparisons (t test) at each electrode revealed weakly significant differences at P3 and Pz locations for the delta band, and these significances were lost after bonferroni correction, again indicating that the differences are global.
4. DISCUSSION
The study results show that HR adolescents have reduced total theta (4-7 Hz) and delta (1-3 Hz) power in the 300 to 700 millisecond time window after the target stimulus. The reduction in total power was most prominent for the theta band and the topography was centroparietal; the delta band changes were less robust but significant and largely parietal in location. Evoked power, which highlights the phase locked osscilatory components, revealed no significant differences between the groups for the theta band although it was observed that the HR had lower values than LR. Evoked delta power on the other hand revealed highly significant group differences overall. The P300 amplitude in the parietal leads (P3, Pz and P4) was also significantly lower in the HR adolescents when analyzed using a multivariate model.
Previously published and ongoing studies from our group have examined theta and delta oscillations in adult populations (both alcohol dependent and high risk) for the standard visual oddball and go-nogo tasks (Jones et al., in preparation; Kamarajan et al., 2004;Kamarajan et al., 2005a;Kamarajan et al., 2005b). The results from those studies strongly support the present study that extends similar findings into HR adolescent population.
Results from visual targets in the case-control study (Jones et al., in press) in adult controls and alcohol dependent subjects revealed, that total theta band power and evoked delta band power at the frontal locus (Fz) best predicts the status of alcohol-dependence in an adult population.
Using go-nogo tasks several studies from our laboratory have shown P300, delta and theta power differences in alcoholics and high risk individuals (Kamarajan et al., 2004;Kamarajan et al., 2005a;Kamarajan et al., 2005b). In these studies the ‘go’ trials closely resemble the ‘target’ trial used in the present study. The authors have reported robust P3 amplitude reductions in the parietal region of the alcoholic sample for the ‘go” trials (Kamarajan et al., 2005b). In the Go condition, strong delta band total ERO deficits for alcoholics were observed over frontal, parietal and occipital locations; however, no theta band differences were noted in alcoholics when compared to the controls (Kamarajan et al., 2004). In the high-risk adult population the results for the same task revealed parietal delta and theta band total power reductions for the Go condition (Kamarajan et al., 2005a). The No-go condition also revealed strong delta and theta band ERO differences. The delta band differences were again widespread, whereas the theta band differences were focused in frontal electrode positions.
In the present study HR adolescents show power deficiencies in both delta and theta bands; however, theta band differences were stronger using the total power measure while delta differences were marginally better for the evoked power measure. One possible interpretation of the theta band findings could be related to slight trial-to-trial temporal jitter (variation). Trial-averaging of the ERP waveform will diminish imperfectly phase-locked theta band oscillations in the evoked power measure while the total power measure will retain this energy and therefore provide a better estimate of evoked theta ERO’s. This temporal jitter is less likely to affect the averaging of the lower frequency delta band oscillations, due to the lower temporal resolution, therefore the evoked power measure may adequately represent the delta ERO’s.
The similar results from our laboratory, across two paradigms, indicate that the ERO measures are stable and consistent across the two age groups (adults and adolescents) in discriminating the affected and risk states. However, the topographic locus of group differences, between the high risk and their controls in the present study and the alcoholics and controls as reported in the Jones et al. study (in press), were not similar. Lowered total theta power had a frontal focus in adult alcoholics, while adolescent high-risk subjects manifested a centroparietal focus. Further investigations are required to verify contributions from differences in cognitive style or developmental changes between adolescents and adults in the maturation of these electrophysiological responses.
4.1. P300 amplitude changes
The developmental changes in P300 amplitude and topography in have been explored by very few cross-sectional normative studies in the visual modality (Courchesne, 1977;Courchesne, 1978). The amplitudes of visual P300 have been reported to decrease with age in children and adolescents. Robust longitudinal studies of normal developmental changes in P300 are lacking. However, these studies have clearly demonstrated that ERP characteristics change substantially from children to adults. The transition in the ERP waveform occurs in the mid-teens and was suggested to reflect differences in the way children and adults categorize events (Courchesne, 1978). The effect of age is critical in uncovering P300 amplitude differences by alcoholism risk status as suggested by a meta-analysis study (Polich et al., 1994). The largest effect sizes observed were between high- and low-risk subjects under 18 years old. However, with more difficult visual paradigms the effect sizes for the two age groups converged. Hill and colleagues in their studies on developmental patterns of P300 in children and adolescents postulated that a developmental delay resulted in the lowered amplitudes of P300 seen in high risk children (Hill et al., 1999). The authors also suggested that the visual P3 amplitudes had a ‘theoretical point of convergence’ around the age of 22 for high risk and low risk subjects. However, many studies have established robust visual P300 differences in young adult high risk subjects (Porjesz et al., 2005). Alternatively, the differences may arise due to altered topography of the cognitive potentials in younger versus the older subjects. Moreover, Hill et al. (1999)also report gender differences in the P3 growth trajectories. They observe lower starting amplitudes and a slower decrease in visual P3 amplitudes with age in high risk boys and a faster growth rate and higher amplitudes of P3 in high risk girls in contrast to the respective low risk groups.
The age range of subjects in the present study spans mid to late adolescence. Although there are no significant gender effects, analyzing both genders as one sample could increase the variability of P3 amplitudes observed here. This might explain the observed weak P3 differences in this HR sample.
4.2. Event-related Theta band changes
There is convincing evidence that EEG oscillations in the theta frequency range (about 4–7 Hz) are related to working memory tasks (for an extensive review seeKlimesch, 1999). EEG theta power was reported to increase when information is encoded (Klimesch et al., 1994) or retrieved (Klimesch et al., 2001) from long-term memory. This phasic power enhancement is related to memory performance (Doppelmayr et al., 2000;Klimesch et al., 1996;Klimesch et al., 1997) as well as to task load (Gevins et al., 1997;Jensen and Tesche, 2002). Another study reported increased coupling of theta oscillations between prefrontal and parietal cortices during the retention interval of memory tasks (Sarnthein et al.,1998). Some authors have also shown that evoked theta oscillations spread from anterior to posterior regions during a combined short- and long-term memory task (Sauseng et al., 2002). During actual retrieval however, theta oscillations were reversed and spread from posterior to anterior sites. In another study the external stimulus processing produced a transient highly ordered microstate that did not depend on stimulus modality. This state was consistently determined by synchronized theta oscillations and had a specific anterior distribution. The stimulus-locked theta state may reflect a processing stage during which interfering activations from other frequency networks are minimized (Yordanova et al., 2002).
Developmental changes in the event-related theta response have been reported by one study for the auditory stimulus response in children between the ages of 6 to 10 years and adults between the ages of 20 to 30 years (Yordanova and Kolev, 1998a). The authors observed significant developmental decreases in theta response amplitudes in the early (0 – 300 msecs) and late (300 – 600 msecs) time windows of the passive, non-target and target related epochs. However, the maximal amplitudes of theta in both time windows were always higher for children when compared to the adults. Regression analysis suggested that this age related decrease in amplitude resulted from developmental decrease of baseline theta amplitudes in the ongoing EEG theta activity. Finally, the authors also report on increasing phase-locking capabilities with age, and suggest that the capacity to produce stable, enhanced theta responses probably reaches maturity well beyond the age of 10 years. The developmental increase in phase locking may probably be related to a lack of group difference in evoked theta power noted in the present study sample that comprised of adolescent HR. This issue is underscored by another study from our group (Jones et al., in press), where similar analyses were conducted on an adult population, significant evoked theta differences were noted. Moreover, no significant differences were seen in absolute power of theta band when the resting EEG of the HR and LR subjects were examined (Rangaswamy, M., unpublished findings) and we have previously observed and reported theta power differences in the resting EEG only in alcohol dependent subjects (Rangaswamy et al., 2003).
Although there are no studies that report developmental changes in the visual modality, one could speculate the changes could be of similar nature to the one reported for auditory modality (Yordanova and Kolev, 1997). The topography of the group differences between HR and LR adolescents in the present study was strongly central and parietal for the total theta power. Evoked theta power was not significantly different between the two groups, although few electrode locations in central and parietal regions showed weakly significant differences. Kamarajan et al. (2006)in a study of oscillations in adult high risk offspring in a Go-Nogo P3 paradigm, also report a strongly reduced theta band power only in the parietal regions for the Go condition. The responses to the Go condition in this task closely resemble the oddball target condition, although the stimuli used in the task are different. The topography of reduced theta power as reported for alcoholics involves a topographically frontal component (Jones et al., in preparation; (Kamarajan et al., 2004). It has been suggested by Basar (1992), that a diffuse and distributed theta system exists in the brain. It remains to be investigated if different aspects of the theta system are affected in the two groups, viz. alcoholics and high risk.
4.2.1. Genetic issues
The present study strongly indicates adolescent offspring of alcoholics (HR) appear to have a weaker or a possibly less organized theta system than the control (LR) subjects and reduced post-stimulus theta power may be a strong endophenotype for alcoholism and related disorders. The underlying mechanism of impaired organization may involve the cholinergic systems. Jones et al. (2004)have reported significant linkage and linkage disequilibrium between target case frontal theta band in visual evoked brain oscillations and a single nucleotide polymorphism (SNP) from the cholinergic muscarinic receptor gene (CHRM2) on chromosome 7. These findings were not observed for the equivalent non-target case data, suggesting a role for the CHRM2 gene in higher cognitive processing in humans. In another study that evaluated whether genetic variation in the CHRM2 gene was also a risk factor for the correlated clinical characteristics of alcoholism and depression, the findings provided strong evidence that variants within or close to the CHRM2 locus influence risk for two common psychiatric disorders – alcohol dependence and major depression (Wang et al., 2004).
4.3. Event-related Delta band changes
Studies exploring the time course of oscillatory changes underlying the target stimulus response suggest that delta oscillations contribute considerably and mainly to the P300 component (Basar-Eroglu et al 1992;Demiralp et al 1999;Kolev et al 1997;Stampfer and Basar 1985). Karakas et al. (2002a,b) consider P300 component to be composed of superimposed delta and theta oscillation. Kamarajan et al. (2004)reported a study of oscillations in adult alcoholics in a Go-Nogo P3 paradigm. The responses to the Go condition (that closely resembles the oddball target condition) had reduced delta band power in the parietal occipital and frontal regions. In a follow-up study on adult high risk offspring, the same authors report a strongly reduced delta band power in the parietal regions only for the Go condition (Kamarajan et al., 2006).
The delta band differences reported in alcoholics (Kamarajan et al., 2004, Jones et al., in preparation) and offspring of alcoholics (Kamarajan et al., 2006) and in the present study closely corresponds to P300 differences reported in alcoholics and high risk subjects (Porjesz and Begleiter, 2003). It has been suggested that delta activity is generated by cortico-cortical interactions (Devrim et al., 1999) with some subcortical contributions. Functionally, authors have proposed that the delta response is mainly related to signal detection and decision making (Basar-Eroglu et al., 1992;Basar et al., 1999;Basar et al., 2001).
In the present study the delta band differences between the HR and LR subjects closely corresponds to P300 differences that has been reported in alcoholics and high risk subjects. In contrast to the theta band, the evoked delta power differences were as strong as or marginally stronger than the total power in the delta band. This suggests that time locked frequencies in the delta band may contribute strongly to group differences and explain the association with the P300 component. Hence, similar to the case of P300 component, the lowered post stimulus delta band power in the 300 to 700 millisecond time window may be a good endophenotype to study the predisposition to alcoholism and related disorders (Porjesz et al., 2005).
4.3.1. Genetic issues
In the same genetic study (Jones et al., 2004) mentioned earlier for the theta band, we have also reported significant linkage disequilibrium between target case parietal delta band in visual evoked brain oscillations and cholinergic muscarinic receptor gene (CHRM2) SNPs on chromosome 7. These findings were not observed for the equivalent non-target case data, suggesting a role for the CHRM2 gene in higher cognitive processing in humans. The authors speculate that a concentration dependent mechanism in the cholinergic system may underlie the theta and delta oscillations, the latter being generated at lower muscarinic activities (Jones et al., 2004). The cholinergic M2 autoreceptor is preferentially localized to forebrain, striatal and hippocampal regions and the function of this receptor is to provide negative feedback, limiting the release of acetylcholine. It has been suggested that the muscarinic autoreceptor (M2) controls the cortical excitability by influencing cholinergic and glutamateric neurotransmission (Alcantara et al., 2001;Mrzljak et al., 1993). Studies in humans indicate that basal forebrain and rostral forebrain cholinergic pathways serve important functional roles in conscious awareness, attention, working memory and a number of additional mnemonic processes (Perry et al., 1999).
4.4. Conclusions
To summarize, the theta and delta post-stimulus oscillations are remarkably reduced in adolescent offspring of alcoholics. The P3 amplitudes are also reduced in these subjects but the differences are not as strong as seen for the oscillations, thus making a case for the oscillations as a more stable ‘endophenotype’ in the study of alcoholism and related disorders. The usual manifestation of alcoholism is as part of a class of disinhibitory disorders which includes co-occurring substance abuse and psychiatric disorders. Many of the same risk factors underlie these common psychiatric disorders and can be explained by a small number of underlying factors (Kendler et al., 2003). Studies relating to externalizing disorders have shown that a general vulnerability is what is passed on to the next generation, with each disorder representing a different expression of this general vulnerability (Hicks et al., 2004;Slutske et al., 1998;Krueger et al., 2002;Jacobson et al., 2002;Kendler et al., 2003).
An interesting issue that is highlighted by the genetic studies of theta and delta oscillations is that these measures have provided significant clues to associations with transmitter-related genes – GABAA receptor gene and resting EEG beta band ( Porjesz et al., 2002 ); CHRM2 and theta and delta band for oddball targets ( Jones et al., 2004 ). Furthermore these identified genetic locations also have significant associations with the diagnoses of alcohol dependence ( Edenberg et al., 2004 ; Wang et al., 2004 ). In addition, recent studies suggested that GABRA2 is significantly associated with childhood conduct disorder symptoms ( Dick et al., 2006 ) as well as with marijuana dependence and illicit drug dependence ( Agrawal et al., 2006 ). This implies that it is the oscillations (theta and delta), rather than the event related potentials (P300), that reflect a closer association with CNS structure and function associated with the underlying vulnerability.
Acknowledgments
The Collaborative Study on the Genetics of Alcoholism (COGA), Co-Principal Investigators B. Porjesz, V. Hesselbrock, H. Edenberg, L. Bierut, includes nine different centers where data collection, analysis, and storage take place. The nine sites and Principal Investigators and Co-Investigators are: University of Connecticut (V. Hesselbrock); Indiana University (H.J. Edenberg, J. Nurnberger Jr., P.M. Conneally, T. Foroud); University of Iowa (S. Kuperman, R. Crowe); SUNY Downstate (B. Porjesz); Washington University in St. Louis (L. Bierut, A. Goate, J. Rice); University of California at San Diego (M. Schuckit); Howard University (R. Taylor); Rutgers University (J. Tischfield); Southwest Foundation (L. Almasy). Zhaoxia Ren serves as the NIAAA Staff Collaborator. This national collaborative study is supported by the NIH Grant U10AA008401 from the National Institute on Alcohol Abuse and Alcoholism (NIAAA) and the National Institute on Drug Abuse (NIDA).
In memory of Henri Begleiter and Theodore Reich, Principal and Co-Principal Investigators of COGA since its inception; we are indebted to their leadership in the establishment and nurturing of COGA, and acknowledge with great admiration their seminal scientific contributions to the field.
The authors are grateful to the valuable assistance of Arthur Stimus, Carlene Haynes, Lakshmi Krishnamurthy, Tracy Crippen, Glenn Murawski, Eric Talbert, Chamion Thomas and Joyce Alonzia.
Appendix I
In this work we have applied a recently developed TFR technique termed the S-transform (Stockwell et al., 1996) to obtain estimates of localized power of the ERP time-series. The S-transform can be thought of as a generalization of the STFT (Gabor, 1946) and anextension to the CWT. The S-transform generates a time-frequency representation (TFR) of a signal by integrating the signal at each time point with a series of windowed harmonics of various frequencies as follows:
where h(τ ) is the time-domain signal, f is frequency, t is a translation parameter, the first exponential is the window function, and the second exponential is the harmonic function.The S-transform TFR is computed by shifting the window function down the signal in time across a range of frequencies. The window function is Gaussian with 1/ f2 variance and scales in width according to the examined frequency. This inverse dependence of the width of the Gaussian window with frequency provides the frequency-dependent resolution (multiresolution). In effect the S-transform is a method of spectral localization with similarities to the continuous wavelet transform except using the concept of frequency instead of scale. The instantaneous amplitude (amplitude envelope) of the complex-valued S-transform TFR may be calculated by taking the absolute value , the S-transform power is the square of the amplitude, while the absolutely referenced local phase information can be obtained using arctan(ℑ[ST(t, f )]/ℜ[ST(t, f )]).
The S-transform derived measures used in the analysis presented here were obtained from the single trial and trial-averaged response. To obtain an estimate of event related total power response, EROTOT (stimulus onset phase locked plus non-phase locked oscillations), the squared instantaneous amplitudes (power) of the S-transform TFR were averaged across single trials for each individual. To obtain an estimate of event related phase-locked power response, EROEVK, the S-transform TFR power matrix was calculated for the averaged event-related response (single trial data averaged after alignment to the stimulus onset) per individual. The total power response, EROTOT,enhances events that occur in a similar time range as related to the stimulus onset and irrespective of their phase relations. This reflects the inclusion of energy which is not phase locked to the stimulus onset in the EROTOT measure (total power response). The evoked response, EROEVK, enhances events which are phase-locked to the stimulus and reduces all other energy, including events which are subject to trial-to-trial temporal jitter.
These frequency windows (theta and delta) have been selected based on the well known ‘natural frequencies’ of brain rhythms (i.e., delta, theta, alpha, beta and gamma) which have been related in the literature to various cognitive functions and brain states (Basar et al., 2000). Specification of the time windows for the frequency bands was based on peak latency of the p300 ERP response in the target trials. Specification of the time windows and further sub-windowing of the frequency bands was based on visual inspection of grand mean TFR data and the spatial distribution of grand mean ERO estimates over the scalp.
The average time-frequency power values are then calculated where the ERO value is either the total response (EROTOT) or the evoked response (EROEVK) depending on the type of S-transform TFR matrix used for the calculation (described in detail in Jones et al., in press).
Footnotes
Publisher's Disclaimer: This is a PDF file of an unedited manuscript that has been accepted for publication. As a service to our customers we are providing this early version of the manuscript. The manuscript will undergo copyediting, typesetting, and review of the resulting proof before it is published in its final citable form. Please note that during the production process errorsmaybe discovered which could affect the content, and all legal disclaimers that apply to the journal pertain.
References
- Agrawal A, Edenberg HJ, Foroud T, Bierut LJ, Dunne G, Hinrichs AL, Nurnberger JI, Crowe R, Kuperman S, Schuckit MA, Begleiter H, Porjesz B, Dick DM. Association of GABRA2 with Drug Dependence in the Collaborative Study of the Genetics of Alcoholism Sample. Behav Genet. 2006 doi: 10.1007/s10519-006-9069-4. [DOI] [PubMed] [Google Scholar]
- Alcantara AA, Mrzljak L, Jakab RL, Levey AI, Hersch SM, Goldman-Rakic PS. Muscarinic m1 and m2 receptor proteins in local circuit and projection neurons of the primate striatum: anatomical evidence for cholinergic modulation of glutamatergic prefronto-striatal pathways. J Comp Neurol. 2001;434:445–60. doi: 10.1002/cne.1186. [DOI] [PubMed] [Google Scholar]
- Basar-Eroglu C, Basar E. A compound P300-40 Hz response of the cat hippocampus. Int J Neurosci. 1991;60:227–37. doi: 10.3109/00207459109167035. [DOI] [PubMed] [Google Scholar]
- Basar-Eroglu C, Basar E, Demiralp T, Schurmann M. P300-response: possible psychophysiological correlates in delta and theta frequency channels. A review. Int J Psychophysiol. 1992;13:161–79. doi: 10.1016/0167-8760(92)90055-g. [DOI] [PubMed] [Google Scholar]
- Basar-Eroglu C, Demiralp T. Event-related theta oscillations: an integrative and comparative approach in the human and animal brain. Int J Psychophysiol. 2001;39:167–95. doi: 10.1016/s0167-8760(00)00140-9. [DOI] [PubMed] [Google Scholar]
- Basar E. EEG-Brain Dynamics: Relation between EEG and Brain Evoked Potentials. New York:: Elsevier; 1980. [Google Scholar]
- Basar E, Basar-Eroglu C, Karakas S, Schurmann M. Are cognitive processes manifested in event-related gamma, alpha, theta and delta oscillations in the EEG? Neurosci Lett. 1999;259:165–8. doi: 10.1016/s0304-3940(98)00934-3. [DOI] [PubMed] [Google Scholar]
- Basar E, Basar-Eroglu C, Karakas S, Schurmann M. Gamma, alpha, delta, and theta oscillations govern cognitive processes. Int J Psychophysiol. 2001;39:241–8. doi: 10.1016/s0167-8760(00)00145-8. [DOI] [PubMed] [Google Scholar]
- Basar E, Schurmann M, Basar-Eroglu C, Karakas S. Alpha oscillations in brain functioning: an integrative theory. Int J Psychophysiol. 1997;26:5–29. doi: 10.1016/s0167-8760(97)00753-8. [DOI] [PubMed] [Google Scholar]
- Begleiter H, Porjesz B, Rawlings R, Eckardt M. Auditory recovery function and P3 in boys at high risk for alcoholism. Alcohol. 1987;4:315–21. doi: 10.1016/0741-8329(87)90029-2. [DOI] [PubMed] [Google Scholar]
- Begleiter H, Reich T, Hesselbrock VM, Porjesz B, Li TK, Schuckit MA, Edenberg HJ, Rice JP. The collaborative study on the genetics of alcoholism. Alcohol Health Res World. 1995;19:228–236. [PMC free article] [PubMed] [Google Scholar]
- Benegal V, Jain S, Subbukrishna DK, Channabasavanna SM. P300 amplitudes vary inversely with continuum of risk in first degree male relatives of alcoholics. Psychiatr Genet. 1995;5:149–56. doi: 10.1097/00041444-199524000-00001. [DOI] [PubMed] [Google Scholar]
- Berman SM, Whipple SC, Fitch RJ, Noble EP. P3 in young boys as a predictor of adolescent substance use. Alcohol. 1993;10:69–76. doi: 10.1016/0741-8329(93)90055-s. [DOI] [PubMed] [Google Scholar]
- Besthorn C, Zerfass R, Geiger-Kabisch C, Sattel H, Daniel S, Schreiter-Gasser U, Forstl H. Discrimination of Alzheimer’s disease and normal aging by EEG data. Electroencephalogr Clin Neurophysiol. 1997;103:241–8. doi: 10.1016/s0013-4694(97)96562-7. [DOI] [PubMed] [Google Scholar]
- Birbaumer N, Elbert T, Canavan AG, Rockstroh B. Slow potentials of the cerebral cortex and behavior. Physiol Rev. 1990;70:1–41. doi: 10.1152/physrev.1990.70.1.1. [DOI] [PubMed] [Google Scholar]
- Brandt ME. Visual and auditory evoked phase resetting of the alpha EEG. Int J Psychophysiol. 1997;26:285–98. doi: 10.1016/s0167-8760(97)00771-x. [DOI] [PubMed] [Google Scholar]
- Bucholz KK, Cadoret R, Cloninger CR, Dinwiddie SH, Hesselbrock VM, Nurnberger JI, Jr, Reich T, Schmidt I, Schuckit MA. A new, semi-structured psychiatric interview for use in genetic linkage studies: a report on the reliability of the SSAGA. J Stud Alcohol. 1994;55:149–58. doi: 10.15288/jsa.1994.55.149. [DOI] [PubMed] [Google Scholar]
- Chiaramonti R, Muscas GC, Paganini M, Muller TJ, Fallgatter AJ, Versari A, Strik WK. Correlations of topographical EEG features with clinical severity in mild and moderate dementia of Alzheimer type. Neuropsychobiology. 1997;36:153–8. doi: 10.1159/000119375. [DOI] [PubMed] [Google Scholar]
- Chu PC. The S-Transform for obtaining localized spectra. MTS J. 1996;29:28–38. [Google Scholar]
- Cohen HL, Porjesz B, Begleiter H, Wang W. Neuroelectric correlates of response production and inhibition in individuals at risk to develop alcoholism. Biol Psychiatry. 1997;42:57–67. doi: 10.1016/S0006-3223(96)00221-1. [DOI] [PubMed] [Google Scholar]
- Corsi-Cabrera M, Ramos J, Arce C, Guevara MA, Ponce-de Leon M, Lorenzo I. Changes in the waking EEG as a consequence of sleep and sleep deprivation. Sleep. 1992;15:550–5. doi: 10.1093/sleep/15.6.550. [DOI] [PubMed] [Google Scholar]
- Courchesne E. Event-related brain potentials: comparison between children and adults. Science. 1977;197:589–92. doi: 10.1126/science.877575. [DOI] [PubMed] [Google Scholar]
- Courchesne E. Neurophysiological correlates of cognitive development: changes in long-latency event-related potentials from childhood to adulthood. Electroencephalogr Clin Neurophysiol. 1978;45:468–82. doi: 10.1016/0013-4694(78)90291-2. [DOI] [PubMed] [Google Scholar]
- Cuijpers P, Langendoen Y, Bijl RV. Psychiatric disorders in adult children of problem drinkers: prevalence, first onset and comparison with other risk factors. Addiction. 1999;94:1489–98. doi: 10.1046/j.1360-0443.1999.941014895.x. [DOI] [PubMed] [Google Scholar]
- Demiralp T, Ademoglu A, Comerchero M, Polich J. Wavelet analysis of P3a and P3b. Brain Topogr. 2001;13:251–67. doi: 10.1023/a:1011102628306. [DOI] [PubMed] [Google Scholar]
- Demiralp T, Basar E. Theta rhythmicities following expected visual and auditory targets. Int J Psychophysiol. 1992;13:147–60. doi: 10.1016/0167-8760(92)90054-f. [DOI] [PubMed] [Google Scholar]
- Demiralp T, Yordanova J, Kolev V, Ademoglu A, Devrim M, Samar VJ. Time-frequency analysis of single-sweep event-related potentials by means of fast wavelet transform. Brain Lang. 1999;66:129–45. doi: 10.1006/brln.1998.2028. [DOI] [PubMed] [Google Scholar]
- Desmedt JE. P300 in serial tasks: an essential post-decision closure mechanism. Prog Brain Res. 1980;54:682–6. doi: 10.1016/S0079-6123(08)61690-8. [DOI] [PubMed] [Google Scholar]
- Devrim M, Demiralp T, Ademoglu A, Kurt A. A model for P300 generation based on responses to near-threshold visual stimuli. Brain Res Cogn Brain Res. 1999;8:37–43. doi: 10.1016/s0926-6410(99)00007-5. [DOI] [PubMed] [Google Scholar]
- Dick DM, Bierut L, Hinrichs A, Fox L, Bucholz KK, Kramer J, Kuperman S, Hesselbrock V, Schuckit M, Almasy L, Tischfield J, Porjesz B, Begleiter H, Nurnberger J, Jr, Xuei X, Edenberg HJ, Foroud T. The Role of GABRA2 in Risk for Conduct Disorder and Alcohol and Drug Dependence across Developmental Stages. Behav Genet. 2006 doi: 10.1007/s10519-005-9041-8. [DOI] [PubMed] [Google Scholar]
- Doppelmayr M, Klimesch W, Schwaiger J, Stadler W, Rohm D. The time locked theta response reflects interindividual differences in human memory performance. Neurosci Lett. 2000;278:141–4. doi: 10.1016/s0304-3940(99)00925-8. [DOI] [PubMed] [Google Scholar]
- Duncan-Johnson CC, Donchin E. The time constant in P300 recording. Psychophysiology. 1979;16:53–5. doi: 10.1111/j.1469-8986.1979.tb01440.x. [DOI] [PubMed] [Google Scholar]
- Edenberg HJ, Dick DM, Xuei X, Tian H, Almasy L, Bauer LO, Crowe RR, Goate A, Hesselbrock V, Jones K, Kwon J, Li TK, Nurnberger JI, Jr, O′Connor SJ, Reich T, Rice J, Schuckit MA, Porjesz B, Foroud T, Begleiter H. Variations in GABRA2, encoding the alpha 2 subunit of the GABA(A) receptor, are associated with alcohol dependence and with brain oscillations. Am J Hum Genet. 2004;74:705–14. doi: 10.1086/383283. [DOI] [PMC free article] [PubMed] [Google Scholar]
- Ehlers CL, Phillips E, Sweeny A, Slawecki CJM. Event-related potential responses to alcohol-related stimuli in African-American young adults: relation to family history of alcoholism and drug usage. Alcohol Alcohol. 2003;38:332–8. doi: 10.1093/alcalc/agg080. [DOI] [PubMed] [Google Scholar]
- Ehlers CL, Wall TL, Garcia-Andrade C, Phillips E. Effects of age and parental history of alcoholism on EEG findings in mission Indian children and adolescents. Alcohol Clin Exp Res. 2001;25:672–9. [PubMed] [Google Scholar]
- Fein G, Bachman L, Fisher S, Davenport L. Cognitive impairments in abstinent alcoholics. West J Med. 1990;152:531–7. [PMC free article] [PubMed] [Google Scholar]
- Fell J, Dietl T, Grunwald T, Kurthen M, Klaver P, Trautner P, Schaller C, Elger CE, Fernandez G. Neural bases of cognitive ERPs: more than phase reset. J Cogn Neurosci. 2004;16:1595–604. doi: 10.1162/0898929042568514. [DOI] [PubMed] [Google Scholar]
- Gabor D. Theory of communications. J Inst Elec Eng. 1946;93:429–457. [Google Scholar]
- Gevins A, Smith ME, Leong H, McEvoy L, Whitfield S, Du R, Rush G. Monitoring working memory load during computer-based tasks with EEG pattern recognition methods. Hum Factors. 1998;40:79–91. doi: 10.1518/001872098779480578. [DOI] [PubMed] [Google Scholar]
- Gevins A, Smith ME, McEvoy L, Yu D. High-resolution EEG mapping of cortical activation related to working memory: effects of task difficulty, type of processing, and practice. Cereb Cortex. 1997;7:374–85. doi: 10.1093/cercor/7.4.374. [DOI] [PubMed] [Google Scholar]
- Gruber WR, Klimesch W, Sauseng P, Doppelmayr M. Alpha phase synchronization predicts p1 and n1 latency and amplitude size. Cereb Cortex. 2005;15:371–7. doi: 10.1093/cercor/bhh139. [DOI] [PubMed] [Google Scholar]
- Hartikainen P, Soininen H, Partanen J, Helkala EL, Riekkinen P. Aging and spectral analysis of EEG in normal subjects: a link to memory and CSF AChE. Acta Neurol Scand. 1992;86:148–55. doi: 10.1111/j.1600-0404.1992.tb05057.x. [DOI] [PubMed] [Google Scholar]
- Hesselbrock M, Easton C, Bucholz KK, Schuckit M, Hesselbrock V. A validity study of the SSAGA--a comparison with the SCAN. Addiction. 1999;94:1361–70. doi: 10.1046/j.1360-0443.1999.94913618.x. [DOI] [PubMed] [Google Scholar]
- Hicks BM, Krueger RF, Iacono WG, McGue M, Patrick CJ. Family transmission and heritability of externalizing disorders: a twin-family study. Arch Gen Psychiatry. 2004;61:922–928. doi: 10.1001/archpsyc.61.9.922. [DOI] [PubMed] [Google Scholar]
- Hill SY, Shen S, Locke J, Steinhauer SR, Konicky C, Lowers L, Connolly J. Developmental delay in P300 production in children at high risk for developing alcohol-related disorders. Biol Psychiatry. 1999;46:970–81. doi: 10.1016/s0006-3223(99)00032-3. [DOI] [PubMed] [Google Scholar]
- Hill SY, Steinhauer SR. Assessment of prepubertal and postpubertal boys and girls at risk for developing alcoholism with P300 from a visual discrimination task. J Stud Alcohol. 1993;54:350–8. doi: 10.15288/jsa.1993.54.350. [DOI] [PubMed] [Google Scholar]
- Iacono WG, Carlson SR, Malone SM, McGue M. P3 event-related potential amplitude and the risk for disinhibitory disorders in adolescent boys. Arch Gen Psychiatry. 2002;59:750–7. doi: 10.1001/archpsyc.59.8.750. [DOI] [PubMed] [Google Scholar]
- Iacono WG, Malone SM, McGue M. Substance use disorders, externalizing psychopathology, and P300 event-related potential amplitude. Int J Psychophysiol. 2003;48:147–78. doi: 10.1016/s0167-8760(03)00052-7. [DOI] [PubMed] [Google Scholar]
- Jacobson KC, Prescott CA, Kendler KS. Sex differences in the genetic and environmental influences on the development of antisocial behavior. Dev Psychopathol. 2002;14:395–416. doi: 10.1017/s0954579402002110. [DOI] [PubMed] [Google Scholar]
- Jensen O, Tesche CD. Frontal theta activity in humans increases with memory load in a working memory task. Eur J Neurosci. 2002;15:1395–9. doi: 10.1046/j.1460-9568.2002.01975.x. [DOI] [PubMed] [Google Scholar]
- Jodo E, Kayama Y. Relation of a negative ERP component to response inhibition in a Go/No-go task. Electroencephalogr Clin Neurophysiol. 1992;82:477–82. doi: 10.1016/0013-4694(92)90054-l. [DOI] [PubMed] [Google Scholar]
- Jones KA, Jones KA, Porjesz B, Almasy L, Bierut L, Goate A, Wang JC, Dick DM, Hinrichs A, Kwon J, Rice JP, Rohrbaugh J, Stock H, Wu W, Bauer LO, Chorlian DB, Crowe RR, Edenberg HJ, Foroud T, Hesselbrock V, Kuperman S, Nurnberger J, Jr, O′Connor SJ, Schuckit MA, Stimus AT, Tischfield JA, Reich T, Begleiter H. Linkage and linkage disequilibrium of evoked EEG oscillations with CHRM2 receptor gene polymorphisms: implications for human brain dynamics and cognition. Int J Psychophysiol. 2004;53:75–90. doi: 10.1016/j.ijpsycho.2004.02.004. [DOI] [PubMed] [Google Scholar]
- Jones KA, Porjesz B, Rangaswamy M, Kamarajan C, Padmanabhapillai A, Chorlian DB, Stimus A, Begleiter H. S-transform time-frequency analysis of event-related oscillations reveals multiple P300 source deficits in individuals diagnosed with alcoholism. Clin Neurophysiol . doi: 10.1016/j.clinph.2006.02.028. in press. [DOI] [PubMed] [Google Scholar]
- Kamarajan C, Porjesz B, Jones KA, Choi K, Chorlian DB, Padmanabhapillai A, Rangaswamy M, Stimus AT, Begleiter H. The role of brain oscillations as functional correlates of cognitive systems: a study of frontal inhibitory control in alcoholism. Int J Psychophysiol. 2004;51:155–80. doi: 10.1016/j.ijpsycho.2003.09.004. [DOI] [PMC free article] [PubMed] [Google Scholar]
- Kamarajan C, Porjesz B, Jones KA, Choi K, Chorlian DB, Padmanabhapillai A, Rangaswamy M, Stimus AT, Begleiter H. Alcoholism is a disinhibitory disorder: neurophysiological evidence from a Go/No-Go task. Biol Psychol. 2005a;69:353–73. doi: 10.1016/j.biopsycho.2004.08.004. [DOI] [PMC free article] [PubMed] [Google Scholar]
- Kamarajan C, Porjesz B, Jones KA, Chorlian DB, Padmanabhapillai A, Rangaswamy M, Stimus AT, Begleiter H. Spatial-anatomical mapping of NoGo-P3 in the offspring of alcoholics: evidence of cognitive and neural disinhibition as a risk for alcoholism. Clin Neurophysiol. 2005b;116:1049–61. doi: 10.1016/j.clinph.2004.12.015. [DOI] [PMC free article] [PubMed] [Google Scholar]
- Kamarajan C, Porjesz B, Jones K, Chorlian DB, Padmanabhapillai A, Rangaswamy M, Stimus A, Begleiter H. Event-related oscillations in offspring of alcoholics: neurocognitive disinhibition as a risk for alcoholism. Biological Psychiatry. 2006;59:625–634. doi: 10.1016/j.biopsych.2005.08.017. [DOI] [PMC free article] [PubMed] [Google Scholar]
- Karakas S. A descriptive framework for information processing: an integrative approach. Int J Psychophysiol. 1997;26:353–68. doi: 10.1016/s0167-8760(97)00775-7. [DOI] [PubMed] [Google Scholar]
- Karakas S, Erzengin OU, Basar E. The genesis of human event-related responses explained through the theory of oscillatory neural assemblies. Neurosci Lett. 2000a;285:45–8. doi: 10.1016/s0304-3940(00)01022-3. [DOI] [PubMed] [Google Scholar]
- Karakas S, Erzengin OU, Basar E. A new strategy involving multiple cognitive paradigms demonstrates that ERP components are determined by the superposition of oscillatory responses. Clin Neurophysiol. 2000b;111:1719–32. doi: 10.1016/s1388-2457(00)00418-1. [DOI] [PubMed] [Google Scholar]
- Kendler KS, Prescott CA, Myers J, Neale MC. The structure of genetic and environmental risk factors for common psychiatric and substance use disorders in men and women. Arch Gen Psychiatry. 2003;60:929–937. doi: 10.1001/archpsyc.60.9.929. [DOI] [PubMed] [Google Scholar]
- Klimesch W. EEG alpha and theta oscillations reflect cognitive and memory performance: a review and analysis. Brain Res Brain Res Rev. 1999;29:169–95. doi: 10.1016/s0165-0173(98)00056-3. [DOI] [PubMed] [Google Scholar]
- Klimesch W, Doppelmayr M, Russegger H, Pachinger T. Theta band power in the human scalp EEG and the encoding of new information. Neuroreport. 1996;7:1235–40. doi: 10.1097/00001756-199605170-00002. [DOI] [PubMed] [Google Scholar]
- Klimesch W, Doppelmayr M, Schimke H, Ripper B. Theta synchronization and alpha desynchronization in a memory task. Psychophysiology. 1997;34:169–76. doi: 10.1111/j.1469-8986.1997.tb02128.x. [DOI] [PubMed] [Google Scholar]
- Klimesch W, Doppelmayr M, Schwaiger J, Winkler T, Gruber W. Theta oscillations and the ERP old/new effect: independent phenomena? Clin Neurophysiol. 2000;111:781–93. doi: 10.1016/s1388-2457(00)00254-6. [DOI] [PubMed] [Google Scholar]
- Klimesch W, Doppelmayr M, Yonelinas A, Kroll NE, Lazzara M, Rohm D, Gruber W. Theta synchronization during episodic retrieval: neural correlates of conscious awareness. Brain Res Cogn Brain Res. 2001;12:33–8. doi: 10.1016/s0926-6410(01)00024-6. [DOI] [PubMed] [Google Scholar]
- Klimesch W, Schack B, Schabus M, Doppelmayr M, Gruber W, Sauseng P. Phase-locked alpha and theta oscillations generate the P1-N1 complex and are related to memory performance. Brain Res Cogn Brain Res. 2004;19:302–16. doi: 10.1016/j.cogbrainres.2003.11.016. [DOI] [PubMed] [Google Scholar]
- Klimesch W, Schimke H, Schwaiger J. Episodic and semantic memory: an analysis in the EEG theta and alpha band. Electroencephalogr Clin Neurophysiol. 1994;91:428–41. doi: 10.1016/0013-4694(94)90164-3. [DOI] [PubMed] [Google Scholar]
- Kolev V, Basar-Eroglu C, Aksu F, Basar E. EEG rhythmicities evoked by visual stimuli in three-year-old children. Int J Neurosci. 1994;75:257–70. doi: 10.3109/00207459408986308. [DOI] [PubMed] [Google Scholar]
- Kolev V, Demiralp T, Yordanova J, Ademoglu A, Isoglu-Alkac U. Time-frequency analysis reveals multiple functional components during oddball P300. Neuroreport. 1997;8:2061–5. doi: 10.1097/00001756-199705260-00050. [DOI] [PubMed] [Google Scholar]
- Krueger RF, Hicks BM, Patrick CJ, Carlson SR, Iacono WG, McGue M. Etiologic connections among substance dependence, antisocial behavior, and personality: modeling the externalizing spectrum. J Abnorm Psychol. 2002;111:411–424. [PubMed] [Google Scholar]
- Lachaux JP, Chavez M, Lutz A. A simple measure of correlation across time, frequency and space between continuous brain signals. J Neurosci Methods. 2003;123:175–88. doi: 10.1016/s0165-0270(02)00358-8. [DOI] [PubMed] [Google Scholar]
- Lopes da Silva FH. Event-related potentials: Methodology and quantification . In: Niedermeyer, Lopes da Silva F, editors. Electroencephalography: basic principles, clinical applications and related fields. Vol. 3. Baltimore:: Williams and Wilkins; 1993. pp. 877–886. [Google Scholar]
- Makeig S, Westerfield M, Jung TP, Enghoff S, Townsend J, Courchesne E, Sejnowski TJ. Dynamic brain sources of visual evoked responses. Science. 2002;295:690–4. doi: 10.1126/science.1066168. [DOI] [PubMed] [Google Scholar]
- Miller EK, Li L, Desimone R. A neural mechanism for working and recognition memory in inferior temporal cortex. Science. 1991;254:1377–9. doi: 10.1126/science.1962197. [DOI] [PubMed] [Google Scholar]
- Moselhy HF, Georgiou G, Kahn A. Frontal lobe changes in alcoholism: a review of the literature. Alcohol Alcohol. 2001;36:357–68. doi: 10.1093/alcalc/36.5.357. [DOI] [PubMed] [Google Scholar]
- Mrzljak L, Levey AI, Goldman-Rakic PS. Association of m1 and m2 muscarinic receptor proteins with asymmetric synapses in the primate cerebral cortex: morphological evidence for cholinergic modulation of excitatory neurotransmission. Proc Natl Acad Sci U S A. 1993;90:5194–8. doi: 10.1073/pnas.90.11.5194. [DOI] [PMC free article] [PubMed] [Google Scholar]
- Niedermeyer E, Lopes Da Silva FH. Electroencephalography: Basic Principles, Clinical Applications and Related Fields. New York:: Williams & Wilkins; 1999. [Google Scholar]
- Nixon SJ, Tivis LJ. Neuropsychological responses in COA′s. Alcohol Health Res World. 1997;21:232–6. [PMC free article] [PubMed] [Google Scholar]
- Nurnberger JI, Jr, Wiegand R, Bucholz K, O′Connor S, Meyer ET, Reich T, Rice J, Schuckit M, King L, Petti T, Bierut L, Hinrichs AL, Kuperman S, Hesselbrock V, Porjesz B. A family study of alcohol dependence: coaggregation of multiple disorders in relatives of alcohol-dependent probands. Arch Gen Psychiatry. 2004;61:1246–56. doi: 10.1001/archpsyc.61.12.1246. [DOI] [PubMed] [Google Scholar]
- O′Connor S, Hesselbrock V, Tasman A. Correlates of increased risk for alcoholism in young men. Prog Neuropsychopharmacol Biol Psychiatry. 1986;10:211–8. doi: 10.1016/0278-5846(86)90075-8. [DOI] [PubMed] [Google Scholar]
- O′Connor S, Hesselbrock V, Tasman A, DePalma N. P3 amplitudes in two distinct tasks are decreased in young men with a history of paternal alcoholism. Alcohol. 1987;4:323–30. doi: 10.1016/0741-8329(87)90030-9. [DOI] [PubMed] [Google Scholar]
- Perry E, Walker M, Grace J, Perry R. Acetylcholine in mind: a neurotransmitter correlate of consciousness? Trends Neurosci. 1999;22:273–80. doi: 10.1016/s0166-2236(98)01361-7. [DOI] [PubMed] [Google Scholar]
- Polich J, Herbst KL. P300 as a clinical assay: rationale, evaluation, and findings. Int J Psychophysiol. 2000;38:3–19. doi: 10.1016/s0167-8760(00)00127-6. [DOI] [PubMed] [Google Scholar]
- Polich J, Pollock VE, Bloom FE. Meta-analysis of P300 amplitude from males at risk for alcoholism. Psychol Bull. 1994;115:55–73. doi: 10.1037/0033-2909.115.1.55. [DOI] [PubMed] [Google Scholar]
- Porjesz B, Almasy L, Edenberg HJ, Wang K, Chorlian DB, Foroud T, Goate A, Rice JP, O′Connor SJ, Rohrbaugh J, Kuperman S, Bauer LO, Crowe RR, Schuckit MA, Hesselbrock V, Conneally PM, Tischfield JA, Li TK, Reich T, Begleiter H. Linkage disequilibrium between the beta frequency of the human EEG and a GABAA receptor gene locus. Proc Natl Acad Sci U S A. 2002;99:3729–33. doi: 10.1073/pnas.052716399. [DOI] [PMC free article] [PubMed] [Google Scholar]
- Porjesz B, Begleiter H. The use of event-related potentials in the study of alcoholism: implications for the study of drugs of abuse. NIDA Res Monogr. 1985;62:77–99. [PubMed] [Google Scholar]
- Porjesz B, Begleiter H. Event-related potentials in individuals at risk for alcoholism. Alcohol. 1990;7:465–9. doi: 10.1016/0741-8329(90)90033-9. [DOI] [PubMed] [Google Scholar]
- Porjesz B, Begleiter H. Alcoholism and human electrophysiology . Alcohol Res Health. 2003;27:153–60. [PMC free article] [PubMed] [Google Scholar]
- Porjesz B, Begleiter H, Reich T, Van Eerdewegh P, Edenberg HJ, Foroud T, Goate A, Litke A, Chorlian DB, Stimus A, Rice J, Blangero J, Almasy L, Sorbell J, Bauer LO, Kuperman S, O′Connor SJ, Rohrbaugh J. Amplitude of visual P3 event-related potential as a phenotypic marker for a predisposition to alcoholism: preliminary results from the COGA Project. Collaborative Study on the Genetics of Alcoholism. Alcohol Clin Exp Res. 1998;22:1317–23. [PubMed] [Google Scholar]
- Porjesz B, Rangaswamy M, Kamarajan C, Jones KA, Padmanabhapillai A, Begleiter H. The utility of neurophysiological markers in the study of alcoholism. Clin Neurophysiol. 2005;116:993–1018. doi: 10.1016/j.clinph.2004.12.016. [DOI] [PubMed] [Google Scholar]
- Ramachandran G, Porjesz B, Begleiter H, Litke A. A simple auditory oddball task in young adult males at high risk for alcoholism. Alcohol Clin Exp Res. 1996;20:9–15. doi: 10.1111/j.1530-0277.1996.tb01035.x. [DOI] [PubMed] [Google Scholar]
- Rangaswamy M, Porjesz B, Chorlian DB, Choi K, Jones KA, Wang K, Rohrbaugh J, O′Connor S, Kuperman S, Reich T, Begleiter H. Theta power in the EEG of alcoholics. Alcohol Clin Exp Res. 2003;27:607–615. doi: 10.1097/01.ALC.0000060523.95470.8F. [DOI] [PubMed] [Google Scholar]
- Ratsma JE, van der Stelt O, Schoffelmeer AN, Westerveld And A, Boudewijn Gunning W. P3 event-related potential, dopamine D2 receptor A1 allele, and sensation-seeking in adult children of alcoholics. Alcohol Clin Exp Res. 2001;25:960–7. [PubMed] [Google Scholar]
- Ratti MT, Bo P, Giardini A, Soragna D. Chronic alcoholism and the frontal lobe: which executive functions are imparied? Acta Neurol Scand. 2002;105:276–81. doi: 10.1034/j.1600-0404.2002.0o315.x. [DOI] [PubMed] [Google Scholar]
- Rockstroh B, Müller MM, Cohen R, Elbert T. Probing the functional brain state during P300-evocation . Journal of Psychophysiology. 1992;6:175–184. [Google Scholar]
- Rodriguez Holguin S, Porjesz B, Chorlian DB, Polich J, Begleiter H. Visual P3a in male subjects at high risk for alcoholism. Biol Psychiatry. 1999;46:281–91. doi: 10.1016/s0006-3223(98)00247-9. [DOI] [PubMed] [Google Scholar]
- Sauseng P, Klimesch W, Gruber W, Doppelmayr M, Stadler W, Schabus M. The interplay between theta and alpha oscillations in the human electroencephalogram reflects the transfer of information between memory systems. Neurosci Lett. 2002;324:121–4. doi: 10.1016/s0304-3940(02)00225-2. [DOI] [PubMed] [Google Scholar]
- Schack B, Klimesch W. Frequency characteristics of evoked and oscillatory electroencephalic activity in a human memory scanning task. Neurosci Lett. 2002;331:107–10. doi: 10.1016/s0304-3940(02)00846-7. [DOI] [PubMed] [Google Scholar]
- Schurmann M, Basar-Eroglu C, Kolev V, Basar E. A new metric for analyzing single-trial event-related potentials (ERPs): application to human visual P300 delta response. Neurosci Lett. 1995;197:167–70. doi: 10.1016/0304-3940(95)11912-g. [DOI] [PubMed] [Google Scholar]
- Schurmann M, Basar-Eroglu C, Kolev V, Basar E. Delta responses and cognitive processing: single-trial evaluations of human visual P300. International Journal of Psychophysiology. 2001;39:229–239. doi: 10.1016/s0167-8760(00)00144-6. [DOI] [PubMed] [Google Scholar]
- Schurmann M, Basar E. Functional aspects of alpha oscillations in the EEG. Int J Psychophysiol. 2001;39:151–8. doi: 10.1016/s0167-8760(00)00138-0. [DOI] [PubMed] [Google Scholar]
- Shah AS, Bressler SL, Knuth KH, Ding M, Mehta AD, Ulbert I, Schroeder CE. Neural dynamics and the fundamental mechanisms of event-related brain potentials. Cereb Cortex. 2004;14:476–83. doi: 10.1093/cercor/bhh009. [DOI] [PubMed] [Google Scholar]
- Sher KJ, Walitzer KS, Wood PK, Brent EE. Characteristics of children of alcoholics: putative risk factors, substance use and abuse, and psychopathology. J Abnorm Psychol. 1991;100:427–48. doi: 10.1037//0021-843x.100.4.427. [DOI] [PubMed] [Google Scholar]
- Slutske WS, True WR, Scherrer JF, Goldberg J, Bucholz KK, Heath AC, Henderson WG, Eisen SA, Lyons MJ, Tsuang MT. Long-term reliability and validity of alcoholism diagnoses and symptoms in a large national telephone interview survey. Alcohol Clin Exp Res. 1998;22:553–558. doi: 10.1111/j.1530-0277.1998.tb04292.x. [DOI] [PubMed] [Google Scholar]
- Stampfer HG, Basar E. Does frequency analysis lead to better understanding of human event related potentials. Int J Neurosci. 1985;26:181–96. doi: 10.3109/00207458508985616. [DOI] [PubMed] [Google Scholar]
- Steinhauer SR, Hill SY. Auditory event-related potentials in children at high risk for alcoholism. J Stud Alcohol. 1993;54:408–21. doi: 10.15288/jsa.1993.54.408. [DOI] [PubMed] [Google Scholar]
- Stockwell RG, Mansinha L, Lowe RP. Localization of the complex spectrum: The S-transform. IEEE, Trans on Sig Proc. 1996;44:998–1001. [Google Scholar]
- Tallon-Baudry C, Kreiter A, Bertrand O. Sustained and transient oscillatory responses in the gamma and beta bands in a visual short-term memory task in humans. Vis Neurosci. 1999;16:449–59. doi: 10.1017/s0952523899163065. [DOI] [PubMed] [Google Scholar]
- Tesche CD, Karhu J. Theta oscillations index human hippocampal activation during a working memory task. Proc Natl Acad Sci U S A. 2000;97:919–24. doi: 10.1073/pnas.97.2.919. [DOI] [PMC free article] [PubMed] [Google Scholar]
- Theophanis MR, Queen J. Color display of localized spectrum. Geophysics. 2000;65:1330–1340. [Google Scholar]
- Tomberg C, Desmedt JE. Human perceptual processing: inhibition of transient prefrontal-parietal 40 Hz binding at P300 onset documented in non-averaged cognitive brain potentials. Neurosci Lett. 1998;255:163–6. doi: 10.1016/s0304-3940(98)00740-x. [DOI] [PubMed] [Google Scholar]
- Van der Stelt O, Geesken R, Gunning WB, Snel J, Kok A. P3 scalp topography to target and novel visual stimuli in children of alcoholics. Alcohol. 1998;15:119–36. doi: 10.1016/s0741-8329(97)00106-7. [DOI] [PubMed] [Google Scholar]
- Verleger R. Event-related potentials and cognition: a critique of the context updating hypothesis and an alternative interpretation of P3. Behav Brain Sci. 1988;11:343–427. [Google Scholar]
- Wang JC, Hinrichs AL, Stock H, Budde J, Allen R, Bertelsen S, Kwon JM, Wu W, Dick DM, Rice J, Jones K, Nurnberger JI, Jr, Tischfield J, Porjesz B, Edenberg HJ, Hesselbrock V, Crowe R, Schuckit M, Begleiter H, Reich T, Goate AM, Bierut LJ. Evidence of common and specific genetic effects: association of the muscarinic acetylcholine receptor M2 (CHRM2) gene with alcohol dependence and major depressive syndrome. Hum Mol Genet. 2004;13:1903–11. doi: 10.1093/hmg/ddh194. [DOI] [PubMed] [Google Scholar]
- Yordanova J, Kolev V. Brain theta response predicts P300 latency in children. Neuroreport. 1996;8:277–80. doi: 10.1097/00001756-199612200-00055. [DOI] [PubMed] [Google Scholar]
- Yordanova J, Kolev V. Developmental changes in the event-related EEG theta response and P300. Electroencephalogr Clin Neurophysiol. 1997;104:418–30. doi: 10.1016/s0168-5597(97)00054-3. [DOI] [PubMed] [Google Scholar]
- Yordanova J, Kolev V. Event-related alpha oscillations are functionally associated with P300 during information processing. Neuroreport. 1998a;9:3159–64. doi: 10.1097/00001756-199810050-00007. [DOI] [PubMed] [Google Scholar]
- Yordanova J, Kolev V. Single-sweep analysis of the theta frequency band during an auditory oddball task. Psychophysiology. 1998b;35(1):116–126. [PubMed] [Google Scholar]
- Yordanova J, Kolev V, Rosso OA, Schurmann M, Sakowitz OW, Ozgoren M, Basar E. Wavelet entropy analysis of event-related potentials indicates modality-independent theta dominance. J Neurosci Methods. 2002;117:99–109. doi: 10.1016/s0165-0270(02)00095-x. [DOI] [PubMed] [Google Scholar]