

Abstract
THE GRADE WORKING GROUP IS DEVELOPING and evaluating a common, sensible approach to grading quality of evidence and strength of recommendations in health care. In this article, we discuss the advantages and disadvantages of using letters, numbers, symbols or words to represent grades of evidence and recommendations. Using multiple strategies, we searched for comparative studies of alternative ways of representing ordered categories in any context. In addition, we contacted experts and reviewed theoretical work and qualitative research on how best to communicate grades of any kind quickly and clearly. We were unable to identify health care research that addressed, either directly or indirectly, the best way to present grades of evidence and recommendations. We found examples of symbols used by government, commercial and consumer organizations to communicate quality of evidence or strength of recommendations, but no comparative studies. Although a number of grading systems are used in health care and other fields, there is little or no evidence of how well various presentations are understood. Before promoting the use of specific symbols, numbers, letters or words, the extent to which the intended message is comprehended should be evaluated.
Organizations such as the Canadian Task Force on Preventive Health Care1 and more than 100 other groups2 use various systems of codes to communicate grades of evidence and recommendations. The codes fall primarily into 3 categories: letters (e.g., A, B, C, etc.), numbers (e.g., I, II, III, etc.) and mixed letters and numbers (e.g., Ia, Ib, IIa, etc.).
Health care practitioners, especially students, are often puzzled by the message a grade conveys. For example, the administration of oral anticoagulation in patients with atrial fibrillation and rheumatic mitral valve disease receives various grades of recommendation from different organizations: Class I based on level B evidence by the American Heart Association,3 grade C recommendation based on level IV evidence by SIGN2 and grade 1C+ (where the 1 indicates the balance between benefit and harm and C+ the methodological quality of the underlying evidence) by the American College of Chest Physicians.4 Thus, the various grading systems may not be fulfilling their intended function: to communicate a clear message, quickly and concisely. Indeed, if the same code, used by different systems, represents different meanings, bewilderment and incomprehension may result.
We formed the GRADE Working Group with the hope of reaching agreement on a common, sensible approach to grading quality of evidence and strength of recommendations. We consider here the advantages and disadvantages of using letters, numbers, symbols or words to represent different grades.
Evidence
We conducted a search of MEDLINE and PsychLit databases for the period 1966 to April 2002 (strategy available on request). In addition, we searched for theoretical work and qualitative research addressing how best to communicate grades of any kind quickly and clearly. Furthermore, we searched relevant texts5,6,7,8 and bibliographies and contacted researchers from other fields (e.g., psychology, marketing and graphic design). Because empirical evidence on the use of symbols comes from grading schemes unrelated to health care — such as Consumer Reports9 and restaurant10 and hotel guides11 — we contacted organizations responsible for popular grading schemes (list available on request).
Based on the information derived from the literature searches, reflection on the target audience and the messages that grades of evidence and recommendations are intended to communicate, we established criteria for assessing alternative grading schemes. See Table 1 on the CMAJ Web site.
We did not find any studies comparing different systems of communicating grades in health care. A number of studies have compared alternative ways of presenting information about risk,2,12,13,14,15,16 but none addressed the use of codes or grades. We also did not find comparative studies of alternative ways of presenting grades or evaluations of how well grading systems are understood or used by target audiences.
We identified several examples of symbols used by government, commercial and consumer organizations.9,11,14,17 Among the best known guides that use symbols are the Michelin restaurant and hotel guides,11 which use spoons and stars to communicate hotel quality where a larger number of symbols indicates higher quality. However, neither Michelin nor any other organization or agency we contacted was aware of a comparative study or evaluation of the effectiveness of their own or other schemes for communicating the intended information.
Considerations in developing grading systems
Although health care professionals are the main target audience for systematic reviews and practice guidelines, policymakers, insurers and consumers also use them. As consumers (patients) are the ultimate beneficiaries of reviews and guidelines, some authors argue that these tools should be accessible to the general public, often via the Internet.18 To ensure that such information is comprehensible to this wide range of users, grades of evidence and recommendations should be understandable to people from different cultures with varying levels of literacy and different languages.
By definition, grades are ordered; from 2 to as many as 20 levels have been used for grading evidence and recommendations.2 A small number of levels may be easier to understand and interpret than many levels.15 In a landmark article, Miller19 described how humans' capacity to perceive differences, for example, in the loudness of a sound or the saltiness of a solution, failed beyond 7 categories.
The number of levels used and the upper and lower limits in the grading scheme should be as intuitively obvious as possible and clearly described. If numbers are used, it should be clear whether higher numbers indicate a better grade than lower numbers and what the upper limit of the system is.
Because grades of evidence and recommendations represent multiple dimensions, the system displaying this information should convey more than 1 dimension. At a minimum, the presentation should distinguish between 2 basic concepts: the quality of evidence (i.e, the extent to which one can be confident that an estimate of effect is correct) and the strength of the recommendation (i.e., the extent to which one can be confident that adherence to the recommendation will do more good than harm).16 Many current grading systems do not make this distinction adequately.2
Associations that people may make between a system presenting grades of evidence and recommendations and other types of grades may help or hinder interpretation. For example, letters are commonly used for grades in schools, where they have a specific meaning, e.g., “C” represents average and “F” represents failure.
We identified potential problems associated with using letters, numbers, symbols and words. See Table 2 on the CMAJ Web site.
Letters are commonly used for grades, easily communicated verbally and are likely to be understood intuitively in many cultures. However, because there is more than 1 alphabet, the use of letters may be limited across cultures and languages.
Letters and numbers can be used together to represent 2 dimensions, but this may create confusion about which represents the quality of evidence and which represents the balance between benefits and harms. In addition, many practice guideline schemes already use letters and numbers with varying definitions, which may cause misunderstandings.
Numbers are intuitively communicated and understood, succinct, do not require a high degree of literacy and may have the same meaning across cultures and languages to a larger extent than letters.
The extent to which symbols and words are easily understood is likely to vary greatly, as is the risk of problems with associations, recognition of the number of levels and limits and the ability to convey 2 dimensions. Symbols are succinct and likely to be understood across different levels of literacy and across different languages, but they may have different meanings in different cultures. Symbols have the advantage of being quickly and easily recognized, easy to identify in scanned text and, once learned, may convey understanding better than words through a strong association with the concept they represent. However, symbols may be difficult or inappropriate to communicate verbally. For example, a smiling face would be hard to explain in association with a strong recommendation for chemotherapy in end-stage cancer.
Summary
We were unable to identify research that addresses either directly or indirectly the presentation of grades of evidence and recommendations. An argument against continuing to use letters and numbers in this context without comparative studies is the confusion that currently exists due to inconsistent use of letters and numbers by many organizations. If symbols are used, they should be easily understood across different cultures; their limits, direction and number of levels must be intuitively clear; and it must be possible to convey 2 dimensions easily. Examples of numbers, letters and symbols that appear to meet most of these criteria are presented in Fig. 1.
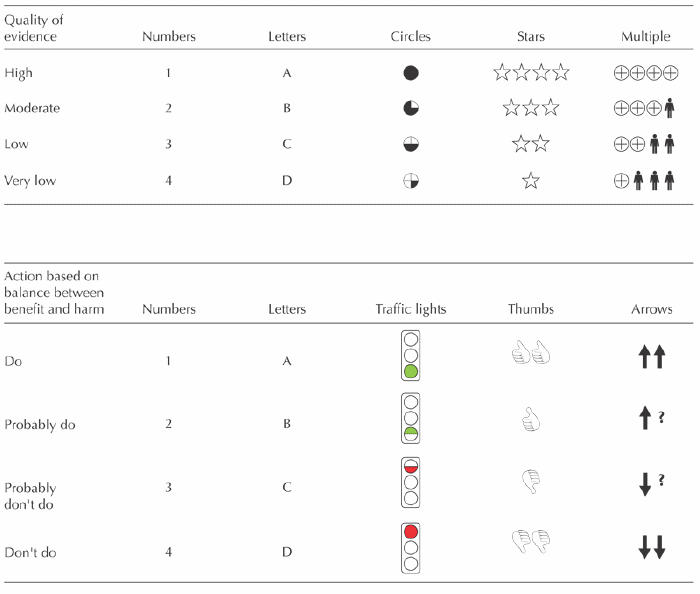
Fig. 1: Examples of possible symbols for representing quality of evidence and the balance between benefits and harm in health care recommendations. See Tables 1 and 2 on the CMAJ Web site for selection criteria (see www.cmaj.ca).
Before promoting the use of specific symbols or words, the extent to which their intended message is comprehended in a particular grading scheme should be evaluated in a comparative, cross-cultural study including clinicians and consumers as participants.
The GRADE Working Group has developed a system for grading evidence and recommendations and is evaluating its reliability and sensibility. We are also developing guidelines for considering costs and issues of equity when making recommendations, how to accommodate questions about diagnostic tests and how best to present grades of evidence and recommendations.
β See related article page 672
Footnotes
Opinions expressed in this paper do not necessarily represent those of the institutions with which the authors are affiliated.
This article has been peer reviewed.
Contributors: All authors contributed substantially to the concept, design, data analysis, acquisition and interpretation. Dana Best and Holger Schünemann drafted the first version. Gunn Vist and Andrew Oxman revised it critically for important intellectual content. All of the authors approved the final version.
Competing interests: None declared.
Correspondence to: Dr. Holger J. Schünemann, Departments of Medicine and of Social and Preventive Medicine, University of Buffalo, 270 Farber Hall, 3435 Main St., Buffalo NY 14214, USA; fax 716-898-4493; hjs@buffalo.edu
References
- 1.Canadian Task Force on Preventive Health Care. History and methods. Available: www.ctfphc.org (accessed 2003 Aug 27).
- 2.National Guideline Clearinghouse. NGC Browse — Organizations. Available: www.guidelines.gov/browse/browse.aspx (accessed 2003 Jul 17).
- 3.Fuster V, Rydén LE, Asinger RW, Cannom DS, Crijns HJ, Frye RL, et al. ACC/AHA/ESC guidelines for the management of patients with atrial fibrillation: a report of the American College of Cardiology/American Heart Association Task Force on Practice Guidelines and the European Society of Cardiology Committee to develop guidelines for the management of patients with arterial fibrillation. J Am Coll Cardiol 2001;38:1266. [DOI] [PubMed]
- 4.Albers G, Dalen JE, Laupacis A, Manning WJ, Petersen P, Singer DE. Antithrombotic therapy in atrial fibrillation. Chest 2001;119:194S-206S. [DOI] [PubMed]
- 5.Harris R. Information graphics: a comprehensive illustrated reference. Oxford: Oxford University Press; 1999.
- 6.Tufte E. Visual explanations. Cheshire (CT): Graphics Press; 1997.
- 7.Tufte E. The visual display of quantitative information. 2nd ed. Cheshire (CT): Graphics Press; 2001.
- 8.Wrolstad M, Fisher DF, editors. Toward a new understanding of literacy. Westport (CT):Praeger; 1986.
- 9.Consumer Reports [Web site]. Available: www.consumerreports.org (accessed 2003 Jul 17).
- 10.Zagat Survey. Available: www.zagat.com/ (accessed 2003 Jul 17).
- 11.Michelin. Key for hotels and restaurants. Available: www.michelin-travel.com/eng/aide/p1342.htm (accessed 2003 Jul 17).
- 12.McGettigan P, Sly K, O'Connell D, Hill S, Henry D. The effects of information framing on the practices of physicians. J Gen Intern Med 1999;14:633-42. [DOI] [PMC free article] [PubMed]
- 13.Edwards A, Hood K, Matthews E., Russell D, Russell I, Barker J, et al. The effectiveness of one-to-one risk communication interventions in health care: a systematic review. Med Decis Making 2000;20:290-7. [DOI] [PubMed]
- 14.Film Advisory Board. FAB rating system. Available: http://www.filmadvisoryboard.org/ratings/Default.asp (accessed 2003 Jul 17).
- 15.DeVellis B. Scale development: theory and applications. Newbury Park (CA): Sage Publications; 1991.
- 16.Wainer H. Graphical data analysis. Annu Rev Psychol 1981;32:191-241.
- 17.National Highway Traffic Safety Administration. Available: www.nhtsa.dot.gov (accessed 2003 Jul 15).
- 18.DISCERN: Health information on the Internet. Available: www.discern.org.uk/HOTI.htm (accessed 2003 Jul 17).
- 19.Miller G. The magic number seven plus or minus two: some limits on our capacity for processing information. Psychol Bull 1956;63:81-97. [PubMed]