Abstract
The structure of the actinoporin sticholysin II (StnII) in the pore state was investigated by Fourier transform infrared spectroscopy in the attenuated total reflection configuration. 1-Palmitoyl-2-oleoyl-sn-glycero-3-phosphocholine/cholesterol unilamellar vesicles were employed. The α-helix content increases in ∼30% upon lipid binding, which agrees with an extension of eight or nine residues at the N-terminal helix. Furthermore, analyses of dichroic spectra show that the extended N-terminal helix would have a 31° tilt with respect to the membrane normal. The orientation of the central β-sandwich was also estimated. In addition, it was detected that StnII alters the orientation of the lipid acyl chains. 1H/2H exchange experiments sustain a mainly superficial interaction between StnII and the membrane, with no protection of the β-sandwich. The implications of the results in the mechanism of pore formation are discussed.
INTRODUCTION
Pore-forming toxins (PFTs) are a group of proteins that are soluble in aqueous solutions but displaying the ability to interact with lipid membranes and form pores upon oligomerization (1). Thus, their conformational changes upon lipid interaction are attractive examples of protein dynamics in response to environmental changes, whose underlying mechanisms may be shared with other important processes like protein folding and aggregation.
PFTs are usually classified according to the pore-forming structural motif. Thus, α-helices and β-barrels are the functional structures for α-PFTs and β-PFTs, respectively. Sticholysin II (StnII) belongs to the actinoporins family, a group of 20 kDa, generally basic, α-PFTs produced by sea anemones. It is isolated from the Caribbean sea anemone Stichodactyla helianthus and is one of the best known actinoporins, together with equinatoxin II (EqtII), produced by Actinia equina (2). Actinoporins were first described as toxins that specifically bound sphingomyelin (SM), which was suggested to be their specific membrane receptor (3,4), but later studies revealed larger complexity in their lipid dependence (5–7). Recently, it was proposed that lipid-phase coexistence is the key factor for actinoporin activity on both model membranes (8) and intact cells (9). Actinoporins adopt partially folded states that have been related to their pore-forming activity (10,11). The pores formed by actinoporins are cation selective, with an approximate radius of 1 nm (5,12,13) independent of membrane composition and toxin concentration, which suggests they have a unique predominant structure (14). The pores seem to be formed by four actinoporin monomers (13,15,16), although lipids may also contribute to the conductive toroidal channel (7,17–19).
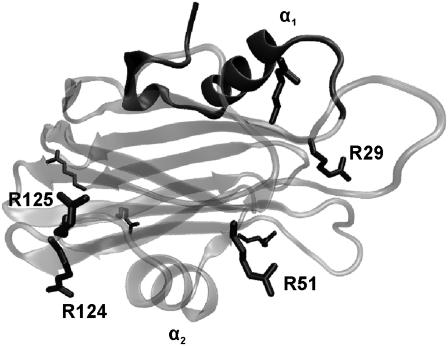
Currently, it is generally accepted that actinoporins share a common mechanism of action (2), which is different from any other known so far (20). The current model of pore formation states that protein oligomerization and pore formation happen after initial monomer binding to the lipid interface (13). The structures of soluble EqtII (21,22) and StnII (16) at atomic resolution have been solved (Fig. 1). In addition, two-dimensional crystallization experiments on lipid monolayers revealed, although at low resolution, a membrane-bound form of StnII different from the pore structure (16,23,24), indicating that few regions of actinoporins go through significant conformational changes upon lipid binding. The N-terminal moiety would suffer the largest conformational rearrangement. A detailed cysteine-scanning mutagenesis study suggested that residues 10–28 of EqtII (8–26 in StnII) would adopt an α-helical conformation in the pore structure (20). This helix would be inserted into the membrane with a tilt angle of 20°–30° (16,20) and would be the only protein region involved in the formation of the conductive channel (19).
FIGURE 1.
Three-dimensional structure of StnII (Protein Data Bank code: 1GWY). The N-terminal region appears shaded, and the side chains of the eight arginine residues of StnII are highlighted. Visual molecular dynamics (VMD) (61) was used to build the figure. Residues cited in the text, as well as both α-helices, are labeled.
Despite the information obtained with different indirect approaches, there is still a lack of direct structural data on the final pore structure, due to its instability, in contrast to some β-PFTs like Staphylococcus α-hemolysin (1). In this regard, attenuated total reflection-Fourier transform infrared spectroscopy (ATR-FTIR) is a methodology of choice when dealing with the study of protein structure within membranes (25) and has already been used for gaining insight into the structure of actinoporins' final pore (6,17,26,27). In these studies, SM was one of the membrane lipids though it has an amide bond whose contribution to protein amide bands in the infrared spectra is difficult to subtract. The finding that actinoporins also permeabilize membranes lacking SM (5,8) opened the possibility to avoid the SM interference in the preparations for infrared spectroscopy. In this work, membranes of 1-palmitoyl-2-oleoyl-sn-glycero-3-phosphocholine (POPC)/cholesterol (Ch) (3:1) were employed and, thus, the kinetics of 1H/2H exchange of an actinoporin in the presence and in the absence of lipids are reported. The obtained results are discussed in terms of the putative model of pore formation for actinoporins and the crystallographic structure of soluble StnII.
MATERIALS AND METHODS
Materials
POPC was from Avanti Polar Lipids (Alabaster, AL). Ch was purchased from Sigma (St. Louis, MO). StnII was purified as described (28). Its concentration was calculated based on an absorbance value (280 nm; 0.1% w/v; 1 cm) of 2.54 (28). All other reagents used were molecular biology grade.
Lipid vesicles
Unilamellar vesicles (100 nm diameter) were prepared as follows. Lipids were dissolved in 2:1 (v/v) chloroform/methanol and dried under a nitrogen flow for 1 h before hydration for 60 min at 37°C. Finally, the suspension was extruded through two stacked 0.1-μm (pore diameter) polycarbonate filters (Nuclepore, Costar, Cambridge, MA) in a thermobarrel extruder (Lipex Bio-membranes, Vancouver, Canada) at 37°C.
Leakage assay
Leakage of vesicle aqueous contents was measured at 37°C by using the ANTS/DPX (8-aminonaphthalene-1,3,6-trisulfonic acid/N,N′-p-xylenebispyridinium bromide) assay as previously described (5,29). Vesicles were prepared as explained above in 10 mM Tris buffer, pH 7.5, containing 20 mM NaCl, 12.5 mM ANTS, and 45 mM DPX, though five cycles of freeze/thawing were performed before extrusion. Untrapped material was separated by gel filtration on Sephadex G-75 (10 mM Tris buffer, pH 7.5, containing 0.1 M NaCl and 1 mM EDTA). In a typical assay, a small volume of protein solution was injected into a quartz cuvette containing the magnetically stirred vesicle suspension to give a final volume of 1.6 ml. The time variation of the fluorescence intensity was measured through a 3–68 Corning (Corning, NY) cutoff filter (>530 nm) upon excitation at 386 nm on a SLM Aminco 8000 spectrofluorimeter (SLM Aminco International, Lake Forest, CA). The fluorescence intensity corresponding to 100% leakage (F100) was determined by addition of 10% Triton X-100 to the vesicle suspension (0.5% final concentration). The fluorescence intensity before addition of protein was taken as 0% leakage (F0). Percent leakage (%L) was calculated by the equation
 |
where Fp is the final fluorescence intensity after addition of protein. It has been described that the mode of mixing protein and lipid vesicles can affect the kinetics of the leakage process (30). In the case here neither the stirring conditions nor the sample volume were altered during the study. To eliminate the potential contribution of sample turbidity to the fluorescence measurements, 10-mm Glan-Thompson polarizers (SLM Aminco) (90°/0°) were used.
Acquisition of ATR-FTIR spectra
To record the spectra of pure StnII, 20 μg of the protein dissolved in H2O (1 mg/mL concentration) were spread on the surface of the Ge plate. For membrane-bound StnII, 66 μg of protein were incubated for 30 min at room temperature with 100-nm-diameter vesicles of POPC/Ch (3:1) (55:1 lipid/protein molar ratio) in water. Control experiments with no addition of StnII were also carried out. Vesicles were sedimented by centrifugation at 164,000 × g for 3 h at 4°C in a Beckman (Fullerton, CA) SW-60 rotor. Absorbance measurements of the supernatant indicated that 30% of the protein bound to the vesicles. The pellet was resuspended in 10 μL of water and finally spread on the Ge plate.
ATR-FTIR spectra were obtained on a Bruker IFS55 FTIR spectrophotometer (Ettlingen, Germany) equipped with a mercury cadmium telluride detector (broad band 12,000–420 cm−1, liquid N2 cooled, 24 h hold time) at a resolution of 2 cm−1 with an aperture of 3.5 mm and acquired in the double-sided, forward-backward mode. The spectrometer was placed on vibration-absorbing sorbothane mounts (Edmund Industrial Optics, Barrington, NJ). Two levels of zero filling of the interferogram before Fourier transform allowed encoding the data every 1 cm−1. The spectrometer was continuously purged with dry air (Whatman 75-62, Haverhill, MA). For better stability, the purging of the spectrometer optic compartment (5 L/min) and of the sample compartment (10–20 L/min) were dissociated and controlled independently by flowmeters (Fisher Bioblock Scientific, Illkirch, France). The internal reflection element was a 52 × 20 × 2 mm trapezoidal germanium ATR plate (ACM, Villiers St. Frédéric, France) with an aperture angle of 45° yielding 25 internal reflections. The germanium crystals were washed in Superdecontamine (Intersciences, AS, Brussels, Belgium), a lab detergent solution at pH 13, rinsed with distilled water, washed with methanol then with chloroform, and finally placed for 2 min in a plasma cleaner PDC23G (Harrick, Ossining, NY) working under reduced air pressure. Measurements were carried out at room temperature. Thin films were obtained by slowly evaporating a sample on one side of the ATR plate under a stream of nitrogen (31). The germanium crystal was then placed in an ATR holder for liquid sample with an inlet and outlet (Specac, Orpington, UK). The liquid cell was placed at 45° incidence on a Specac vertical ATR setup. Two such setups, the second mounted as the mirror image of the first one, fitted on the sample shuttle provided by Bruker, allowing the recording of two kinetics almost simultaneously. This is an important feature since the two samples can be compared under identical conditions (temperature, gas flow rate).
Sharp atmospheric water absorption lines cannot be avoided in long-term experiments. Atmospheric water absorbance is better corrected when spectra are recorded at relatively high resolution for taking advantage of the line width difference existing between the atmospheric water and the solid sample bands (32). Our software computes the subtraction coefficient as the ratio of the atmospheric water band area between 1562 and 1555 cm−1 on the sample spectrum and on the reference atmospheric water spectrum. Finally, the corrected spectra were smoothed by apodization of its Fourier transform by the Fourier transform of a 4 cm−1 Gaussian line shape.
Fourier self-deconvolution was performed according to Kauppinen et al. (33). Deconvolution was performed with a Lorentzian line (full width at half height (FWHH) = 30 cm−1) and apodization with a Gaussian line (FWHH = 15 cm−1), resulting in a so-called “line-narrowing” factor (K) of 2.0. It must be noted that although the narrowing effect of Fourier self-deconvolution has been widely used in the past, the shape and width of the deconvoluting line shape are usually unknown, resulting in less efficient band narrowing (34–36).
Secondary structure determination
Secondary structure determination was based on the shape of the amide I band (1700–1600 cm−1), which is sensitive to the secondary structure (37,38). Fourier self-deconvolution was applied to narrow the different components of the amide I region. The position and number of the components detected were used as starting parameters for a least squares iterative curve fitting of the original spectrum between 1700 and 1600 cm−1 with Lorentzian/Gaussian line shapes. Fitting of the original, nondeconvoluted spectrum avoids the introduction of artifacts due to the self-deconvolution procedure (38). The proportion of a particular structure was computed as the sum of the area of all the fitted Lorentzian bands having their maximum in the frequency region where that structure occurs divided by the total area of the amide I. The frequency limits for each structure were assigned according to theoretical (35,39) or experimental (40) data. Those limits given in cm−1 were β-sheet (1693–1677 and 1638–1628), turns (1679–1665), α-helix (1659–1651), random (1659–1649), and side chains (1620–1610).
Molecular orientation determination
The molecular orientations by infrared ATR spectroscopy were determined as previously described (25,41). Spectra were recorded with the incident light polarized parallel and perpendicular with respect to the incidence plane. Dichroism spectra were computed by subtracting the perpendicular polarized spectrum from the parallel polarized spectrum. The subtraction coefficient was chosen so that the area of the lipid ester band at 1740 cm−1 equals zero on the dichroism spectrum to take into account the difference in the relative power of the evanescent field for each polarization.
An upward deviation on the dichroism spectrum indicates a dipole oriented preferentially near a normal to the ATR plate. Conversely, a downward deviation on the dichroism spectrum indicates a dipole oriented closer to the plane of the ATR plate. The dichroic ratio RATR is defined as the ratio of the band area recorded for the parallel polarization (A//) and perpendicular polarization (A⊥):
 |
In ATR, the dichroic ratio for an isotropic sample Riso is different from unity and is computed on the basis of the area of the lipid ester band (1762–1716 cm−1). Fitting of the amide I bands of polarized spectra was carried out to calculate the dichroic ratios of the different secondary structures. The mean orientation of the molecular axis with respect to the perpendicular of the ATR plate was estimated as described before (for a review, see Goormaghtigh et al. (25)). In the α-helical structure, the amide I dipole is oriented at 38° with respect to the helix axis (42).
1H/2H exchange kinetics
For hydrogen/deuterium exchange, nitrogen gas was saturated with 2H2O by bubbling through a series of four vials containing 2H2O. A flow rate of 50 ml/min was controlled by a flowtube (Fisher Bioblock Scientific, Illkirch, France). Bubbling was started at least 1 h before starting the experiments. At the zero time, the tubing was connected to the cavity of the liquid cell chamber surrounding the film. Twenty scans were recorded and averaged for each time point. The time interval was increased logarithmically. After 27 min, the interval between the scans was large enough to allow interdigitation of a second kinetics measurement. The second sample was then analyzed with the same time sampling but with a 27 min offset. Deuteration started by connecting it to the 2H2O-saturated N2 flow from the output of the first sample chamber. Sample shuttle movements and spectrum recording were under control of a macro program written for OPUS (Bruker).
The area of the lipid ν(C=O), amide I, I′, and II were obtained by automatic integration. For each spectrum, the area of amide II was divided by the area of amide I to take into account the swelling of the sample layer due to the presence of 2H2O (43,44). All kinetic curves were analyzed as multiexponential decays of populations αi of amide protons with the same rate constants ki, using a nonlinear least squares procedure. It is usual to fit the proportion of unexchanged amide proton curve H(t) by a small number M of exponential (typically 3) each representing a class Aj of amide groups:
 |
Synchronous and asynchronous correlation maps were calculated according to Noda and Ozaki (45).
RESULTS
α-Helix content of StnII is increased upon lipid binding
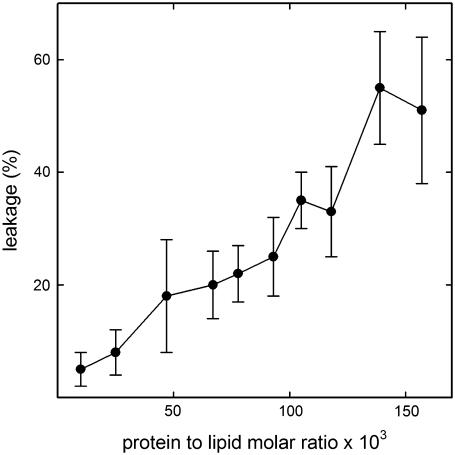
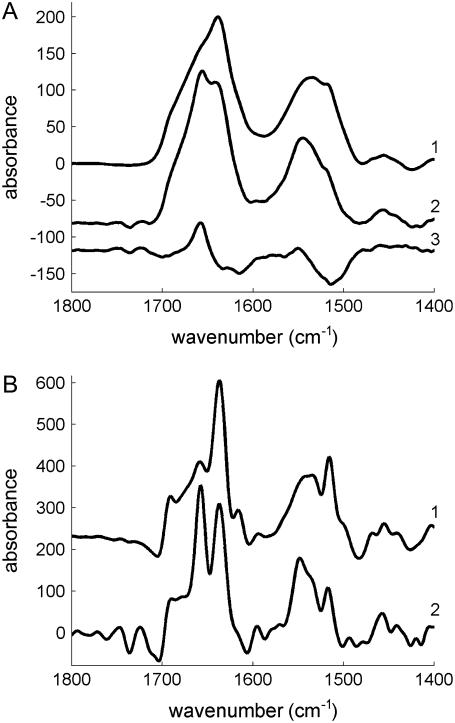
To investigate the structural changes in StnII associated with pore formation, POPC/Ch (3:1) model membranes were employed. StnII was active against 100-nm-diameter unilamellar vesicles of this composition, as revealed in a typical leakage assay (Fig. 2). Fig. 3 A shows the ATR-FTIR spectra obtained for lipid-free StnII and for the lipid-bound species, as well as their difference. A new peak at 1658 cm−1 appears in the amide I region, and a shift toward higher wavenumbers is detected in the amide II band (1600–1500 cm−1) upon lipid binding (Fig. 3 A, spectra 1 and 2). Consequently, two maxima at 1658 and 1550 cm−1 appear in the difference spectrum (Fig. 3 A, spectrum 3). These frequencies are characteristic of the α-helix structure in the amide I and amide II regions (35). Altogether, the results presented in Fig. 3 A suggest that lipid binding induces the formation of α-helical structure in StnII.
FIGURE 2.
StnII activity on POPC/Ch (3:1) liposomes. StnII-induced leakage of encapsulated ANTS/DPX in POPC/Ch (3:1) 100-nm-diameter vesicles was followed by the increase of fluorescence intensity through a 3–68 Corning cutoff filter (>530 nm) upon excitation at 386 nm. The buffer employed was 10 mM Tris buffer, pH 7.5, containing 0.1 M NaCl and 1 mM EDTA. The fluorescence intensity corresponding to 100% leakage (F100) was determined by addition of Triton X-100 to the vesicle suspension (0.5% final concentration). The fluorescence intensity before addition of protein was taken as 0% leakage (F0). Percent leakage (%L) was calculated by the equation (%L) = 100 × (Fp − F0)/(F100 − F0), where Fp is the final fluorescence intensity after addition of protein. Experiments were developed under constant stirring at 37°C; 10-mm Glan-Thompson polarizers (SLM Aminco) (90°/0°) were used to minimize the effects of light dispersion on the fluorescence measurements. Mean values of three independent determinations are shown. Error bars indicate standard deviation.
FIGURE 3.
(A) ATR-FTIR spectra of 1), StnII, 2), membrane-bound StnII, and 3), their difference (subtraction coefficient was chosen to cancel out amide I area). In spectrum 2, lipid contribution was removed by subtraction of pure-lipid spectra to cancel the lipid ester band area. (B) Deconvoluted spectra 1 and 2 from Fig. 3 A (K = 2). To record the spectrum of pure StnII, 20 μg of the protein dissolved in H20 (1 mg/mL concentration) were spread on the surface of the Ge plate, whereas for membrane-bound StnII, the protein was incubated for 30 min at room temperature with 100-nm-diameter vesicles of POPC/Ch (3:1) (55:1 lipid/protein molar ratio) in water. Vesicles/protein complexes were then sedimented by centrifugation at 164,000 × g for 3 h at 4 °C in a Beckman SW-60 rotor. The pellet was resuspended in 10 μL of water and spread on the Ge plate. Samples were dried under a nitrogen stream before recording the spectra.
To further corroborate the formation of α-helix in the membrane-bound StnII, evaluation of secondary structure contents was carried out. First, deconvolution (K = 2) of the spectra showed different components in the amide I band (Fig. 3 B) that were assigned to specific secondary structures based on data in the literature (35). The bands centered at 1691 and 1637 cm−1 were assigned to β-sheet, whereas the band at 1658 cm−1 was assigned to α-helix and the one at 1616 cm−1 to side chains. A weak component at ∼1675 cm−1 was also detected and was assigned to turns. These wavenumbers were used as starting parameters for the fitting of the original spectra in the amide I band, as suggested before (35,38). In the fitting, an additional component centered at 1654 cm−1 corresponding to random structure was included. The results of the fitting appear in Table 1. The secondary structure content found for lipid-free StnII matches with the crystallographic structure of StnII (16). Similar increases of 5% (5% over 18% content in the lipid-free form) and 6% (6% over 40% in the lipid-free form) are found for α-helix and β-sheet upon lipid binding. Concomitantly, a decrease in the random content is detected (Table 1).
TABLE 1.
StnII secondary structure determinations
| Conditions | β-Sheet | Random | α-Helix | Turns |
|---|---|---|---|---|
| StnII | 40 | 23 | 18 | 18 |
| StnII + POPC/Ch (3:1) | 46 | 14 | 23 | 17 |
Secondary structures determinations were obtained from the fitting of StnII nondeconvolved spectra in the amide I region (see text). The results are the average value of three different determinations. Standard deviations were always below 5%.
It has long been known that the general assignments for secondary structures are at best approximations. A recent article using spectral simulation further establishes the limits of these assignments on a rational basis (46). Though limited, the structural information content based on such assignments remains important as recently determined (47). In this study comparison of the results with the three-dimensional structure of hydrosoluble StnII gives some further confidence in the assignments proposed above.
Orientation of StnII in the lipid environment
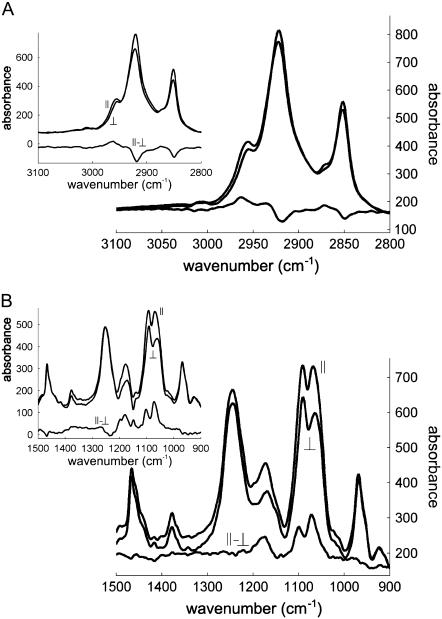
Polarized spectra recorded with the electric field vector of the infrared (IR) radiation polarized parallel (A//) or perpendicular (A⊥) to the incidence plane appear in Figs. 4 and 5. The lipid-associated νas(CH2) and νs(CH2) appear at 2918 and 2849 cm−1, respectively. The lipid νas(CH3) and νs(CH3) bands are present at 2961 and 2873 cm−1. Dichroism of these bands (Fig. 4) reflects the orientation of the lipid acyl chains in the multilayer stack of lipid bilayers. A weak absorption at 3030 cm−1 can be assigned to ν(CH)double bond and signs the presence of double bonds in the lipid acyl chains. The lipid intense band found between 1762 and 1705 cm−1 can be safely assigned to the lipid ester ν(C=O). Globally, the dichroism of this band is close to zero and can be used as a good approximation of a magic angle dichroism whose validity has been established in Bechinger et al. (41) and critically discussed in Goormaghtigh et al. (25). It presents however a positive deviation at 1748 cm−1 and a negative deviation at 1729 cm−1 (25). A major contribution of the lipids also appears at 1468 cm−1 and can be assigned to δ(CH2).
FIGURE 4.
Polarized ATR-FTIR spectra of POPC/Ch (3:1) including StnII in the (A) 3100–2800 and (B) 1500–900 cm−1 regions, as well as their difference. The polarization plane of the light is indicated. Insets: equivalent spectra recorded for POPC/Ch (3:1) without StnII.
FIGURE 5.
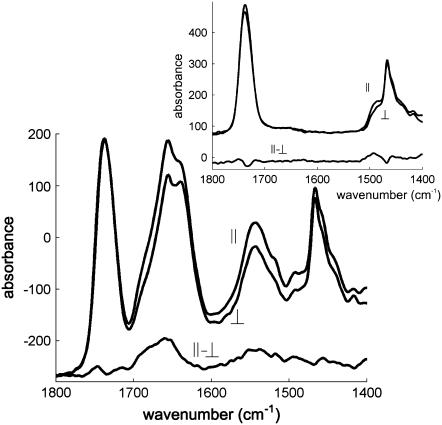
Polarized ATR-FTIR spectra of POPC/Ch (3:1) including StnII in the 1800–1400 cm−1 region, as well as their difference (dichroism spectrum). The polarization plane of the light is indicated. Inset: equivalent spectra recorded for POPC/Ch (3:1) without StnII.
Quantitative evaluation of the molecular orientation requires the estimation of the dichroic ratio RATR = A///A⊥ for the corresponding bands and of Riso, which is the dichroic ratio measured for a transition dipole that is either spatially disordered or oriented at the magic angle. As indicated above, the lipid ν(C=O) was used to determine Riso. The results of this analysis are listed in Table 2. It is shown that the angle between the acyl chains and the normal to the Ge plate augments 11°–14° upon StnII binding, which suggests that StnII alters the orientation of the acyl chains.
TABLE 2.
Orientation of lipid acyl chains and secondary structure elements of StnII
| POPC/Ch (3:1)*
|
POPC/Ch (3:1) + StnII†
|
|||||
|---|---|---|---|---|---|---|
| Band | θ | Integration limits (cm−1) | Dichroic ratio | γ | Dichroic ratio | γ |
| νas (CH2) | 90° | 2930 – 2900 | 1.00 ± 0.04 | 25° | 1.18 ± 0.05 | 39° |
| νs (CH2) | 90° | 2858 – 2838 | 1.07 ± 0.02 | 32° | 1.26 ± 0.02 | 44° |
| δ (CH2) | 90° | 1477 – 1460 | 1.09 ± 0.02 | 34° | 1.28 ± 0.01 | 45° |
| α-helix amide I | 38° | ‡ | - | - | 1.67 ± 0.06 | 42° (α1: 31°§) |
| β-sandwich amide I | 0° | ‡ | - | - | 1.80 ± 0.18 | 47° |
Analysis of the dichroic ratios was performed as described in Goormaghtigh et al. (25).
θ is the angle between molecular axis and transition dipole. γ represents the angle between molecular axis and the perpendicular to the ATR plate. Results are the average of three different determinations. The standard deviations for the γ angles were always below 5°.
Riso = 1.36 ± 0.03. †Riso = 1.42 ± 0.06.
Data were obtained from fitting of the amide I band.
Orientation of the α1 helix considering an orientation of 80° for the α2 helix (see Results section).
With regard to protein orientation, Fig. 5 shows a clear dichroic signal in the amide I band centered at 1658 cm−1. To evaluate the orientation of the different secondary structure elements, amide I bands of the polarized spectra were fitted as described above for the nonpolarized spectra, and the areas obtained were employed to calculate the corresponding dichroic ratios (Table 2). A value of 42° was obtained for the orientation of the α-helix considering a unique orientation of the α-helical component. This value matches perfectly with that obtained before in which phosphatydilcholine (PC)/SM (1:1) membranes were employed (26). However, the knowledge of the three-dimensional structure of StnII together with the model of pore structure (16) suggest that two distinct α-helices with different orientations exist within StnII pore structure. Those two different α-helical populations can be taken into account in the analysis of the dichroic ratios as described in Goormaghtigh et al. (25). The current model of pore formation maintains that an α-helix is formed at the N-terminal region of StnII in the final pore structure, whereas most of the soluble conformation remains unchanged (16,19,20,48). Then, the ∼30% increase in α-helix detected upon lipid binding, corresponding to eight or nine amino acids, can be safely assigned to the N-terminal helix (α1) that would be established in the pore structure and would be added to the 11 residues in α-helical conformation present in the N-terminal soluble structure of StnII (16). Assuming that no variation occurs within the other helix comprising residues 128–136 (α2, Fig. 1), an estimate of the proportion of α-helix populations can be made. Considering that α2 (31% StnII helix content) seems to form an angle of 80° with respect to the normal to the membrane (16), a value of 31° would be obtained for the remaining 69% helical component (the N-terminal helix α1). This result completely agrees with the value of 30° suggested by Mancheño et al. (16) based on electron microscopy and crystallographic data.
The β-sheet in StnII is mainly antiparallel (Fig. 1). Thus, its orientation can be evaluated from the dichroic ratio of the bands assigned to β-sheet considering that the transition dipole for its low-frequency band at 1637 cm−1 is perpendicular to the direction of the β-strands and parallel to the carbonyl bond direction (25). A value of 47° is found for the average orientation of the carbonyl bonds in the β-sandwich with respect to the normal of the Ge plate (Table 2).
Kinetics of 1H/2H exchange
Hydrogen isotope exchange has long been used for the analysis of protein structure and dynamics (49–51). It appears to be one of the main techniques able to identify submolecular motional domains, including fast exchanging protons of the protein surface, somewhat slower exchanging protons of the flexible (loop) regions buried in the protein or involved in some secondary structures, and the slowly exchanging protons from the protein core formed by the most rigid clusters (knots) of amino acids (for a review see Lumry (52)) or somehow protected by other chemical structures, e.g., membranes. 1H/2H exchange kinetics have also been widely used in the field of membrane proteins. They allow the characterization of the protein stability in different experimental conditions and conformational changes relevant to an enzyme catalytic cycle (53). When compared to mass spectrometry or 1H/3H exchange, the great advantage of monitoring the exchange by FTIR is that the measure is focused on the amide protons only, yielding data proportional to the number of residues in the protein.
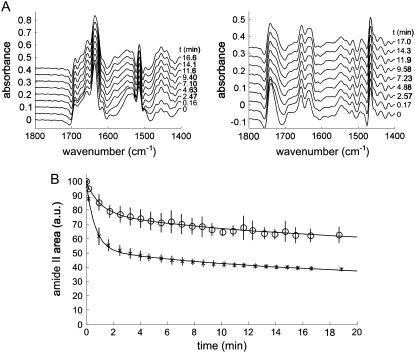
Two series of deconvoluted spectra (K = 2) showing the progression of the 1H/2H exchange are shown in Fig. 6 A (left, lipid-free StnII; right, lipid-bound StnII). As expected, few changes are detected in the 1700–1600 cm−1 region upon 1H/2H exchange, whereas the intensity of amide II band decays concomitantly with an increase in amide II′ intensity at 1500–1400 cm−1. To better follow the disappearance of the amide II band, its area was calculated and plotted against deuteration time. As shown in Fig. 6 B, exchange for lipid-bound StnII is slower than for the lipid-free StnII. This can be further analyzed by fitting this decay to a three-component exponential function (Fig. 6 B, Table 3). The results in Table 3 suggest that membrane binding is responsible for the protection of approximately half of the amide protons that are exchanged fast in the lipid-free StnII.
FIGURE 6.
(A) Deconvoluted spectra (K = 2) showing the progression of 1H/2H exchange in the lipid-free StnII (left) and lipid-bound StnII (right). Only representative spectra are shown (deuteration time is indicated). Deuteration was achieved by connecting the cavity of the liquid cell chamber surrounding the Ge plate to a flow of nitrogen gas saturated with 2H2O. (B) Disappearance of amide II band upon deuteration for (x) StnII and (o) membrane-bound StnII. Amide I band was used to normalize the spectra to take into account the swelling of the sample layer due to the presence of 2H2O. Three different determinations were averaged, and standard deviation is shown. Lines indicate the result of the fitting of the experimental points to a three-component exponential decay (see Table 3).
TABLE 3.
Kinetic parameters for the 1H/2H exchanges
| Fast component
|
Intermediate component
|
Slow component
|
||||
|---|---|---|---|---|---|---|
| Conditions | Proportion (%) | T (min) | Proportion (%) | T (min) | Proportion (%) | T (min) |
| StnII | 47 | 0.65 | 20 | 14.8 | 33 | 2126 |
| StnII + POPC/Ch (3:1) | 21 | 1.04 | 23 | 15.8 | 56 | 2184 |
The decay in the amide II area upon deuteration was fitted to a three-component exponential. Three independent experiments were averaged to compute each fitting. Forcing the time constants to the average values (0.85, 15.3, and 2155 min for the fast, intermediate, and slow components, respectively) yields the same proportions within 2% maximum deviation.
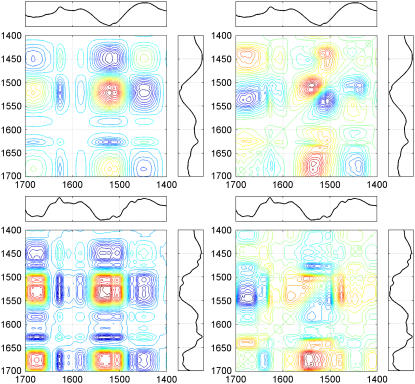
The results of 1H/2H exchange kinetics can also be studied in terms of two-dimensional correlation spectroscopy (45). The synchronous and asynchronous correlation maps allow the identification of frequencies that change their intensity with enhanced sensitivity with respect to the one-dimensional spectra. In a synchronous correlation map, a crosspeak appears only if the changes occur simultaneously. Conversely, in an asynchronous correlation map, a crosspeak only develops if the changes happen out of phase with each other (45). Both correlation maps were calculated in the 1700–1400 cm−1 region for both the lipid-free and -bound StnII and appear in Fig. 7, together with the corresponding difference spectra (the last spectrum in the series minus the spectrum recorded before starting deuteration). The frequencies that are detected in at least three correlation maps are summarized in Table 4. The only components that are detected in the amide I band in both synchronous correlation maps are those at ∼1684 and ∼1626 cm−1. In addition, their crosspeaks have a negative sign, which means that the changes in intensity have opposite direction (45). These facts suggest that both frequencies are associated with identical structures and therefore are assigned to β-sheet based on the frequencies reported in Goormaghtigh et al. (35). Two more frequencies are detected in the amide I band: one at ∼1675 cm−1, which is assigned to undeuterated Arg, and one at 1606 cm−1, which can be due either to deuterated Arg or to undeuterated Gln (54). Another frequency is detected for deuterated arginine at ∼1582 cm−1, corresponding to its symmetrical stretching (55). The component at ∼1538 cm−1 in the amide II band is assigned to an undeuterated random structure (35). The band at ∼1520 cm−1 can be assigned to Tyr residues, whereas the ∼1505 cm−1 band remains unassigned. Finally, only one frequency is detected in the amide II′ band, which probably reflects the appearance of the deuterated random and β-sheet structures (35,44).
FIGURE 7.
Synchronous (left) and asynchronous (right) correlation maps corresponding to the deuteration of StnII (top) and membrane-bound StnII (bottom) in the 1700–1400 cm−1 region. The difference spectra (last spectrum in the series minus the spectrum recorded before deuteration) are indicated for reference purposes. In the correlation maps, red coloring indicates positive peaks, whereas negative peaks are in blue.
TABLE 4.
Band assignments for the deuteration of StnII
| StnII
|
StnII + POPC/Ch (3:1)
|
|||
|---|---|---|---|---|
| Band assignment | Synchronous (cm−1) | Asynchronous (cm−1) | Synchronous (cm−1) | Asynchronous (cm−1) |
| β-sheet (H) | 1684 | 1683 | 1684 | 1685 |
| Arg (H) | - | 1673 | 1677 | 1674 |
| β-sheet (D) | 1626 | 1624 | 1627 | 1628 |
| Arg (D), Gln (H) | - | 1606 | 1606 | 1606 |
| Arg (D) | 1582 | - | 1582 | 1585 |
| Random (H) | - | 1538 | 1538 | 1545 |
| Tyr | 1520 | 1516 | 1523 | 1521 |
| Unassigned | 1508 | 1505 | 1504 | 1505 |
| Random (D), β-sheet (D) | 1450 | 1450 | 1450 | 1446 |
Frequencies in the table were detected in at least three correlation maps (see Fig. 7).
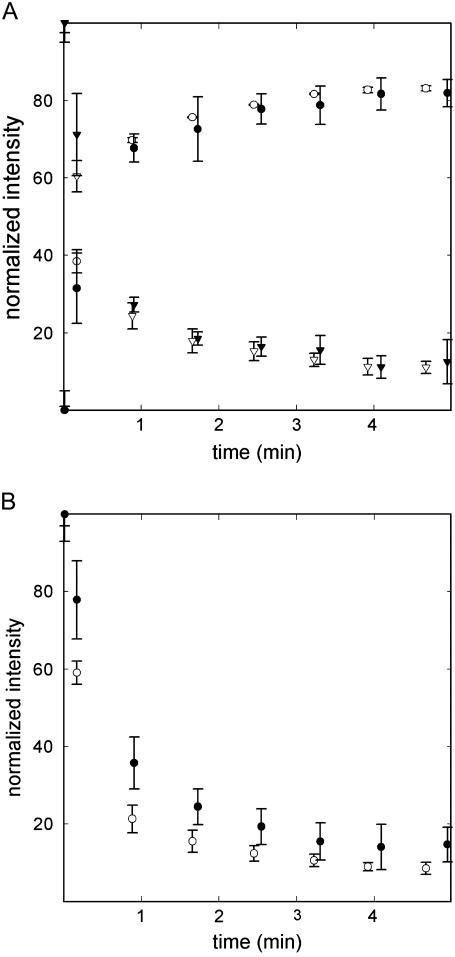
The intensity at specific frequencies was followed for the unambiguously assigned components in the amide I-amide I′ bands. Lipid binding does not alter the 1H/2H exchange kinetics associated with the β-sheet (Fig. 8 A), whereas the component at ∼1674 cm−1 (undeuterated Arg) slightly reduces its exchange rate in the lipid-bound form (Fig. 8 B).
FIGURE 8.
(A) Changes in the intensities associated with β-sheet deuteration. (Circles) Intensity at 1628 cm−1. (Triangles) Intensity at 1684 cm−1. (B) Change in the intensity at 1674 cm−1, associated with arginine, upon deuteration. In both plots, open symbols represent StnII, whereas solid symbols represent membrane-bound StnII. Intensities were normalized using amide I area and referred to the maximal intensity change. Three independent determinations were averaged and standard deviations are indicated by error bars.
DISCUSSION
The putative model of pore formation for actinoporins maintains that the N-terminal region adopts α-helical structure in the functional pore (16). Interestingly, the rather high tendency of peptides with the sequence of the N-terminal portion of EqtII to adopt α-helical conformation in micelles was recently reported (56). In the pore structure, the α-helix would then comprise residues from Asp-10 to Asn-28 in EqtII (20), which are equivalent to Ala-8 and Lys-26 in StnII (Fig. 9). Considering that no α-helix formation would occur apart from that in the N-terminal region, this one should be detected to grow from 11 to 19 residues. This value matches perfectly with the one herein reported (Table 1) and with a previous ATR-FTIR work (26). The slight disagreements found with other reports on IR spectroscopy of actinoporins (6,17) may be explained by the difficulties in subtracting SM amide contribution and by the differences in the deconvolution and band assignment processes. An increase in β-sheet, equivalent to 10–11 residues, is also detected upon lipid binding (Table 1). This change is most probably due to local rearrangements within the larger loops connecting β-strands (Fig. 1), as no significant conformational changes are predicted in the β-sandwich nor the α2 helix according to biochemical and structural data reported so far (19).
FIGURE 9.
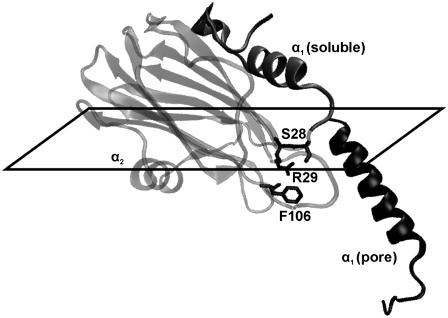
Structural changes associated with pore formation. The main conformational changes are located at α1 helix, whose length and orientation change to form the pore. α2 helix and β-sandwich are supposed not to change their conformation upon lipid binding. Residues cited in the text are highlighted. The plane of the membrane surface is indicated. The diagram was constructed with VMD (61) and PyMol (DeLano Scientific, San Francisco, CA).
Analyses of the infrared spectra obtained with polarized light suggest a tilt angle of 31° for the N-terminal helix in the pore structure (Fig. 9). Considering that the length of this helix is 2.85 nm (0.15 nm per residue), it would penetrate only 2.44 nm into the membrane, a length not enough to cross the hydrophobic part of the membrane. This fact may imply that the first seven residues of StnII also have to be important in the establishment of the pore. In this regard, truncation experiments of the N-terminal region of EqtII showed that the removal of residues 1–10 of the toxin rendered an inactive protein, whereas if residues 1–5 were removed, one-half of the activity was retained (57). Though the involvement of residues 1–7 in StnII activity should be further investigated, it also seems clear that the establishment of the pore with only four actinoporin monomers requires the presence of lipids in the conductive channel to form a toroidal pore (7,17–19). To establish such a pore, lipid acyl chains must change their orientation. This seems to be the case regarding the values shown in Table 2 for the γ angles of the acyl chains. It must be noted that the γ values in the mixture of lipids and StnII should be taken with caution, as they reflect an average value of the orientation of the lipids that form part of the pore and those that do not. In fact, the change of the angles seems to be protein/lipid ratio dependent (data not shown). Interestingly, very similar variations of angle γ for acyl chains were also found when using PC/SM (1:1) membranes (26).
Currently, the role of actinoporins' β-sandwich is thought to be mainly structural, as a mere carrier of the otherwise less soluble N-terminal α-helix (56) and the membrane-recognizing regions (cluster of aromatic amino acids and phosphocholine binding site) (19). All the evidence to date suggests that there are no significant conformational changes associated with the β-sandwich upon membrane binding (16,19). In agreement with this, the change in the content of β-sheet structure determined from infrared spectra is small (Table 1), as discussed above. In addition, the orientation of the β-sandwich with respect to the membrane normal can be estimated from polarized spectra (Table 2). The value of 47° obtained for the orientation of the carbonyl groups with respect to the membrane is consistent with the model proposed by Mancheño et al. based on crystallographic and electron microscopy data (16). This orientation would not allow the membrane to protect the β-sandwich from 1H/2H exchange, in good agreement with the results in Fig. 8 A.
Regarding these 1H/2H exchange experiments, it was detected that half of the bonds that exchange fast in the absence of lipids were protected upon membrane binding (Table 3, Fig. 6 B). The fast exchanging amide protons are usually considered to be those in the protein surface. So the protection of half of them would be in agreement with a mainly superficial interaction between StnII and the membrane (Fig. 9). One side of the protein would be protected by the membrane and/or other monomers, whereas the other one would remain exposed to the solvent. Such a superficial interaction has been suggested before in reports based on tryptophan fluorescence measurements (48). Thus, the only region inserting deeply in the membrane should be the N-terminal α-helix (58), which reinforces the idea of lipids forming part of the pore (see above).
Fig. 1 highlights the distribution of the eight arginine residues of StnII throughout its overall fold. According to the presumed nature of its interaction with the membrane, Arg-51, Arg-124, and probably Arg-125 would be protected from 1H/2H exchange. Fig. 8 B is a plot of the disappearance of undeuterated arginine versus deuteration time. As expected, the intensity decrease is slower for the membrane-bound StnII. However, even a slower intensity decrease should be detected if two or three residues, as expected, are being protected by the membrane. This may be an indication of other arginine residues becoming unprotected upon lipid binding. For example, Arg-29 is π-bonded to Phe-106 (59) and is at hydrogen bond distance of the carbonyl group of Ser-28 (Fig. 9). Such protective interactions may be altered after N-terminal translocation, rendering Arg-29 more sensitive to deuteration, thus counterbalancing the presumed protection of Arg-51, Arg-124, and Arg-125. In this regard, it is noteworthy that the mutation of Arg-31 in EqtII (equivalent to Arg-29 in StnII) drastically diminishes the hemolytic activity of the mutant (60). In addition, the mutation of StnII Phe-106, a residue located in the vicinity of the phosphocholine binding site and belonging to the cluster of aromatic amino acids, also impairs the hemolytic activity of StnII (59). Taken together, all these data suggest that the net of interactions among Ser-28, Arg-29, and Phe-106 (Lys-30, Arg-31, and Tyr-108 in EqtII) could be of great importance for actinoporins' activity (Fig. 9), a hypothesis that remains to be further explored in detail in the near future.
In short, this work allows a better understanding of the actinoporins' structure in the functional pore, including the relative orientation of the different secondary structure elements. The fact that no significant differences are found for membranes containing or not containing SM indicates that this lipid might not be necessary for the correct establishment of the functional pore. The analysis of nonhemolytic variants of StnII by means of ATR-FTIR will be undertaken in the future to discriminate the stages in which they are defective.
Acknowledgments
Dr. Goormaghtigh is Research Director with the Belgian National Fund For Scientific Research. J.A.-C. is the recipient of a fellowship from the Ministerio de Educación y Ciencia (Spain).
This work was supported by grant BFU2006-04404 from the Ministerio de Educación y Ciencia (Spain).
Editor: Anthony Watts.
References
- 1.Parker, M. W., and S. C. Feil. 2005. Pore-forming protein toxins: from structure to function. Prog. Biophys. Mol. Biol. 88:91–142. [DOI] [PubMed] [Google Scholar]
- 2.Anderluh, G., and P. Maček. 2002. Cytolytic peptide and protein toxins from sea anemones (Anthozoa: Actiniaria). Toxicon. 40:111–124. [DOI] [PubMed] [Google Scholar]
- 3.Bernheimer, A. W., and L. S. Avigad. 1976. Properties of a toxin from the sea anemone Stoichactis helianthus, including specific binding to sphingomyelin. Proc. Natl. Acad. Sci. USA. 73:467–471. [DOI] [PMC free article] [PubMed] [Google Scholar]
- 4.Linder, R., A. Bernheimer, and K. S. Kim. 1977. Interaction between sphingomyelin and a cytolysin from the sea anemone Stoichactis helianthus. Biochim. Biophys. Acta. 467:290–300. [DOI] [PubMed] [Google Scholar]
- 5.de los Ríos, V., J. M. Mancheño, M. E. Lanio, M. Oñaderra, and J. G. Gavilanes. 1998. Mechanism of the leakage induced on lipid model membranes by the hemolytic protein sticholysin II from the sea anemone Stichodactyla helianthus. Eur. J. Biochem. 252:284–289. [DOI] [PubMed] [Google Scholar]
- 6.Caaveiro, J. M., I. Echabe, I. Gutiérrez-Aguirre, J. L. Nieva, J. L. Arrondo, and J. M. González-Mañas. 2001. Differential interaction of equinatoxin II with model membranes in response to lipid composition. Biophys. J. 80:1343–1353. [DOI] [PMC free article] [PubMed] [Google Scholar]
- 7.Valcárcel, C. A., M. Dalla Serra, C. Potrich, I. Bernhart, M. Tejuca, D. Martínez, F. Pazos, M. E. Lanio, and G. Menestrina. 2001. Effects of lipid composition on membrane permeabilization by sticholysin I and II, two cytolysins of the sea anemone Stichodactyla helianthus. Biophys. J. 80:2761–2774. [DOI] [PMC free article] [PubMed] [Google Scholar]
- 8.Barlič, A., I. Gutiérrez-Aguirre, J. M. Caaveiro, A. Cruz, M. B. Ruiz-Argüello, J. Pérez-Gil, and J. M. González-Mañas. 2004. Lipid phase coexistence favors membrane insertion of equinatoxin-II, a pore-forming toxin from Actinia equina. J. Biol. Chem. 279:34209–34216. [DOI] [PubMed] [Google Scholar]
- 9.Alegre-Cebollada, J., I. Rodríguez-Crespo, J. G. Gavilanes, and A. Martínez del Pozo. 2006. Detergent-resistant membranes are platforms for actinoporin pore-forming activity on intact cells. FEBS J. 273:863–871. [DOI] [PubMed] [Google Scholar]
- 10.Mancheño, J. M., V. de los Ríos, A. Martínez del Pozo, M. E. Lanio, M. Oñaderra, and J. G. Gavilanes. 2001. Partially folded states of the cytolytic protein sticholysin II. Biochim. Biophys. Acta. 1545:122–131. [DOI] [PubMed] [Google Scholar]
- 11.Ulrih, N. P., G. Anderluh, P. Maček, and T. V. Chalikian. 2004. Salt-induced oligomerization of partially folded intermediates of equinatoxin II. Biochemistry. 43:9536–9545. [DOI] [PubMed] [Google Scholar]
- 12.Belmonte, G., C. Pederzolli, P. Maček, and G. Menestrina. 1993. Pore formation by the sea anemone cytolysin equinatoxin II in red blood cells and model lipid membranes. J. Membr. Biol. 131:11–22. [DOI] [PubMed] [Google Scholar]
- 13.Tejuca, M., M. Dalla Serra, M. Ferreras, M. E. Lanio, and G. Menestrina. 1996. Mechanism of membrane permeabilization by sticholysin I, a cytolysin isolated from the venom of the sea anemone Stichodactyla helianthus. Biochemistry. 35:14947–14957. [DOI] [PubMed] [Google Scholar]
- 14.Tejuca, M., M. Dalla Serra, C. Potrich, C. Alvarez, and G. Menestrina. 2001. Sizing the radius of the pore formed in erythrocytes and lipid vesicles by the toxin sticholysin I from the sea anemone Stichodactyla helianthus. J. Membr. Biol. 183:125–135. [DOI] [PubMed] [Google Scholar]
- 15.de los Ríos, V., J. M. Mancheño, A. Martínez del Pozo, C. Alfonso, G. Rivas, M. Oñaderra, and J. G. Gavilanes. 1999. Sticholysin II, a cytolysin from the sea anemone Stichodactyla helianthus, is a monomer-tetramer associating protein. FEBS Lett. 455:27–30. [DOI] [PubMed] [Google Scholar]
- 16.Mancheño, J. M., J. Martín-Benito, M. Martínez-Ripoll, J. G. Gavilanes, and J. A. Hermoso. 2003. Crystal and electron microscopy structures of sticholysin II actinoporin reveal insights into the mechanism of membrane pore formation. Structure. 11:1319–1328. [DOI] [PubMed] [Google Scholar]
- 17.Anderluh, G., M. Dalla Serra, G. Viero, G. Guella, P. Maček, and G. Menestrina. 2003. Pore formation by equinatoxin II, a eukaryotic protein toxin, occurs by induction of nonlamellar lipid structures. J. Biol. Chem. 278:45216–45223. [DOI] [PubMed] [Google Scholar]
- 18.Alvarez, C., F. Casallanovo, C. S. Shida, L. V. Nogueira, D. Martínez, M. Tejuca, I. F. Pazos, M. E. Lanio, G. Menestrina, E. Lissi, and S. Schreier. 2003. Binding of sea anemone pore-forming toxins sticholysins I and II to interfaces—modulation of conformation and activity, and lipid-protein interaction. Chem. Phys. Lipids. 122:97–105. [DOI] [PubMed] [Google Scholar]
- 19.Kristan, K., Z. Podlesek, V. Hojnik, I. Gutiérrez-Aguirre, G. Gunčar, D. Turk, J. M. González-Mañas, J. H. Lakey, P. Maček, and G. Anderluh. 2004. Pore formation by equinatoxin, a eukaryotic pore-forming toxin, requires a flexible N-terminal region and a stable beta-sandwich. J. Biol. Chem. 279:46509–46517. [DOI] [PubMed] [Google Scholar]
- 20.Malovrh, P., G. Viero, M. D. Serra, Z. Podlesek, J. H. Lakey, P. Maček, G. Menestrina, and G. Anderluh. 2003. A novel mechanism of pore formation: membrane penetration by the N-terminal amphipathic region of equinatoxin. J. Biol. Chem. 278:22678–22685. [DOI] [PubMed] [Google Scholar]
- 21.Athanasiadis, A., G. Anderluh, P. Maček, and D. Turk. 2001. Crystal structure of the soluble form of equinatoxin II, a pore-forming toxin from the sea anemone Actinia equina. Structure. 9:341–346. [DOI] [PubMed] [Google Scholar]
- 22.Hinds, M. G., W. Zhang, G. Anderluh, P. E. Hansen, and R. S. Norton. 2002. Solution structure of the eukaryotic pore-forming cytolysin equinatoxin II: implications for pore formation. J. Mol. Biol. 315:1219–1229. [DOI] [PubMed] [Google Scholar]
- 23.Martín-Benito, J., F. Gavilanes, V. de los Ríos, J. M. Mancheño, J. J. Fernández, and J. G. Gavilanes. 2000. Two-dimensional crystallization on lipid monolayers and three-dimensional structure of sticholysin II, a cytolysin from the sea anemone Stichodactyla helianthus. Biophys. J. 78:3186–3194. [DOI] [PMC free article] [PubMed] [Google Scholar]
- 24.Mancheño, J. M., J. Martín-Benito, J. G. Gavilanes, and L. Vázquez. 2006. A complementary microscopy analysis of Sticholysin II crystals on lipid films: atomic force and transmission electron characterizations. Biophys. Chem. 119:219–223. [DOI] [PubMed] [Google Scholar]
- 25.Goormaghtigh, E., V. Raussens, and J. M. Ruysschaert. 1999. Attenuated total reflection infrared spectroscopy of proteins and lipids in biological membranes. Biochim. Biophys. Acta. 142:105–185. [DOI] [PubMed] [Google Scholar]
- 26.Menestrina, G., V. Cabiaux, and M. Tejuca. 1999. Secondary structure of sea anemone cytolysins in soluble and membrane bound form by infrared spectroscopy. Biochem. Biophys. Res. Commun. 254:174–180. [DOI] [PubMed] [Google Scholar]
- 27.Anderluh, G., A. Barlič, C. Potrich, P. Maček, and G. Menestrina. 2000. Lysine 77 is a key residue in aggregation of equinatoxin II, a pore-forming toxin from sea anemone Actinia equina. J. Membr. Biol. 173:47–55. [DOI] [PubMed] [Google Scholar]
- 28.Alegre-Cebollada, J., G. Clementi, M. Cunietti, C. Porres, M. Oñaderra, J. G. Gavilanes, and A. Martínez del Pozo. 2007. Silent mutations at the 5′-end of the cDNA of actinoporins from the sea anemone Stichodactyla helianthus allow their heterologous overproduction in Escherichia coli. J. Biotechnol. 127:211–221. [DOI] [PubMed] [Google Scholar]
- 29.Ellens, H., J. Bentz, and F. C. Szoka. 1985. H+- and Ca2+-induced fusion and destabilization of liposomes. Biochemistry. 24:3099–3106. [DOI] [PubMed] [Google Scholar]
- 30.Polozov, I. V., A. I. Polozova, G. M. Anantharamaiah, J. P. Segrest, and R. M. Epand. 1994. Mixing rates can markedly affect the kinetics of peptide-induced leakage from liposomes. Biochem. Mol. Biol. Int. 33:1073–1079. [PubMed] [Google Scholar]
- 31.Fringeli, U. P., and H. H. Günthard. 1981. Infrared membrane spectroscopy. Mol. Biol. Biochem. Biophys. 31:270–332. [DOI] [PubMed] [Google Scholar]
- 32.Goormaghtigh, E., and J. M. Ruysschaert. 1994. Subtraction of atmospheric water contribution in Fourier transform infrared spectroscopy of biological membranes and proteins. Spectrochim. Acta. 50A:2137–2144. [Google Scholar]
- 33.Kauppinen, J. K., D. J. Moffatt, H. H. Mantsch, and D. G. Cameron. 1981. Fourier self-deconvolution: a method for resolving intrinsically overlapped bands. Appl. Spectrosc. 35:271–276. [Google Scholar]
- 34.Goormaghtigh, E., and J. M. Ruysschaert. 1990. Polarized attenuated total reflection infrared spectroscopy as a tool to investigate the conformation and orientation of membrane components. In Molecular Description of Biological Membrane Components by Computer-Aided Conformational Analysis. R. Brasseur, editor. CRC Press, Boca Raton, FL.
- 35.Goormaghtigh, E., V. Cabiaux, and J. M. Ruysschaert. 1994. Determination of soluble and membrane protein structure by Fourier transform infrared spectroscopy. III. Secondary structures. Subcell. Biochem. 23:405–450. [DOI] [PubMed] [Google Scholar]
- 36.Lorenz-Fonfría, V. A., J. Villaverde, and E. Padros. 2002. Fourier deconvolution in non-self-deconvolving conditions. Effective narrowing, signal-to-noise degradation, and curve fitting. Appl. Spectrosc. 56:232–242. [Google Scholar]
- 37.Goormaghtigh, E., V. Cabiaux, and J. M. Ruysschaert. 1990. Secondary structure and dosage of soluble and membrane proteins by attenuated total reflection Fourier-transform infrared spectroscopy on hydrated films. Eur. J. Biochem. 193:409–420. [DOI] [PubMed] [Google Scholar]
- 38.Surewicz, W. K., and H. H. Mantsch. 1988. New insight into protein secondary structure from resolution-enhanced infrared spectra. Biochim. Biophys. Acta. 952:115–130. [DOI] [PubMed] [Google Scholar]
- 39.Krimm, S., and J. Bandekar. 1986. Vibrational spectroscopy and conformation of peptides, polypeptides and proteins. Adv. Prot. Chem. 38:181–364. [DOI] [PubMed] [Google Scholar]
- 40.Susi, H., and D. M. Byler. 1986. Resolution-enhanced Fourier transform infrared spectroscopy of enzymes. Methods Enzymol. 130:290–311. [DOI] [PubMed] [Google Scholar]
- 41.Bechinger, B., J. M. Ruysschaert, and E. Goormaghtigh. 1999. Membrane helix orientation from linear dichroism of infrared attenuated total reflection spectra. Biophys. J. 76:552–563. [DOI] [PMC free article] [PubMed] [Google Scholar]
- 42.Marsh, D., M. Muller, and F. J. Schmitt. 2000. Orientation of the infrared transition moments for an alpha-helix. Biophys. J. 78:2499–2510. [DOI] [PMC free article] [PubMed] [Google Scholar]
- 43.Goormaghtigh, E., H. H. de-Jongh, and J. M. Ruysschaert. 1996. Relevance of protein thin films prepared for attenuated total reflection Fourier transform infrared spectroscopy: significance of the pH. Appl. Spectrosc. 50:1519–1527. [Google Scholar]
- 44.Raussens, V., J. M. Ruysschaert, and E. Goormaghtigh. 2004. Analysis of 1H/2H exchange kinetics using model infrared spectra. Appl. Spectrosc. 58:68–82. [DOI] [PubMed] [Google Scholar]
- 45.Noda, I., and Y. Ozaki. 2004. Two-Dimensional Correlation Spectroscopy. Applications in Vibrational and Optical Spectroscopy. John Wiley & Sons, West Sussex, UK.
- 46.Brauner, J. W., C. R. Flach, and R. Mendelsohn. 2005. A quantitative reconstruction of the amide I contour in the IR spectra of globular proteins: from structure to spectrum. J. Am. Chem. Soc. 127:100–109. [DOI] [PubMed] [Google Scholar]
- 47.Goormaghtigh, E., J. M. Ruysschaert, and V. Raussens. 2006. Evaluation of the information content in infrared spectra for protein secondary structure determination. Biophys. J. 90:2946–2957. [DOI] [PMC free article] [PubMed] [Google Scholar]
- 48.Hong, Q., I. Gutiérrez-Aguirre, A. Barlič, P. Malovrh, K. Kristan, Z. Podlesek, P. Maček, D. Turk, J. M. González-Mañas, J. H. Lakey, and G. Anderluh. 2002. Two-step membrane binding by Equinatoxin II, a pore-forming toxin from the sea anemone, involves an exposed aromatic cluster and a flexible helix. J. Biol. Chem. 277:41916–41924. [DOI] [PubMed] [Google Scholar]
- 49.Provencher, S. W., and V. G. Dovi. 1979. Direct analysis of continuous relaxation spectra. Can. J. Biochem. 1:313–318. [DOI] [PubMed] [Google Scholar]
- 50.Knox, D. G., and A. Rosenberg. 1980. Fluctuations of protein structure as expressed in the distribution of hydrogen exchange rate constants. Biopolymers. 19:1049–1068. [DOI] [PubMed] [Google Scholar]
- 51.Gregory, R. B., and R. Lumry. 1985. Hydrogen-exchange evidence for distinct structural classes in globular proteins. Biopolymers. 24:301–326. [DOI] [PubMed] [Google Scholar]
- 52.Lumry, R. 1994. Protein-Solvent Interactions. R. B. Gregory, editor. Marcel Dekker, New York.
- 53.Scheirlinckx, F., R. Buchet, J. M. Ruysschaert, and E. Goormaghtigh. 2001. Monitoring of secondary and tertiary structure changes in the gastric H+/K+-ATPase by infrared spectroscopy. Eur. J. Biochem. 268:3644–3653. [DOI] [PubMed] [Google Scholar]
- 54.Goormaghtigh, E., V. Cabiaux, and J. M. Ruysschaert. 1994. Determination of soluble and membrane protein structure by Fourier transform infrared spectroscopy. I. Assignments and model compounds. Subcell. Biochem. 23:329–362. [DOI] [PubMed] [Google Scholar]
- 55.Richard, J. A., I. Kelly, D. Marion, M. Auger, and M. Pézolet. 2005. Structure of beta-purothionin in membranes: a two-dimensional infrared correlation spectroscopy study. Biochemistry. 44:52–61. [DOI] [PubMed] [Google Scholar]
- 56.Drechsler, A., C. Potrich, J. K. Sabo, M. Frisanco, G. Guella, M. Dalla Serra, G. Anderluh, F. Separovic, and R. S. Norton. 2006. Structure and activity of the N-terminal region of the eukaryotic cytolysin equinatoxin II. Biochemistry. 45:1818–1828. [DOI] [PubMed] [Google Scholar]
- 57.Anderluh, G., J. Pungerčar, I. Križaj, B. Štrukelj, F. Gubenšek, and P. Maček. 1997. N-terminal truncation mutagenesis of equinatoxin II, a pore-forming protein from the sea anemone Actinia equina. Protein Eng. 10:751–755. [DOI] [PubMed] [Google Scholar]
- 58.Gutiérrez-Aguirre, I., A. Barlič, Z. Podlesek, P. Maček, G. Anderluh, and J. M. González-Mañas. 2004. Membrane insertion of the N-terminal alpha-helix of equinatoxin II, a sea anemone cytolytic toxin. Biochem. J. 384:421–428. [DOI] [PMC free article] [PubMed] [Google Scholar]
- 59.Alegre-Cebollada, J., V. Lacadena, M. Oñaderra, J. M. Mancheño, J. G. Gavilanes, and A. Martínez del Pozo. 2004. Phenotypic selection and characterization of randomly produced non-haemolytic mutants of the toxic sea anemone protein sticholysin II. FEBS Lett. 575:14–18. [DOI] [PubMed] [Google Scholar]
- 60.Anderluh, G., A. Barlič, Z. Podlesek, P. Maček, J. Pungerčar, F. Gubenšek, M. L. Zecchini, M. D. Serra, and G. Menestrina. 1999. Cysteine-scanning mutagenesis of an eukaryotic pore-forming toxin from sea anemone: topology in lipid membranes. Eur. J. Biochem. 263:128–136. [DOI] [PubMed] [Google Scholar]
- 61.Humphrey, W., A. Dalke, and K. Schulten. 1996. VMD: visual molecular dynamics. J. Mol. Graph. 14:33–38,27–28. [DOI] [PubMed] [Google Scholar]


